Richard Willoughby
The temperature measured across the globe in October 2023 has set a new record high anomaly. With that as the backdrop, this essay looks at the predictive skill of climate models in forecasting the record.
Anomalies – A Brilliant Deception
Climate botherers are fixated on temperature anomalies and have convinced sufficient number of voters that 1.5C rise in global average surface temperature (GAST) is a critical threshold for the globe. October 2023 came perilously close to breaching the threshold so it deserves closer analysis as to what it means and how well various climate models have managed to forecast this outcome.
Temperature of the Lower Troposphere
This analysis begins with the examination of the temperature of the lower troposphere produced by the satellite remote sensing system (RSS) and displayed below in Chart 1.

The data is available at KNMI but was last updated in July 2023, which is usually the yearly peak; reaching minus 0.16C in that month. October is typically 2C lower that July. A key feature of Chart 1 is the trend; rising at 2.1C/century. The regression coefficient is only 6.29% due to the significant annual swing in the range 3 to 4 Centigrade degrees. However, if this data is reduced to an anomaly relative to the same month over a 30 year period to iron out the annual variation, the result gets closer to a trend line as shown in Chart 2.

The trend line has almost the same slope; increasing at 2.1C/century as in Chart 1 but now the regression coefficient improves dramatically to 71.4%. Given the high correlation, it is reasonable to expect this trend to continue for the next 76 years such that the RSS TLT will reach 1.1C in July 2100. And there are certain to be many more months prior to that year when the 1.5C threshold will be exceeded. In fact, October 2023 probably exceeded the 1.5C threshold. The RSS TLT only needed to reach minus 2.85C in October 2023 to exceed the threshold.
Taking A Global Perspective
Reducing the monthly GAST to a single anomalous value is somewhat deceptive. It is as if all surfaces are created equal so it is OK to average them over a whole range of different surface. But this is not based on sound thermodynamic principals. A first step in getting a better appreciation of the significance of record temperatures in 2023 is to examine the warmest month in 2023 with the same month in 1982, the early days of remote satellite sensing to observe how the entire global temperature has responded regionally per Image 1.

The first observation is that the entire globe has not warmed. Some locations are up to 7.1C cooler than in July 1982 and some are 7.4C warmer. The warmest regions are in the Northern Hemisphere while the coolest regions are in the Southern Hemisphere. The area average increase in temperature is 1.3C corresponding to 3.2C/century so slightly above the trend.
Note also that even this satellite determined temperature is not global. The coldest regions near the poles are excluded from the measurement.
Global Land
It is evident that the thermodynamic response of land surfaces and water surfaces are different. Land responds faster and over a wider temperature range for a given thermal energy input than water. Image 2 indicates the temperature difference from October 1982 to October 2023, the month of highest anomalous GAST, for just land surface, excluding Antarctica, based on the Global Historic Climatology Network (GHCN) measurement.

The area average temperature increase over the land is 2.5C, corresponding to 6.1C per century. Some land surface has cooled by as much as 4.3C while some warmed by up to 14.1C. The highest temperature increase is in the high latitudes in the Northern Hemisphere likely to have been permafrost back in 1982.
Global Ocean
The Reynolds optimally interpolated ocean surface temperature data set is not yet available for the NH summer and fall of 2023 so the ocean surface analysis is stepped back a year by comparing August 2022 to August 1982 as displayed in Image 3.

The increase in area average temperature is 0.5 Centigrade degrees with a range in difference of minus 3.6 to plus 13.1 Centigrade degrees. The region with the most warming is near the Russian coastline in the Arctic and likely due to earlier annual loss of sea ice in 2022 relative to 1982.
There are large regions of the oceans in the SH that are now cooler than 1982. The cool zone along the tropical Pacific was likely warmer in 2023 than 2022 due to El Nino conditions prevailing. Combining the 0.5C for ocean with the 2.5C for land, gives an area average increase of 1.13C, which is slightly lower than the 1.3C over the same period for the RSS TLT. It is more than likely that the October 2023 ocean temperature increase is slightly more than 0.5C due to El Nino conditions prevailing in 2023.
Predictions from Selected Climate Models
The following four images, numbered 4 to 7, compare the predicted results for global temperature based on CMIP6 SSP85 input from various climate prognosticating groups based in regions as follows:
- ACCESS6 – Australia
- INM6 – Russia
- MIROC6 – Japan
- GISS6 – USA
The comparison is for October 2023 against the baseline of actual measured values using GHCN for land and MODIS for ocean surface. MODIS was selected for SST because it is available for October 2023 but has some data gaps observed as greyed pixels in the images. The colour scale for all images is ranged from minus 5 to plus 5 in Centigrade degrees. Regions of red indicate where the model runs hot while blue indicates where the model runs cold.


Compared to measured data, all the models have a tendency to cool the NH and warm the SH. The scale has a range of ten Centigrade degrees but that was chosen to produce nuanced images. The variation is much wider for certain locations. The Greenland Plateau has predicted temperature considerably lower than measured in all models. The average temperature for each of the four models is:
- ACCESS6 – 15.7C
- INM6 – 14.7C
- MIROC6 – 16.3C
- GISS6 – 15.3C
The maximum difference of 1.6C is between the MIROC6 and INM6 models. Image 8 shows how the difference varies across the globe. The difference has a range from minus 9.4 to plus 25.4 Centigrade degrees. The greatest difference is at both poles.

It might be assumed that the MIROC6 model has already reached the dreaded tipping point but the temperature in both polar regions is still well below freezing but just not as cold as the INM6 prediction.
Conclusion
As of October 2023 the difference in average temperature between the models already exceeds the 1.5C threshold and each of the models goes on to predict a future to 2100. By then the difference in average temperature between the highest and lowest reaches 2.3 Centigrade degrees. The regional differences between the two models cover a range of 34.8 Centigrade degrees.
The predictive capability of climate models at regional level is far worse than forecasting that any month of next year will be the same as the corresponding month this year. In fact the measured temperature at any location for any month forty years ago is a better predictor at regional temperature now than any climate model.
The common difference for all models relative to measured temperature, with the SH running hot and the NH running cold, indicates a systemic error in understanding the natural driver of climate change. The models are incapable of producing any regional cooling trend so the observed regional cooling trends in the SH invalidate the models.
The notion that regional temperatures across the globe can be averaged to produce the GAST as something meaningful indicates no understanding of thermodynamics. Debating the difference in GAST from one period to next to a fraction of a degree is mindless nonsense. The notion the 1.5C increase in GAST will cause a tipping point is in the realm of utter nonsense.
An Important Question
Do climate models offer a firm basis for attempting to re-engineer the entire global economy?
The Author
Richard Willoughby is a retired electrical engineer having worked in the Australian mining and mineral processing industry for 30 years with roles in large scale operations, corporate R&D and mine development. A further ten years was spent in the global insurance industry as an engineering risk consultant where he developed an enduring interest in natural catastrophes and changing climate.
Richard Willoughby’s closing question was, “Do climate models offer a firm basis for attempting to re-engineer the entire global economy?”
The answer is no, but the author in this post is discussing weather not climate…the same mistake made by many alarmists.
Regards,
Bob
Average temperature anomalies in the Southern Hemisphere have been negative for several years, as indicated by sea surface temperatures, and this despite El Niño. A monsoon is raging in northern Australia as if it were La Niña. This is definitely “climate,” certainly Australia’s.

Ireneusz Palmowski said, “Average temperature anomalies in the Southern Hemisphere have been negative for several years, as indicated by sea surface temperatures…”
Data (Reynolds OI.v2 SST data) contradicts this bizarre claim. See attached graph of Southern Hemisphere sea surface temperature anomalies.
Regards,
Bob
Let me try again to attach that graph:
It is the measurements that are flawed. Thermometers do not indicate the temperature of the air, as this is regulated by convection. During a stationary high, such as in Canada in summer, solar radiation can warm the surface very much. I don’t believe in current temperature measurements, because circulation in the troposphere does not respond to these measurements.
Ireneusz replied, “It is the measurements that are flawed. Thermometers do not indicate the temperature of the air, as this is regulated by convection.
You presented a map of sea surface temperature anomalies based on sea surface temperature data and made a bogus claim. I showed you that you are wrong by presenting the sea surface temperature anomaly data in time-series graph for the Southern Hemisphere.
Regards,
Bob
I advise you to notice what is happening with the circulation in the southern hemisphere.
http://tropic.ssec.wisc.edu/real-time/mtpw2/product.php?color_type=tpw_nrl_colors&prod=spac×pan=24hrs&anim=html5
http://tropic.ssec.wisc.edu/real-time/mtpw2/product.php?color_type=tpw_nrl_colors&prod=samer2×pan=24hrs&anim=html5
I do NOT care, Ireneusz. It has no relationship to your earlier bogus comment about sea surface temperatures.
Good bye. You are wasting my time and the time of all the people reading this thread.
Regards,
Bob
The 30-day SOI already exceeds 7. The South Pacific is cool.
https://www.longpaddock.qld.gov.au/soi/
A strong tropical storm in the Coral Sea, approaching land.

Ireneusz: Why do you insist on presenting weather in a discussion of climate?
GOOD-BYE. You truly are a waste of everyone’s time.
Which graph should we trust – Ireneusz’s map shows lots of blue in the south, and your graph shows about+0.15°C anomaly for the bottom half of the world. Is it possible that a lot of meaningful information is lost when looking at the average for such a large area?
PCman999, Ireneusz’s map is a cherry-picked snapshot of weather for a specific day that he nonsensically claims represents the past decade, while the Reynolds OI.v2 SSTa data presented in that graph are monthly averages. There’s no way to compare the two.
Regards,
Bob
You’re right about one thing that we in Australia are acutely aware of … the ‘raging’ monsoon in the north (normal Australian weather) bears all of the hallmarks of la Nina. The ENSO meter is starting to show a retreat from el Nino and that great tongue of cold water emanating from Chile is looking ominous. Just observing.
The changes that are taking place in the stratosphere in the north are also definitely climate, as North America is finding out every year.

Why are you presenting weather maps as evidence of climate? Apparently you do not understand the word CLIMATE.
Regards,
Bob
I live on the “Globe”.
The all time record (ambient temperature) high for where I now live in central Ohio was 106*F set July 14, 1936. The all time record (ambient temperature), low was -22*F set in January 1,1994 (I worked outside during that period. Dayshift, so it was insignificantly a bit warmer.)
Why does my little spot on the Globe count?
Why does the all time record high set almost 30 years before the all time record low not matter?
(I’d suggest that readers check (search) out their own local record highs and lows. Do the dates line up with the “Global Warming” meme? My little spot on the Globe seems to be an exception … er… “anomaly”. Is your’s also?)
I may have put this in at the wrong point in the exchange but, the point is still valid.
How many other “spots on the Globe” records don’t line up with the meme?
(May I suggest using “TheWayBackMachine” to double check. I’ve noticed about 10% of the day to day record highs and lows have been “adjusted” but the all time records have remained the same, using TWBM, going back to 2002.)
Gunga Din, I have no idea how your comment is a response to the one I made at 6:16 am.
Regards,
Bob
UPDATE: It appears you replying to my comment while I was writing it.
Apologizes to both of you.
One glass too many.
However, I don’t think that suggesting people checking their own local record highs and lows is a bad suggestion. (All time record highs and low will likely be the last to be “adjusted”. Such would be more noticeable.)
However, not inline with what you were discussing.
Again, respects to you both.
And, thank you, Bob, for not just sending my comment into oblivion!
Your comment is something REP would have done.
No apologies necessary, Gunga Din. And I agree that it’s a good idea that people check their local record highs and lows. Thanks for that. I’ll use it during discussion with AGW-believing neighbors.
Regards,
Bob
We all have problems.
This is not one of mine. 😎
You “worked outside” during the period July 14, 1936 to January 1, 1994? Starting in 1936?
You’re a better man than I am, Gunga Din.
“Why does the all time record high set almost 30 years before the all time record low not matter?”
That’s 58 years actually, and working outside in 1936 is impressive enough…he had a job during the Depression, lol.
His opening statement is nonsensical: “The temperature measured across the globe in October 2023 has set a new record high anomaly”
There is no temperature measured across the globe.
The opening statement was quite obviously sarcasm. For example, taking the mickey out of morons who proclaimed the reported anomaly as evidence of “global boiling”.
No scientist takes climate models serious or the notion of a GAST as meaningful with regard Earth’s climate. The models deserve derision and ridicule. That was the intention of this post.
Climate models are a sad joke on science and people who claim to be scientist.
I didn’t get that from it. He might have been sarcastic regarding “record high anomaly”, but that’s about it.
An informative analysis.
The kindest thing one could say about climate models is that they’re “good enough for government work”.
And that’s not saying much.
That’s actually worrisome!
HEY!
I worked for my local Government in water treatment.
I did my best but was often ignored by the decision makers … hmmm … OK … “good enough for government work”. 😎
Government malfeasance for its renewables agenda?
GISS?
RSS?
Why use adjusted temperatures?
Especially temperature data sets that cool the past and warm the present. Of course, one gets lopsided comparison results, then.
The key point of the post is to highlight the absurdity of arguing over fractions of a degree in anomalous measurements. It is playing a silly game that is unscientific.
The aim of the post is to highlight just how useless climate models are. The one useful insight is that the warming is not the result of CO2. CO2 induced warming has to be global so any sustained cooling trend in any region invalidates all climate models.
The October 2023 record anomaly that had the UN heads hyperventilating was mostly the results of the land along the Arctic coast being up to 14.1C warmer than in October 1982. That conveys meaning. And was it just coincidence that Alaska and Siberia had record snowfall later in the year.
That this was inevitable when the circulation diverted water vapor from the Pacific to the Bering Sea.
I think you answered your own question. ATheoK.
Using anomalies does have some scientific merits.
But it has much larger narrative/ political uses.
By continuously adjusting today’s anomalies upwards and yesterday’s anomalies downwards, it is possible to claim “rising” temperatures all the time for ever.
Hence we get claims of global boiling when actual temperature changes are very mild. Global mild-ing doesn’t scare many people.
Anomalies have very little scientific merit. The variance of the anomalies are the sum of the variances of the anomaly components, meaning the uncertainty of the anomalies is higher than that of the anomaly components. It’s not very “scientific” to substitute a value with higher uncertainty for one with a lower uncertainty.
There *is* a reason why climate science so adamantly refuses to use the statistical descriptor of variance for describing their data. Variance is a metric for uncertainty of the average of a distribution, even for Gaussian distributions.
“The predictive capability of climate models at regional level is far worse than forecasting that any month of next year will be the same as the corresponding month this year. In fact the measured temperature at any location for any month forty years ago is a better predictor at regional temperature now than any climate model.”
I’ve been saying for 20+ years now. The biggest problem with climate computer models is getting them to matchup to reality.
Well if they’re not using models, they certainly can’t be using observations.
Think your point 4 is in error. The models, or their projections, are indeed the main reason policymakers give for thinking there is a climate crisis. They then go on to propose measures which will be both impossible and useless if possible to change the outcomes of these projections, to limit warming. But the entire thing rests on the two pillars, one that the model projections are realistic, two that the measures taken will change outcomes and stop the warming which the models are forecasting.
I think it is not in error whatsoever. To be sure, there is a lot to unpack in the question: “Do climate models offer a firm basis for attempting to re-engineer the entire global economy?” For one thing, climate models are not prescriptive – they don’t inherently suggest any action should be taken politically or economically. That’s for voters and policymakers to do. They are certainly valuable decision-making tools, but they cannot alone drive any course of action, which must include input from economic theory, political persuasions, social values, and technological capability.
There is also the fact that no one is proposing to “re-engineer” the global economy, nor is such an aim actually a feasible thing to do owing to the complexity of the economic machine. You can make changes to elements of the economy – trying to drive a shift to cleaner fuels, but this falls far short of a purposeful re-engineering of the global economy. This kind of phrasing is just a boogeyman for conservatives to work themselves up over.
And finally, of course, climate models are not the only tool we use to explore how our actions affect the global climate. General Circulation Models (what people usually mean when they say “climate models”) are but a single class of numeric models to begin with, and we also have abundant observational, paleological, and theoretical evidence to draw from. This idea that all of climate science and our awareness of future climate change rests entirely on the robustness of a single class of numerical models is simply wrong on its face.
So much nonsense, so little sense.
You are correct, there are no climate models standing up and giving speeches.
However the bogus predictions being made by the climate models are being used as evidence by those who want to re-engineer the world’s economies.
You’re using weasel words to try to shift the meaning of Willoughby’s obviously incorrect sentiment. Now climate models are not the “basis” of anything they’re merely “evidence being used,” (and who would disagree that climate models are evidence being used to understand climate change?) and they aren’t part of an “attempt,” they’re just cited by people who “want to” re-engineer the economy. Ok, whatever. The typical WUWT-acolyte contrarianism in action.
Models aren’t evidence, they are computer generated guesswork.
Yes, “evidence” can be presented as testimony in an attempt to give credence to any claim.
However, as judges and juries often find, “evidence”, even so-called “expert evidence” is misinterpreted or totally wrong.
In the scientific method, “evidence” must be tested by observations and replicability.
Climate “science” scoresheet on this is abysmal.
Climate models are indeed pushing this affair along.
Of course the goal is to re-engineer the global economy. Every industry must change. Everything- all transportation, all heating, all agriculture, all industry- everything- what’s left?
“… abundant observational, paleological, and theoretical evidence to draw from”
Observational evidence is that there are not more hurricanes, floods, droughts, forest fires, crop failures than in the past. What paleological evidence- tree rings?? Theoretical? There is debate on the theoretical issues.
“This idea that all of climate science and our awareness of future climate change rests entirely on the robustness of a single class of numerical models is simply wrong on its face.”
The entire climate emergency is wrong on its face. And if you think nobody is actually calling it an emergency, come here to Wokeachusetts- the state uses that phrase.
911 operators won’t log your call to report a declared “climate emergency”.
Now THAT is an observed, replicable fact.
The paleo “evidence” is utter garbage, across the board. Mainly because all of it has been cherry-picked to oblivion, then mangled with intentionally bogus stats, for “the cause”.
no one is proposing to “re-engineer” the global economy,
That may not seem to be the case but in reality, it is.
“There is also the fact that no one is proposing to “re-engineer” the global economy”
Seriously!! Have you been hiding is a sealed padded basement, or just been mentally asleep for the last 10 years..
What do you think idiotic policies like Net-Zero are all about !
UK and Germany have all but destroyed themselves on the altar of climate models
“There is also the fact that no one is proposing to “re-engineer” the global economy”
The damage and destruction of Net Zero will be limited to just the economies of the Western Democracies. Other nations on Earth aren’t stupid enough to do away with the lifeblood of their economies: natural gas, oil, and coal.
The notion of a climate crisis is entirely due to forecasts of the future. This is what it rests on. The forecasts are entirely model based. Without the models, or if the models showed no material future warming, there would be no alarm, and no attempts to reduce CO2 emissions.
As to whether Net Zero is re-engineering the global economy. I didn’t use that description, its too vague to be useful. What is being advocated and proposed is very large reductions in CO2 emissions. From about 38 billion tons a year down to something like 5 billion. This would mean an end to mining and burning of coal and an end to much use of oil and gas for fuel.
You can call this what you like: the fact is its major changes of both behavior and direction. Social and economic life would be very different. Its abolition of the car, of coal mining and use, of burning of natural gas. To get a picture of it, imagine 1920 or even earlier but without heavy industry and with even earlier levels of shipping and trade.
The only reason anyone is prepared to even contemplate advocating or doing this is because of the fear of pending climate disaster coming towards us, and the only reason they fear that is because climate models forecast high levels of warming.
You doubt it? The reason that skepticism about whether there is a climate crisis attracts such virulent reactions is that because all the advocates admit what I just said. That without forecasts of disaster all the policy prescriptions lose all their justification. And without the models, you have no credible forecasts.
The forecasts are not entirely model-based, this is a great lie sties like this one propagate. Forecasts of future climate change are certainly informed by GCMs (again, these are what most people mean when they say “climate model”), but such models are but a single class of models used to understand the climate, and we have an abundance of observational evidence of current and paleo changes in the climate to inform us about the future, in addition to the basic laws of physics and fluid dynamics. If we didn’t have global general circulation models, we would still have extremely robust estimates of sea level rise, planetary temperature change, glacial retreat, Arctic amplification, etc.
“Imagine this completely made-up scenario I’ve invented in my head to scare myself” is not a compelling argument. No one is talking about banning the automobile or stopping industry and trade.
“No one is talking about banning the automobile or stopping industry and trade.”
No, or at least not explicitly in the mainstream, though the wilder fringes of the alarmists are. But what you have to explain is how the world is supposed to get to 5 billion tons or lower CO2 emissions without doing that. Take any big economy, take the US as a for instance. Right now about 5 billion tons a year. To get the whole world below 5 billion its going to have to fall to around 0.5 billion or lower.
What is the US social environment and economy going to look like when that is done? How are people going to travel, cool and heat their homes? What is industry going to work on? Where is everyone going to live?
Take China. Now around 11 billion tons a year. Going to have to get down to something in the region of 1 billion or lower. What is the Chinese economy and society going to look like? What happens to all those cars? All those high-rises?
Or if that is all too hard, take a simpler case, the UK. Right now around 450 million tons. The plan is to get it to Net Zero. What is the UK going to look like when and if that is done? How are people going to do transport? How many cars will there be? How much will they drive, all compared to now?
You are right, no-one in charge of policy or the media has worked out any realistic plans for what that will look like. But it cannot be done with life going on as now, its just that the cars are EVs and the power generated by wind.
What about emissions from ships and planes? Are they to carry on just as now? From concrete? If you are serious about the goal of 5 billion you have to recognize and list the real changes that this goal will require. And not just from the West. Above all from China and India.
I suggest that one of two things is going to give. Either Net Zero is not going to be achieved. This is most likely to the point of almost being certain. Or if it is, its going to be back to pre-1914. The reason is intermittency of wind and solar isn’t going to permit just moving to them for generation and moving heat and transport to electricity. So social and economic life is going to change to allow the lower energy use.
It will be pre-1914 with computers and antibiotics. But it will be in other respects the same, less mobile, poorer, and a lot colder.
I don’t think there is the slightest chance of it happening. The West, or the English speaking countries at least, may be crazy enough to try. But no way is China or India or the rest of the world going to do anything of the sort.
You raise some very good points.
I try, for the most part, to confine my comments here at WUWT to subjects dealing with the scientific aspects of climate change. To challenging the outright nonsensical denial that global warming is happening, for example (less common these days than when this blog first started, to be sure).
I agree with many of your comments though, on the social and economic implications. I am not a ‘leftist’ (or a ‘rightist’). There are going to be very tough times ahead either way.
If we do nothing to curb emissions, then we will have to concentrate our efforts on mitigation; flood defences, coping with mass human migration and the like.
If we curb emissions then we will suffer economically, to some extent; at least in the early period.
It’s Hobson’s choice. We have to pick one.
“I try, for the most part, to confine my comments here at WUWT to subjects dealing with the scientific aspects of climate change”
No, you don’t. Because climate change is *NOT* science, it is religious dogma.
Physical science requires measurements to be stated with the measurement uncertainty included. That measurement uncertainty has to be properly propagated onto *any* statistical descriptor of the measurements.
Climate science even eschews providing variance values for the distributions they use – a REQUIREMENT to adequately describe even a Gaussian distribution.
Climate science ignores this from the very base of finding a daily “average”. It’s not an average, it’s a median value of a multi-modal distribution, non-Gaussian distribution. Using it as an average to combine with other averages does nothing but compound the inadequacy of the subsequent averages.
Sherr has posted historgrams recently showing that daily temps are not a Gaussian distribution.
“f we do nothing to curb emissions, then we will have to concentrate our efforts on mitigation; flood defences, coping with mass human migration and the like.”
So what? We will also see increased food production, fewer deaths from cold, less energy expended for heating on a global basis, etc.
As Freeman Dyson pointed out, the climate models are not holistic in any way. They simply do not provide *any* kind of a basis for making actual policy. Those depending on them focus only on *possible* negatives and NEVER consider the positives!
“There are not enough viable solutions being proposed” is a far cry from “attempting to re-engineer the entire global economy.” The latter is a paranoid conspiracy theory, the former is just an acknowledgement of the scale of the problem.
I also don’t think we will keep warming below 1.5 degrees. I think we should aim toward that target, and we’ll land somewhere beyond it, but below the worst case scenarios. Every little thing we do manage to do will be an improvement over doing nothing. It’s not a black and white scenario.
You are not addressing the point. The advocates of a climate crisis tell us that disaster is coming, that we have to lower global emissions to or below 5 billion tons a year to avert it. They base their scenarios on models, and specifically on the scale of the supposed disaster which is quantified by the models.
Like you, however, they re unwilling or unable to say what society will be like when their prescribed reductions have been made. What the US will be like at 500 million tons a year, down from around 5 billion now. What the UK will look like at 20 or 30 million, down from 450 million now.
Its not that there are ‘not enough viable solutions being proposed’. The solution of back to 1914 is perfectly viable. It would work, and its the only thing that we have available.
The problem is that the only way of getting to the level of reductions which the activists claim to be necessary is to close down all fossil fuel use in transport, heating, industry. The problem is that the activists will not come clean about the policy implications of what they claim to want and think necessary.
One notices, for instance, that you have declined the challenge to say what the US or UK or China would look like if the reductions the activists want were actually made. None of the mainstream activists will come clean about it.
It really will be re-engineering the entire global economy, which is at the moment heavily based around oil, gas and coal. Close that down and ‘total re-engineering’ is a reasonable short hand characterization of what it will involve.
I would say that is basically acknowledging the scale of the task which the activists want to commit us all to. Nothing paranoid about it. Anything less is just wishful thinking. It really is an absolutely huge task, and the activists are basically in denial about it. Or are deliberately mis-selling us on what it means.
You don’t agree, fine, just get specific about the reductions in China, US or UK and show that it is less of a task than that phrase suggests. You can’t. Its truly enormous.
“The problem is that the only way of getting to the level of reductions which the activists claim to be necessary is to close down all fossil fuel use in transport, heating, industry. “
The greenies like AlanJ have absolutely NO IDEA of the reductions necessary.
What are windmill blades made of? The construction materials are based on oil, be it fiberglass, kevlar, or whatever. Kill oil and you kill windmills – no more renewable power from wind.
What is the typical battery enclosure made with? Plastic. Kill oil and there goes your grid-level battery backup installations.
What are homes insulated with? Typically fiberglass or polyurethane. Kill oil and you kill insulation for homes meaning higher energy costs or going back to the 1900’s for building construction. Adobe anyone? Sod anyone?
What are many medical syringes made of today? Kill oil and we’ll be back to glass and metal syringes – spreading disease and limiting treatments like insulin.
“Anything less is just wishful thinking. It really is an absolutely huge task, and the activists are basically in denial about it. Or are deliberately mis-selling us on what it means.”
They *are* lying, pure and plain. They like the feeling of telling people how they must live – and die.
It stems from bureaucrats general lack of competence in anything associated with reality.
‘Climate models are not being used as the singular basis for “reengineering the global economy,” this is a straw man argument.’
Please. I don’t think the author used the word ‘singular’, hence the straw man argument was wielded by you. Congratulations.
“ … one regional and three global climate elements are estimated to likely pass a tipping point if global warming reaches 1.5 °C (2.7 °F), namely Greenland ice sheet collapse, West Antarctic ice sheet collapse, tropical coral reef die off, and boreal permafrost abrupt thaw.”
https://en.wikipedia.org/wiki/Tipping_points_in_the_climate_system
Tipping points might be reached above 1.5 degrees, some might be reached prior to that, some might be reached above 2 degrees. The point is that 1.5 degrees is not the magic climate number, it’s just an agreed on target. It is better to limit warming to under 1.4 degrees than under 1.5, and better to limit it under 1.3 than 1.4, and so on. This notion that any scientist has said 1.5 degree is a magical number that promptly explodes the world once reached for a single millisecond is just a myth propagated entirely by right wing climate denialists.
AlanJ
lts interesting that the 1.5C number was chosen as a tipping point.
As that is often the difference between what the temps my glass thermometer records compared to what the local AWS’s record during the daytime.
Originally the ooga-booga climate catastrophe was 2C.
But apparently, focus groups weren’t overly sure that that number wasn’t just pulled out of someone’s anus, so a more marketable number was agreed to be 1.5C
I reckon to be REALLY convincing, they should have made the number 1.487C.
Yer! there is alot suspect data helping to prop up this climate crisis con.
One been them taking advantage of the fact that electonic thermometers are “running warm” when compared to a glass thermometer
Today’s been a great example of this. At 2:30pm UK time my glass thermometer recorded the temp at 8.2C. While at the same time the local AWS where recording (9.7C in a town) and (9.5C in a rural area) and its not just one off.
This sort of thing is hppening daily.
You’re right, 1.5C was pulled out of somebody’s anus whilst he was sitting around at the Potsdam Institute for Climate Impact Research … Stefan Rahmstorf.
How many times? It isn’t expected to be a tipping point.
Those are your words.
So you are admitting that 1.5C is a totally meaningless number in terms of climate.
Yes.. we know that.
The number is a target, something to be aimed toward. Research shows that each incremental increase in global temperature increases the likelihood of severe impacts. A warming of 1.4 degrees will have substantial impacts on ecosystems and human societies, as well a warming of 1.6 degrees, but both will be less severe than a warming of 2 degrees. The idea is to find a target that is achievable and will limit adverse impacts as much as possible. Whether society can meet the target is a political question. I think it’s unlikely, but if by trying and failing to limit warming to below 1.5 degrees, we limit it to below, say, 1.6, it will be worth the effort.
The lie that is told ad nauseum on WUWT and other contrarian media outlets is that scientists are claiming that 1.5 is some magical number beyond which the world ceases to exist. These outlets plant this false notion so that they can continue to misinform and deceive gullible people like you by obfuscating the issue and sowing confusion.
“Research shows that each incremental increase in global temperature increases the likelihood of severe impacts.”
Link , please .
What research ???
This will be a good starting place for you:
https://www.ipcc.ch/sr15/
Once you’ve digested the report and assessed relevant cross references and citations I will be happy to provide more literature. Let me know if you have questions in the meantime.
You mean the report that says this:
“There is also (high confidence) global warming has resulted in an increase in the frequency and duration of marine heatwaves.”
Where is this happening?
“Further, there is substantial evidence that human-induced global warming has led to an increase in the frequency, intensity and/or amount of heavy precipitation events at the global scale (medium confidence), as well as an increased risk of drought in the Mediterranean region (medium confidence). “
Where is this happening?
“Trends in intensity and frequency of some climate and weather extremes have been detected over time spans during which about 0.5°C of global warming occurred (medium confidence). This assessment is based on several lines of evidence, including attribution studies”
Fewer hurricanes are an increase in intensity and frequency?
“Climate models project robust2 differences in regional climate between present-day and global warming up to 1.5°C3”
I thought you said it wasn’t climate models that were predicting these things?
“The number of exceptionally hot days are expected to increase the most in the tropics, where interannual temperature variability is lowest; extreme heatwaves are thus projected to emerge earliest in these regions, and they are expected to already become widespread there at 1.5°C global warming (high confidence). “
I thought it is Tmin that is going up. How does this cause an increase in “exceptionally hot days”?
Nothing you say or provide substantiates the claims you are making. Did you think we couldn’t read?
Hey there buddy, you have to read further than the summary page if you want to learn all the good stuff. Read the chapters, follow the references to the relevant chapters of the assessment reports, follow up on literature citations. Don’t be a lazy butt. You’ll get there, I know it, you can find all the answers to your questions and so much more.
I read the document *you* linked to. I gave you exact quotes out of it.
*YOU* provided the link as proof of your statement about the 1.5C, not me.
And now you say I need to read *other* documents?
Got caught with your pants down once again, didn’t you?
I’ll ask again, did you *really* think we couldn’t read?
Sometimes scientific reports begin with a brief summary of the material that will be contained in the full body of the report. Often, that summary does not include every single detail about every single question that might pop into a reader’s head while going through the summary. That is the case here. The questions you ask are all answered in the actual body of the report, and where even more detail is required, there are citations to sections of other IPCC reports, and citations to relevant scientific literature. You have to do the work of following up all those threads. It’s part of being a scientifically literate adult, I’m afraid.
Oh, I reckon you can read. The question is, at what grade level? Sometimes I do wonder.
The statements I quoted stand alone as proof that your assertion was not correct. Now you are throwing out a red herring trying to deflect.
If the questions are answered why don’t you provide even one? This sounds a lot like the argumentative fallacy of Appeal to Authority when the authority is non-existent.
“You have to do the work of following up all those threads. It’s part of being a scientifically literate adult, I’m afraid.”
*YOU* are the one that made the assertions, not me. It’s up to *YOU* to defend your assertion, not me. *YOU* provide the quotes backing up your assertion, not me!
LameJ regurgitates the political lies of the IPCC…
Not surprised.
“Research shows that each incremental increase in global temperature increases the likelihood of severe impacts.”
What research? Be specific!
Research predicting crop failures and mass starvation?
Research predicting catastrophic species extinction?
Research predicting the Artic will be ice free by now?
Research predicting more catastrophic hurricanes?
Research predicting more droughts?
Research predicting more flooding?
None of this research has come to fruition, NONE. Yet it is ALL based on climate model predictions for temperature.
“ It is better to limit warming to under 1.4 degrees than under 1.5, and better to limit it under 1.3 than 1.4, and so on.”
Record grain harvest being set every year and at least a 13% greening of the planet would argue that neither of these is better!
Freeman Dyson criticized the climate models for not being holistic at all. And they aren’t.
Tipping point implies that once it is reached it will continue on its own to a catastrophic end. Yet you claim the climate models are not what is driving the claims for tipping points? It is the climate models that are predicting an earth with boiling seas and an atmosphere on fire – nothing else exists to support those claims besides the climate models.
As usual, you want your cake and to eat it also. You want everyone to believe the predicted future of the climate models while also claiming they don’t predict anything.
Pick one and stick with it!
“The point is that 1.5 degrees is not the magic climate number, it’s just an agreed on target. It is better to limit warming to under 1.4 degrees than under 1.5, and better to limit it under 1.3 than 1.4, and so on.”
Can you say: Speculation, Assumptions, and Unsubstantiated Assertions?
That’s what all that is.
WHY is it better to limit warming? It is always simply asserted. Why would it not be better to have milder winters and longer growing seasons?
And the last million or so years as evidence of the likely tipping points would advise us that the next tipping point is the descent into glaciation. That’s a tipping point that we surely want to avoid.
And finally dear AlanJ, could you kindly cite the name of a single person (“right wing” or otherwise) who denies the existence of climate? For that matter can you even show me any evidence that any author (even just one) has posted an article on WUWT denying that climate changes?
Of course what you mean is that right thinkers deny that there is a climate emergency and you don’t like that because you can’t actually provide any evidence of said climate emergency, much less link it to the use of fossil fuels.
“Why is it better to stop my fall? Wouldn’t it be better to be down at base camp where the air is warm than way up here on the mountain where the air is thin and cold? I’ll just keep plummeting, thank you very much.”
Talk about a non-sequitur.
• “The Yale economist William Nordhaus first articulated the notion of a “guardrail” of about 2 deg C warming in the 70’s, work for which he would later be awarded the Nobel Prize in Economics. But it is Hans Joachim Schellnhuber, a physicist turned climate scientist, who is known as “the father of the 2 degrees limit” for his unceasing promotion of that idea, especially across Europe. Some dozen years before 1.5 deg C became fashionable, I had a chat with Schellnhuber during which I asked him, “Why 2 deg C and not 1.5 or 2.5 or whatever?” His response was something like “2 deg C is about right, and it’s an easy number for politicians to remember”. Evidently politicians’ memories have improved during the last decade”.
Excerpt from Unsettled by Steven Koonin. There is NO science behind the 1.5.
I think I’ll be repeating this until I am blue in the face: 1.5 degrees is a target, it is not a physical limit of the climate system. A target should be something we can feasibly achieve, with a measurable impact for reaching. We could choose 1.4, 1.5, 1.6, 1.7, 1.8, 1.9, 2.0, 2.1, etc etc etc for our target, and each one has its own feasibility and tradeoffs. The point is that you have to set a target and then try to measure your progress toward reaching it.
Somewhere in the narrative, WUWT and other denialist media outlets decided to start lying and saying that scientists think 1.5 degrees is some kind of physical limit in the climate system. Why they are choosing to tell and propagate this lie is anyone’s guess.
Why not 3C as a a target? It would help feed the starving masses! It would further green the earth!
The reason is because the climate models predict a “tipping point” beyond which climate disaster is guaranteed. And that tipping point has nothing to do with the physics or thermodynamics of the earth. As Freeman Dyson rightly criticized the climate models they are *NOT* holistic at all. They do *NOT* consider the pluses of increased temperature, only the negatives.
It’s not 3 degrees because 3 degrees doesn’t prevent any of the bad stuff we want to prevent from happening from happening. So it’s not a good target. A good target will prevent the bad stuff, or a lot of it, from happening. Does this help make it clearer for you?
WHAT bad stuff? Be specific?
You have not offered one thing we need to prevent. Saying we need to prevent temp from going up because temp going up is bad is nothing more than a circular argument with no justification.
Do we need to prevent increasing temps from causing mass starvation?
Species extinction?
More droughts?
More flooding?
What exactly do we need to prevent?
It really is amazing how quickly the lies from the alarmists change.
It was only a few months ago that the activists were telling people that millions would die if the 1.5C mark was exceeded.
Now that the world is getting ready to pass that point, and nothing bad is happening, they quickly change their tune,
How many times have they pulled this switch? I’ve lost count.
Some good stuff is happening- it’s not quite as dam cold here in Wokeachusetts. That’s a wonderful thing. No drought- no floods- no forest fires.
Goal posts moved as needed. Not a single predicted climate catastrophe predicted has occurred or appears about to. Never an admission or forthright explanation when they’re dead wrong. They just move goal posts and act like it never happened.
All the “evidence” needed to come to a conclusion that their “science” is fatally flawed. And that their motivation is not seeking truth. And thus to assign other motives for their actions.
Going from reliable fossil fuels to unreliable renewable energy is not “reengineering the global economy”.
Are you really that desperate to change the subject?
“The 1.5 degree limit is a target, “
No, it is a random number pulled out of some clown’s nether region…
… with absolutely no meaning other than political.
Any “claims” based on it as also totally meaningless.
4… Climate models and their associated alarmism are responsible for idiotic things like CO2 hatred, fossil-fuel hatred, Net-zero, etc etc….
They are being used to destroy western society.
That is the whole aim, as stated by your high priests and priestesses.
You’re just not paying attention. The only reason to believe in the mythical climate crisis is speculative, unproven computer models. You need to listen to the rhetoric of the climatistas — climate justice, end capitalism, etc., etc.
To what? FOX News? I’m paying attention to the scientific literature.
“The 1.5 degree limit is a target, it isn’t a physical climate tipping point.”
So… 1.5 isn’t a target for anything?
Then why spend trillions to do … what??
Like Mikey Manns hockey stick.
I’m afraid that “measurements ” adjust to politics. The issue of warmer oceans in the northern hemisphere is related to the distance of the Earth from to the Sun in orbit, when the Earth approaches the Sun in early January and receives a higher dose of radiation than the southern hemisphere.

Warmer oceans affect winter in the northern hemisphere because the amount of water and snowfall increases as the jet stream descends from the north. Thus, the course of winter depends on the strength and current pattern of the polar vortex in the lower stratosphere. The polar vortex in the north will always be weaker than in the south due to the inhomogeneous geomagnetic field in the north.
Actually, the polar vortex difference between north and south is more likley dominated by land mass in north and nothing but ocean in south. The southern vortex is often/usually an unbroken donut. The hole sucks the stratospheric cold right down to surface for extended periods.
The interaction of the Polar Vortex and the magnetic fields is interesting.
The Northern Hemisphere has two magnetic poles and the Southern Hemisphere has one.
North Pole Projections
http://www.geomag.bgs.ac.uk/data_service/models_compass/polarnorth.html
That looks like a good link. All you want to know about the Northern Hemisphere magnetic fields. Thanks. I’ll look it over.
Huh?
Nice.
The problem is that humans have no impact on the global climate, unless they start nuclear testing in the stratosphere. It is stratospheric oxygen and the ozone layer that are the most important gases for climate regulation. First of all, they cool the surface by trapping high-energy UV radiation, which kills marine algae. Ozone influences the winter circulation by increasing the temperature difference at high degrees of latitude.
Come to think of it, the amount of CO2 in the atmosphere is negligible even compared to argon. It is different with water vapor, the amount of which in the tropics over the oceans reaches 3% and gradually decreases towards the poles.
Mind blowing (at the Guardian)
“”Peer who praised rising temperatures appointed to climate crisis committee
Labour says appointment of David Frost shows ‘wacky’ climate views no longer confined to Tory party fringes””
https://www.theguardian.com/uk-news/2024/jan/22/david-frost-peer-who-praised-rising-temperatures-appointed-to-climate-crisis-committee
Following a link to the Guardian is never pleasant, but an Interesting appointment. The question now will be, will he go native?
Once they threaten him, in private, of some nefarious deeds with children that never happened, yes he will.
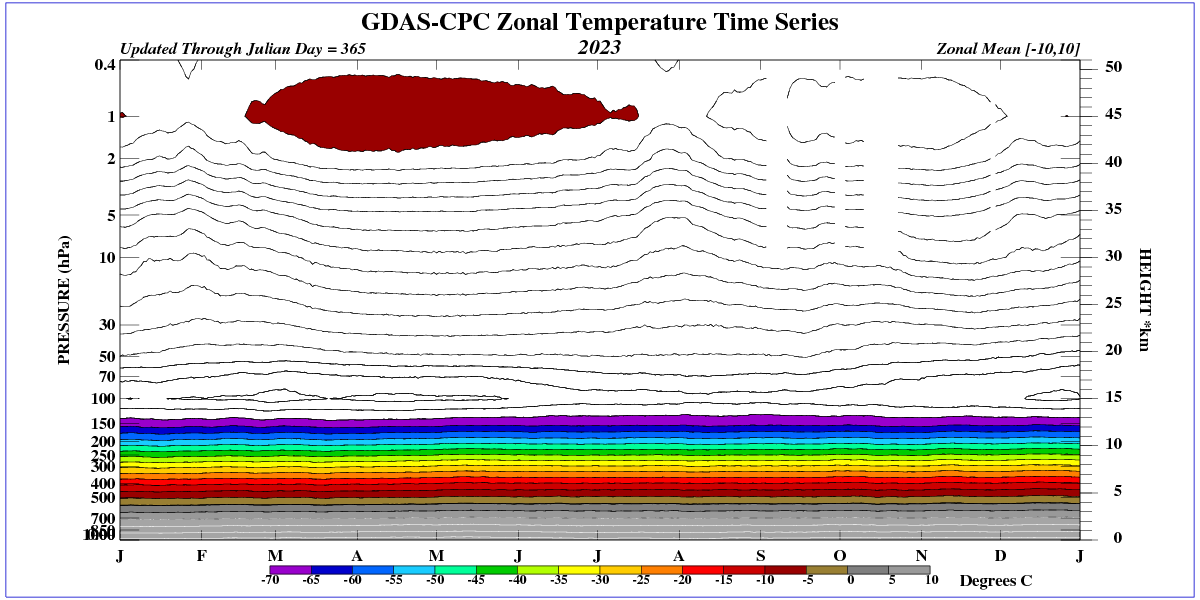
I love the image at the top- a Van Gogh planet!
“… October 2023 probably exceeded the 1.5C threshold…”
And almost certainly, more people were pleased than displeased by it.
I certainly enjoyed eating my backyard December tomatoes along with the December tuna we caught this year. I also enjoyed not paying for heating my house until mid December. But I’m old enough to remember that that’s what happens during certain West Coast El Nino years. El Nino’s are entirely natural occurrences, so I never worry about any climate crisis when they happen.
AlanJ was presumably in the ‘displeased’ camp.
Just an illustration of the lack of knowledge even from “professionals” – a post on social media from a real meteorologist, on a day when it was something like 40 F in Denver but only 20 F in Little Rock – she commented how weird it was this day, that it was TWICE as warm in Denver as in Little Rock!
It’s not weird at all for Colorado to be warm while Arkansas is cold.
Cold arctic air covered Arkansas while Colorado was on the western edge of the arctic air and so did not get the impact that Arkansas got.
When the jet stream forms in a certain pattern, it can cause the Eastern U.S. to be unusually cold and the Western U.S. to be unusually warm, at the same time.
It all depends on the jet stream configuration and your particular location along it. If you are lucky, you are on the warm side, and if not, you are on the cold side. And the two sides can be fairly close to each other.
My point was, she believes 40F is twice as warm as 20F…or 90F is three times warmer than 30F, or 10F is 1/3 the warmth of 30F, or…hell, there’s no way for me to know what crazy things a supposed scientifically educated person like her believes…
I lived in Colorado in the last century, pre-crazy era, and loved the weather variabilty there, all my time at 7000 feet or higher. Spent most of a year above 10,000 feet and loved it.
That distance can be as little as 100 miles. And yet climate science thinks its ok to “homogenize” data from stations as far apart as 400 miles and sometimes more!
Any warming trend from land based thermometers post 1980 needs to be taken with a large pinch of salt. As the data has been utterly corrupted by the switch over of recording temps with glass thermometers to electonic thermometers.
The land based air temps warming trend post 1980 has been largely manufactured due to the use of rather suspect data.
Any fear of a link to support this claim?
Normal distribution otherwise known as Gaussian distribution is not understood by you, obviously. Since you are incapable of googling an answer for yourself, supplying a link for you that you wont read or understand is a meaningless effort.
So, no link. Just arm waving.
It mainly gets down to how climate models handle water vapor. Based on multiple studies, they even get the sign wrong. All of these studies are based on different sets of empirical data.
“We find that as rainfall increases that there is not a reduction of global net radiation to space as most of the climate models have assumed. There is a weak enhancement of radiation to space with increased rainfall. We find no positive water vapor feedback.” – Gray/Schwartz 2010
https://tropical.atmos.colostate.edu/Includes/Documents/Publications/gray2010_ams.pdf
“. The sign of the H2Ocorrelation coefficient (blue number) is a clear indication of the climate stabilizing role of the water vapor. The increase of the atmospheric carbon dioxide is apparently coupled with the decrease of the atmospheric water vapor column amount.” – Miskolczi 2023
https://scienceofclimatechange.org/wp-content/uploads/Miskolczi-2023-Greenhouse-Gas-Theory.pdf
“this analysis failed to find that the steadily rising Atmospheric CO2 Concentrations have had a statistically significant impact on any of the 13 critically important temperature time series analyzed.” – Christy et al 2016
https://thsresearch.files.wordpress.com/2016/09/wwww-ths-rr-091716.pdf
You don’t really expect the CAGW advocates like AlanJ to read any of these, do you?
Are you not a bit embarrassed to use those links?
First you ask for links then claim supplied links are embarrassing? You must blush everytime you walk into a library.
I asked you for links (which you didn’t supply).
I was just commentating on the nonsense links posted above. If that’s what RichardM relies on as authoritative sources it explains a lot.
Can *any* of the CAGW advocates on here actually make logical, rational arguments instead of just offering up argumentative fallacies?
You just used the argumentative fallacy known as Argument by Dismissal. Dismissing the assertion without providing any actual logical, rational argument for the dismissal. Just magical hand waving.
Tell us all WHY the links are nonsense.
The ‘forecast’ period of the CMIP3 model ensemble begins in Jan 2000; so it’s been forecasting for 24 full years as of Dec 2023.
Over that period, annual observations are running slightly warmer than the multi-model mean (MMM – the average of all the model runs in the ensemble). Since 2000, the forecast trend in the CMIP3 MMM is +0.21C per decade; the average of the three main global surface observation sets (GISS, HadCRUT and NOAA) is +0.23C per decade over the same period.
The chart below shows annual CMIP3 MMM versus GISS from 1970 to 2023. The period pre-2000 is ‘hind-cast’. The anomalies are based on the most recent full 3-decades (1991-2020).
That’s not precise enough.
Unless a prediction is at least thousandths of a degree C over 10 years, not just hundredths of a degree C, it lacks credibility.
(In my opinion, which is all anyone else has too.)
Not sure what you mean. The models are warming slower than the observations in the CMIP3 multi-model mean over their forecast period.
The only valid criticism of these models is that they slightly understate observed warming trends.
LOL, GISS again
A temperature fabrication specifically mal-adjusted to match the models.,.
… also massively tainted by urban warming, cold site loss, airport exhausts, rapid acting thermometers… etc etc etc
One FANTASY, graphed against another.
GISS is +0.24C warming since 2000; NOAA and HadCRUT are both +0.23C warming since 2000.
The multi-model mean for CMIP3 forecast +0.21C for the period.
Observations are warming close to, but slightly faster than, the CMIP3 ensemble average forecast.
By the way, the warming trend since 2000 in all the global temperature data sets, surface or satellite (including UAH), round to +0.2C per decade.
The reason for the post is to highlight that two squiggly lines are unrepresentative of anything to do with the global climate. You have been duped into thinking that an anomaly to a global average temperature conveys information. And continue to post such nonsense.
The climate models just project a warming trend. As shown in the post, a straight line to an anomalous average can achieve a 71% fit. But the models are incapable of showing a cooling trend ANYWHERE. Hence they do not reflect anything to do with reality and it is not CO2 causing the “warming”. The regional temperature difference between two CMIP6 models ranges over 34.8 centigrade degrees.
The models are way out over Greenland. It is far warmer on average than they predict but still well below freezing most of the time because the greatest warming is occurring in winter. At the other end of the globe, the Southern Ocean is cooler than the models predicted. So, thermodynamically, what is more relevant to global energy balance – Greenland warming or Southern Ocean cooling?
The October LST difference in Image 2 shows Siberia, Northern Canada and Alaska are up to 14C warmer in Oct 2023 than in October 1982. These regions all experienced record snowfall in late October through November. That sort of hints at what the future of the Northern Hemisphere will look like as the NH oceans warm up.
They’re just visual presentations of data. Like all charts are.
Better tell Roy spencer that then (whose UAH monthly anomaly data are displayed prominently on this site and are updated here in monthly posts).
Not as fast a one as observations in the case of CMIP3, though. See above.
They’re just visual presentations of data. Like all charts are.
Data it is but information it is not.
That is why I used RSS. It is available at KNMI as a grid value rather than just a grid anomaly.
If you were to put your head in the oven and your feet in the freezer your average temperature could very well be close to the room temperature but it would not be very comfortable.
That is why I chose CMIP6 models. If you look at actual values rather than anomalies for the CMIP3 rubbish you would know that the CMIP3 models started cold and are still cold – per attached for CMIP3 land to GHCN.
Given that the peak solar intensity is moving northward and there is more land in the Nh than the SH it is not a challenge to predict the GAST will increase. GAST has been trending up for about 200 years.
I wonder how you obtain your information, if not from data?
Oh, you do use data! You will be aware then that RSS is warming considerably faster than UAH (more squiggly lines, I’m afraid – see attached).
The CMIP6 model forecast period has only been running since 2016. Given that the model runs use a variety of natural forcing conditions, you would expect that the MMM would be more variable at this early stage (as CMIP3’s were during their early forecast period).
When the models that most closely resemble the conditions that actually occurred since 2016 are selected, their average is close to observations.
“Given that the model runs use a variety of natural forcing conditions”
In other words, the data matching algorithms haven’t yet been parameterized properly (i.e. fudged).
“When the models that most closely resemble the conditions that actually occurred since 2016 are selected, their average is close to observations.”
Fudged data matching algorithms matching fudged temperature data. What a coincidence!
This comment betrays a familiar (for this site) lack of knowledge about what a climate model ensemble is.
Contrary to the meme here at WUWT, climate modellers acknowledge that there is a wide range of natural influences on climate.
ENSO and solar activity, for example. No one knows in advance when these will occur within the forecast period, or how intense they are likely to be.
Each model producer therefore uses a range of ‘runs’ with different start dates and intensities for these natural events, but with the underlying man-made forcing incorporated in each.
No model is expected to replicate observations exactly. What is expected, if the models are skilful, is that their average will be within the range of observations and that, given sufficient time, observations and the multi-model average will grow more and more similar.
That is exactly what we see with the CMIP3 range of models.
“This comment betrays a familiar (for this site) lack of knowledge about what a climate model ensemble is.”
I *know* what they are. They are a large group of differential equations supposedly describing the biosphere of earth.
The fact that parameterization factors have to be used to keep the CGM’s from blowing up is quite telling. Just having to use an “average cloud cover” factor is telling enough. The fact that the climate models don’t accurately produce short term forecasts and have to be defended by saying the long term outputs are correct because all boundary problems and initial condition uncertainty “cancels” out is just more evidence that they do *NOT* “given sufficient time, observations and the multi-model average will grow more and more similar.”
What these things are is nothing more than data matching algorithms. Pat Frank has shown that by developing a linear equation that gives exactly the same output as all of the “climate models”. All the models basically do is extend a linear regression line into the future. It doesn’t matter how complex they are, it’s their output that is the determining factor.
The charts displays anomalies to a meaningless number. That means they are displaying something less than a meaningless number. When you look at the actual average temperature, the CMIP6 also start cold. If you take their output as the reference, the 1.5C tipping point is long gone already.
Put your head inside an oven and feet in a freezer and your average temperature will be close to room temperature. But you will be very uncomfortable.
Climate botheriees love anomalies because it hides the complete lack of skill and their incompetence. Climate botherers use anomalies to a meaningless number to avoid the difficult questions. The developing countries are wasting vast resources on the basis of these meaningless numbers and few are asking sensible questions.
Today I heard two different authorities blaming climate change for their ineptitude. It is the gift that keeps giving for incompetence.
Attachment for above comment.
You mean the chart showing the RSS data, which you say you prefer to use?
Why do you think they developed the par system in golf? It’s because it’s easier to say you were one or two above or below par for a round, rather than giving it in exact numbers.
It’s easier for people to understand. That’s all. It doesn’t change the trend. There is no conspiracy to fool people.
A “counting” distribution is *NOT* the same thing as a supposedly continuous temperature distribution. Counting anomalies are exact. The temperature distribution is made up of measurements with uncertainty.
To compare the two would require your count of strokes to be given as “5 strokes +/- 1”!
You can’t even get this simple comparison correct. And we are supposed to take you as an “expert” on anything to do with statistics?
Again, presenting a single number as a “global” anything is utterly bogus.
I’m not sure RSS is a good data set to use. The manager of this system changed his algorithm recently to show more warming recent years, much like the surface temperature guys. You can see the results of the change here:
MSU RSS
Yes, like Galileo, RSS was ‘shown the instruments of torture’ and knuckled under.
Funny how the “adjustments” always cool the past and warm the present…
Here’s Heller’s take:
https://realclimatescience.com/2023/09/rapidly-changing-climate/#gsc.tab=0
It was ideal for making five points:
A. Reducing a data set to a squiggly line by producing the amorally means a straight line can achieve a good fit with high correlation.
B. The actual data shows sustained regional cooling trends. That means CO2 is not the reason for any observed regional warming and why climate models fail.
C. RSS probably already breached the dreaded 1.5C warming in October 2023. Apart from UN heads exploding, did the globe tip?
D. The reagonal differences were almost equally split between warming and cooling from minus 7.1 to plus 7.4.
E. This data set excludes both polar regions but still is considered representative of the globe.
Only climate botherers get concerned over hundredths of degrees. The GAST is a meaningless number no matter what data set it comes from. An anomaly to a meaningless number is still meaningless.
No single line on a chart is going to convey anything meaningful about the global climate. It is a tad more complex than that.
If you can show that they changed it just to “show more warming”, then you are one-up on everyone else; because they published their methods and results in a peer-reviewed journal and these are accepted by the American Meteorological Society.
You fail to mention that UAH also changed their algorithm in recent years and that this resulted in a cooling of their trend.
Is it change you are against or just change you don’t like the look of?
No, of course climate models do not offer a firm basis for attempting to reengineer the global economy. That’s why the climate agitators stifle debate. The models are, at best, unproven. A better description is speculative.
The debate has nothing to do with the climate. The proponents know they are smarter than everyone else, they know they have better ways to do things and they know they don’t have to prove any of it, or show more than cursory evidence. They know fossil fuels are killing the earth, and if they aren’t, well, aren’t solar panes, wind farms and EVs just so cool?
Linear regression does NOT tell you this, it is NOT reasonable.
True. But I also know that the peak solar intensity has been moving northward for a few hundred years and the sun drives the surface temperature. The northward progression is only 500 years into a 9,500 year warming trend that will increase the summer solstice solar intensity in the mid latitudes by 21w?m^2 from the present level. So it will get a lot warmer before the ice accumulation keeps it cooler. The amount of northern ocean surface reaching the 30C limit is increasing at 2.5% per decade.
And not a single one of these ephemeris observations can be gleaned from making straight lines of bogus air temperature data,
I am quite confident the boguslarity of the trends will be at least maintained.
I am certain the warming trend in the NH is locked in for a long time and it will be faster than the SH cools..
You have to feel sorry for the Australian BoM because they are battling the forces of nature to maintain a warming trend and are running out of bogus options.
No doubts here, the dogs refuse to let go of their bone.
Ric,
You make a number of valid points.
For those interested in how land surface temperatures suffer from quality and uncertainty constraints, here are some graphs of the actual distributions of some daily temperatures from 8 of Australia’s main cities.
There is no valid way for people to use SQRTn type math when the standard deviations derived from these distributions are a measure of uncertainty. It follows that data from these 8 stations cannot validly be combined into a single annual anomaly figure, let alone the many observations going into GISS, HADCRUT, BEST and so on. The correspondence of the annual derived values from one curator to another is not a sign of confidence in the results as in “Look, we all get the same answers”. Rather, it is proof of the use of wrong assumptions behind the numbers.
It is not surprising to find the results of modelled golbal sets varying by 13 deg C or going to large negative differences in some regions. But, it is valuable to see it in pictorial map form, as you have done. Geoff S
Geoff
My view is that the climate prognosticators are so removed from reality that arguing detail is a waste of time. If they were using darts to make predictions, they would by throwing in the wrong direction. They do not even get the trend right in some regions. The difference between models is a Grand Canyon type chasm not small details.
There is no science in climate modelling other than political ‘science”.
The fact that none of the Tav histograms are even remotely Gaussian makes the use of the CLT and LLN to find the precision of the average useless. A standard deviation that is 20% to 30% of the average tells you the uncertainty of the average is low. And all you need to look at is that the median and the average are not the same in order to know the distributions are not Gaussian.
Yet climate science assumes that *everything* is random, Gaussian, and cancels. That’s why they use the SEM as their measurement uncertainty metric. It’s a joke from the word go and never gets any better as they do averages of averages of averages.