Ivor Williams
Part One: Flying Falsehoods
‘Falsehood flies, and the Truth comes limping after it; so that when Men come to be undeceived, it is too late.’ That was Jonathan Swift in 1710. You do wonder whether he might be referring to the more lurid descriptions of the Great Storm of 1703, which is still the by far the worst weather ever to have hit this country since written records were made. However, back to the twenty-first century.
Take, for instance, the claim quoted by Reuters: ‘This year is “virtually certain” to be the warmest in 125,000 years, European scientists said on Wednesday’ (8 November). We have recorded temperatures only for the last 150 years, but this irresponsible and totally fallacious comment then set off around the world, picked up by CNN the following day, featured on dozens of sites over the next week or two, and even turning up on the South China Morning Post in January..
Another version was ‘The world hasn’t been this warm for 100,000 years.’ Here is an announcement that had been decided back in July with the year still only six months old. The ‘expert’ in this instance did admit that ‘records are based on data that only goes back to the mid-20th century … [but] they are “almost certainly” the warmest the planet has seen … for at least 100,000 years,’ according to Jennifer Francis, a senior scientist at Woodwell Climate Research Center.
That’s how the damage was done. Perhaps even worse was the comment from that august and well-respected scientific journal Nature. ‘Earth boiled in 2023,’ they proclaimed, 2023 was ‘officially the hottest on record.’ Note the use of that word ‘hottest’ rather than ‘warmest’ whenever an editor wants to ramp up the panic, and you might wonder about that ‘boiled’ when you read the next paragraph.
Part Two: The Value of Numbers
‘When you can measure what you are speaking about, and express it in numbers, you know something about it.’ That was Lord Kelvin in 1883 so let us take his advice and look at some numbers. Our own Met Office said: ‘The global average temperature for 2023 was 0.17 deg C warmer than the value for 2016, the previous warmest year on record.’ Less than one fifth of a degree warmer in eight years? Maybe dial down the panic somewhat.
There’s more: it was also 1.46 deg C above the pre-industrial period 1850-1900. Global annual temperatures are now always anomalies: higher than, lower than etc, never real values. The quoted global annual average by the World Meteorological Organisation for the period 1961-1990 is actually 14.0°C, but this does not sound anything like alarming enough so they use anomalies. It is possible (though not easy) to discover that the agreed ‘pre-industrial’ 1850-1900 average temperature is 0.31°C below that 1961-90 figure, which makes it 13.7°C.
The Met Office is not the only organisation to feature two places of decimals; this implied precision to hundredths of a degree takes us far into fairyland. How can they possibly measure the average temperature over the entire world over both land and sea for a whole year, and come up with those ludicrous second decimal points? Satellites perhaps? No – NASA explains that they do not give sufficiently reliable data.
There surely cannot possibly be any kind of meaningful global average annual temperatures for that 1850-1900 period. Even in 2024 we still have a thin coverage of reporting stations away from Europe and North America, and a very random coverage of the oceans. There were certainly very much larger gaps in the nineteenth century.
However, let us believe the data and see what it tells us. One message is contained in the sequence 2019-2023. All are anomalies, i.e. global averages compared with the 1850-1900 figure, and all are from the Hadley Centre for Climate Science and Services by way of the official Met Office websites.
2019 MO19 1.05 ± 0.01°C above. (Later changed – see text below)
2020 MO20 1.28 ± 0.08°C.
2021 MO21 1.11 ± 0.13°C.
2022 MO22 1.16 ± 0.08°C.
2023 MO23 1.46 ± 0.01°C.
This is global warming? Using the official data: in five years the earth has warmed by two-fifths of a degree Celsius above that notional pre-industrial age.Do the maths: 1.46 – 1.05 = 0.41.
There’s more. The Hadley Centre switched from HadCRUT4 to 5 in 2020, and the value for 2019 was mysteriously changed from 1.05 to 1.25 (MO20). Using that figure as the starting point for the five-year run the maths looks even more strange:
Year 2023 @ 1.46 minus year 2019 @ 1.25 = 0.21°C. Now down to one fifth of a degree.
You might be suspicious of the unbelievably precise tolerances attached to what are doubtful values in the first place. But there is already a bold forecast for 2024 (MO24). The global annual average temperature will be ‘between 1.34 °C and 1.58 °C (with a central estimate of 1.46 °C) above the average for the pre-industrial period (1850-1900).’ Now there’s a message which has not gone limping after any falsehoods, because no-one has thought it exciting enough to bother. The result does not fit in with headlines using words like panic, boiling, runaway, doom and so on, because this year is forecast to be the same as last year. No story there, say the editors and bloggers. That bit of news has not gone beyond the Met Office’s own website.
Global warming? If 2024’s global annual average temperature anomaly from 1850-1900 levels is to be the same as 2023, then the total rise over six years (2019-2024) is forecast to be one fifth of one degree Celsius.Do the maths again – it’s not complicated: 1.46 – 1.25 = 0.21°C. That’s a global warming rate of 0.03°C/year. Far too small surely?
The January 2020 announcement from the Met Office (MO20) gave the revised HadCRUT5 annual temperature anomalies (compared to that 1850-1900 figure) from 2010 to 2020. In those ten years the somewhat less than frightening rise was from 1.00 in 2010 to 1.28 in 2020. A quarter of a degree in 11 years? Still too small?
Remember that these anomalies all refer back to the same constant: the global average temperature over the years 1850-1900 which has been agreed at 13.7°C. Now look at the years 2010-2024, but converted to real-world temperatures.
Year anomaly °C actual °C (13.7 added)
2010 1.0 14.7
2011 0.89 14.6
2012 0.93 14.6
2013 0.98 14.7
2014 1.03 14.7
2015 1.18 14.9
2016 1.29 15.0
2017 1.20 14.9
2018 1.12 14.8
2019 1.25 15.0
2020 1.28 15.0
2021 1.11 14.8
2022 1.16 14.9
2023 1.46 15.2
2024 1.46 15.2
Over fifteen years the officially declared annual average global temperature rise is therefore 0.5°C.
Over fifteen years the rate of increase is therefore 0.03°C/year.
Here’s Nature again with the conclusion to their ‘boiling’ comment: ‘Climate researchers look ahead with trepidation.’ If my research and maths are right then they must be getting worried about their forecasts.
I love the unexplained change of 1.05 ± 0.01°C to 1.25 for 2019. Maybe caused by COVID? It tells me a lot about error bars in postmodern science.
COVID in 2020 caused human emissions of CO2 to drop by 6 percent but CO2 kept rising at the same rate, at least to the eye.
https://www.co2.earth/monthly-co2
The ppm change measured by Mauna Loa was to small to notice, it was lost “in the error bars”
It’ll be great for the plants and plankton when CO2 reaches 1000ppm in the atmosphere – the plants are starving!!!
The sea level used to be two meters higher than the present level. Almost certainly coinciding with the HCO.
I suspect an El Nino year during that period was much hotter than 2023!
A La Niña year was likely also warmer than our Niños.
I figure it is similar to claiming to know the world population, you have a rough idea but not exact.
That’s how propaganda works. Drop the lie with MSM then justify it later in small print (if at all).
“In the 12 years from 2011 to 2023, the claimed average temperature increased an average of +0.05 degrees C, a year”
What’s wrong with you?
You only show 13 years data Where did you get 15 years? And you show 2024 as if the year is over. At the same absolute temperature as 2023 which seems high unless the El Nino lasts a long time.
Over 13 years from 2010 to 2023 that was +-0.038.
Not 0.03
Cherry pick different years and you get a different average
What’s the point?
Maybe you should slow down and read for meaning?
“But there is already a bold forecast for 2024 (MO24). The global annual average temperature will be ‘between 1.34 °C and 1.58 °C (with a central estimate of 1.46 °C) above the average for the pre-industrial period (1850-1900).’”
The author didn’t just “get” the 2024 value, he’s using what “climate science” is forecasting.
Don’t confuse Richard with truth and facts. 😀
Hairy Krishna throws in a zinger. You have a future in stand up comedy.
Unfortunately Richard, you don’t. No one thinks your funny. At least Griff was funny.
Dickie-boy thinks he himself is funny…
… that’s all that “really” counts… to him.
And yes, facts are very confusing to dickie-boy.
That sounds too close to an ethnic slur, and ‘ ad hominin’ attacks are for young school children to young to know better.
“he’s using what “climate science” is forecasting.”
And we all know how good “climate science” forecasts are !
97% fail rate, at best, isn’t it. 😉
100% fail rate
Predictions always too hot
CAGW predictions wrong since the 1979 Charney Report but the scary predictions will never stop.
Climate change is just predictions
No data
No science
Just scientists paid by governments to tell scary climate stories, whic ICALL CLIMATE ASTROLOGY>.
And the bizarre claims that warming is bad news and more CO2 is bad news when both are actually good news.
“at best”… I was sure I typed “at least“..
I feel your pain!! But rejoice the edit function is back!!!
The author tosses in one wild guess for 2024 made by people biased to overpredict warming, just three weeks into the year..]
He has 13 years of actual, but questionable, surface statistics and then divides by 15.
Sloppy science
Data mining
Ignores more reliable UAH statistics
What is the point?
There’s nothing in the global average temperature as of 2023 to worry about?
That’s true
Everyone with sense knows that.
Climate scaremongering is NOT based on historical temperature trends
It never was
The propaganda is based on the increase in CO2 of +27% since 1975 and the simultaneous global warming.
I know some science deniers here want to claim the CO2 did not cause any of the warming. It does not matter what you think:
Governments will say it did. Then they predict rapid dangerous global warming from more CO2 in the future, much faster warming than in the past. Which they have been predicting since 1979.
The amount of global warming since 1975 is not very important to climate scaremongers. They just need a warming trend as a foundation for their scary future global warming predictions
The goal of leftists is to divert attention away from their 44 years of failed climate predictions. They are succeeding.
They love it when we argue about global average temperature accuracy. Or do mathematical mass-turbation, like this article.
We are wasting time dissecting what they call temperature data while they are making climate predictions with no data.
Climate Howlers spent 44 years predicting CAGW, which is an imaginary climate, while we are still arguing about AGW (is AGW real, does CO2 really cause global warming, and are the temperature statistics accurate).
“I know some science deniers here want to claim the CO2 did not cause any of the warming.”
STILL WAITING for your real science that shows that it does.
You so far have a 130% failure rate.
You have a -130 IQ
Another pathetic idiotic nothing from dickie-greenie.
STILL WAITING for your real science that shows that it does.
Your failure rate now 140%.
And your clown status remains on “why-do-you-bother”. 🙂
“Ignores more reliable UAH statistics”
So we have a problem, who is the more reliable, UAH, or Met Office?
Has anyone seen a proper statistician’s analysis of what we can really expect from the world’s array of weather stations – with stations so far apart and with the limits of the equipment, is a worldwide average to the 2nd decimal place really realistic?
I’m only competent in a lab setting; at a stretch, maybe with something the size of a reactor – if I dug out my old text books and reviewed the issue. But in doing a thermodynamic and thermal hydraulic analysis of a planet 40,000 km around the equator and around the poles, with a few thousand stations – there’s a lot of weather that can happen inbetween the stations!
Enquirying minds need to know… Google says there’s about 8000+ stations and 4000+ Argoes for about 510 million square kilometers – each thermometer is responsible for over 42,000 km^2! – a 200x200km area, like 1 thermometer for every 200km, and most of them close to populated areas and certainly not evenly distributed.
Can we trust an average of all that to even full degrees of resolution??
Yea!!! The “Edit” function is back!
“Can we trust an average of all that to even full degrees of resolution??”
No, you can’t! A good “average” measurement uncertainty for each station is about +/- 0.5C. Since these all provide single measurements of different things using different devices under different conditions, simple metrology rules tell you to add the measurement uncertainties in quadrature.
That is: sqrt[ u(x1)^2 + u(x2)^2 + …. + u(xn)^2 ] ==> sqrt[ (n) u(x)^2 ] ==>
u(x) sqrt(n)
For 12,000 stations that becomes 0.5 * sqrt(12000) == +/- 55C!
What climate science does is find the average uncertainty and divide that by the sqrt(n) = a kind of standard deviation of the sample means type calculation. So you wind up with an uncertainty of 0.5/sqrt(12000) = +/- .005C
They stubbornly believe that this is the measurement uncertainty of the average value. It isn’t. It’s the precision with which the average value is calculated. It’s how precisely you have located the population average value, not the measurement uncertainty of the population average value.
Consider, if every single measurement is off by 1.0C then the average value will be off by at least 1.0C, but if the sample means are all the same as the population mean the standard deviation of the sample means becomes 0 (zero)! A perfectly precise average value that is 1C wrong! Yet climate science will trumpet that 0 (zero) uncertainty of the mean as the measurement uncertainty of the mean.
Our litigious society has had at least one benefit in medical society. It is beginning to force medical research to evaluate the variance in their sample data to use as the uncertainty of the efficacy of the subject being researched instead of using larger and larger samples to reduce standard error of the mean in order to get a smaller and smaller uncertainty value. No one really cares how many digits you calculate the mean out to, the important measure is the ACCURACY of the mean and that can only be judged from the measurement uncertainty of the individual elements or the variance of the individual elements. As variance goes up the uncertainty of the average goes up as well.
Would that climate science do the same!
Ivor Williams made a valuable contribution.
It took a lot of work to put that together
We should not be attacking each other.
We should dig deep to expose the IPCC frauds
They have the gall to call a co-incident strong El Nino and a major underwater eruption “global boiling”, because they raised the temp of the lower-atmosphere by about 0.3 C by late 2023.
DEEP OCEAN VOLCANOS CAUSE INCREASED GLOBAL WARMING BY PERIODIC EL NINOs
https://www.windtaskforce.org/profiles/blogs/natural-forces-cause-periodic-global-warming
Take a chill pill – don’t lose your cool over apparent reading comprehension issues.
And this article is partly about the ridiculous levels of precision and you cry about the 3rd decimal place.
Sometimes I think you go looking for trouble…
All this “global average” temperature reportage is just numeric constructs based on very imprecisely measured, recorded values whose probity and provenance are screaming out for exposure, as Ivor Williams has admirably done here.
Step back from the whole climate reportage scene and the view from any rational perspective prompts a response of –
“what the fcuk do these clowns think they’re looking at and trying on?”
The folks doing this are not scientists nor do they have any practical experience in making measurements. I would bet that most slimate scientists rely on statisticians who “know” about numbers. They were trained that every number in a data set is exact and that one can calculate means to any number of decimal places to maintain precise numbers. And, if you have one very large sample, the standard deviation of that sample can be divided by the √n showing that the mean is precise to 15 decimal places at least.
When you calculate anomalies, who cares about a standard baseline. The Antarctic can have a +20C anomaly going from -70 to -50 and therefore it gets spread all over the globe.
Does anyone ever wonder about the animations that show different areas warming then cooling while other areas become warmer? Once warmed, why doesn’t an area stay warm? What makes the heat migrate to another location on the earth? CO2 concentration are well mixed so should result in constant heating. Water vapor, same thing. Why would water vapor concentrations drastically move around the globe to cause warming.
Unless warmists can begin to explain why the variations, they are standing on quick sand.
There are storms that move water and water vapor around but CO2 is supposed to be well mixed.
“statisticians who “know” about numbers.”
Mean – Mode = whatever they want
To say that 0.03°C per year is too low to be a concern is to miss an important point. It is not going to go on rising forever.
If we thought it were going to continue forever, 3°C per century could be concerning for our great great grandchildren. But actually there are cycles. The very long-term trend is cooling. The climate optimum of the next interstadial will probably be warmer than today but cooler than the HCO.
3°C per century is a good start – not warranting concern unless how to make sure it keeps going until this damn ice age is over.
“Over fifteen years the rate of increase is therefore 0.03°C/year.”
Which isn’t small at all, unless you have very short range vision. It is 3°C, per century. People will notice that. And then 6°C in 200 years. A different world. The last glaciation was just 6°C cooler.
It isn’t instant boiling, but we have to have some plan for turning it around.
Only a complete mathematical idiot extrapolates out that far beyond what is pretty close to random step data.
You are talking complete GARBAGE, Nick.
Exactly right, Stokes is using the climastrology implicit extrapolation propaganda technique.
Nick is wrong, but you need to point out the real reason. It is that even if the high climate sensitivity estimates are correct, there are not enough fossil fuel reserves to drive a 6C rise in temperature. It is not going to happen. This is the point that needs making, and expressions like ‘climastrology’ fail signally to make it.
The slight warming we have been fortunate enough to have out of the LIA, is nothing to do with fossil fuels.
DO NOT fall for non-science AGW meme mantra.
There is absolutely no evidence of any human caused warming of atmospheric temperatures in the satellite era.
Agreed! I totally agree that a CO2 molecule can absorb and re-emit an IR photon – but CO2 as a major climate player is just conjecture.
What always seems to get missed is that as the temperature goes up so does the radiation, so more heat gets radiated away as the temp goes up, driving the temp back down. This happens during the day as well as at night. Yet that increased radiation of heat toward space never gets considered somehow.
Are you on a crusade to remake WUWT into your own image? Stop whining and go get your own website.
I am pointing out that, as Oscar Wilde said, ‘each man kills the thing he loves’.
That is what you are all doing. Grow up and learn how to be effective. How to argue, how to make a point forcefully. Its different from having a public tantrum.
You…. are being totally ineffective.
You come across as a weak-kneed groveller, too keen to b.nice to people who don’t warrant it..
Well that’s not the complete picture either – since the cooler weather on this planet since after the peak 50 odd million years ago has to do with North America joining the South and blocking the currents.
I don’t like the direct insults against Stokes and Greene – but “climastrology” is just calling it as he sees it, it’s definitely not climate science when they can’t even do a trend line on a temperature graph and predict off that but have to stir the tea leaves in the servers to get more newsworthy numbers.
Nick, natural cycles and effects will produce whatever natural cycles and effects have produced for aeons.
All without self-appointed custodians of the weather.
If the inhabitants of the planet think they need to adapt to changed conditions in 200 years time, I’m sure they will do so.
I’m sure my ancestors in a future southern Ontario will thank us all if they get to walk around in flip-flops almost all year round – save them the cost of escaping to Florida and the Caribbean every year!
OMG. Linear trends go on forever, eh? No cycles in the earth’s climate at all.
Unfreakingbelievable!
Who taught you that doing linear regression was a valid form of forecasting the future? A carnival fortune teller?
He won’t answer.
No, it’s true. My broker told me that the market will go up forever./s
Hope you were listening
OMG, can Nick’s posts get any more into the “TOTALLY IRRELEVANT NONSENSE” category.
No Nick.. not a challenge !!
And no, It is highly likely that Bidenomics will change the direction of that chart very soon.
And WT* has that got to do with “climate” .. seriously !!
When I was nine years old, I measured my height, and from my calculation, I reckoned by the time I was 20 I’d be 8ft tall. 😂
And 30°C per millennia!
We’re all gonna melt!
Run away!
Nick, you are not brave enough. Consider what it will be for a millennium.
We only need a plan for turning it around if its likely. I can see no evidence that it is. Even if you accept the estimate that 6C is going to happen in 200 years on the current level or rate of growth of emissions, the problem is there is no reason to think the current level of emissions is going to continue. It seems to be generally accepted that the IPCC high growth scenarios are unrealistic because there are not enough fossil fuel reserves to support them. They cannot happen.
Then you have to move to the next logical step. Even if you think that high warmth scenarios are likely, and threatening, you have to ask whether the policies that the green lobby advocates are either possible or, more importantly, effective. Never mind what emissions will be, will current proposals significantly lower them?
No. There is zero reason to think that trying to move to wind turbines and solar for power generation, and at the same time taking everyone who will go there to heat pumps and EVs, will make any significant dent in emissions. Even if they were possible, and intermittency and lack of storage technologies makes them impossible.
What we are dealing with here is a vanishingly unlikely prediction, and measures to thwart it which cannot be implemented, and if they could be would still not in fact affect it significantly.
This is the problem. I am sorry that other commenters below are reacting to your comment with childish petulance and insults. The problem is not that they are rude (though they are). The problem is that, like wind turbines, they are totally ineffective. The facts are what matters here, and there is no substitute for simply stating what they are.
Childish insults demean the site and make no contribution to the real argument.
“I can see no evidence that it is [likely].”
Well, it’s happening. The trend may turn down. It may increase. But we need a plan to deal with the likelihood that it has come to stay.
“the likelihood that it has come to stay.”
You are making mindless conjectures again, Nick.
“a plan to deal with….”
And that mean having solid reliable energy supplies.
The very best alternative currently is COAL and GAS , with hydro where it can be implemented.
“Well, it’s happening. “
What is “happening” ??
There has been no human caused atmospheric warming in the last 45 years.
How are you going to stop natural El Ninos from happening. !!
Surface sites are inundated by urban warming… that is them smeared across the whole of the land surface to fabricate nonsense irrelevant temperature series and manically mal-adjusted..
USA did put a break on these things when they installed USCRN… and warming stopped.
That is what needs to be done world-wide if you want to stop “warming”…
.. start measuring it properly and consistently.
Nick,
What is happening, apart from cherry picks?
Here is another.
Best of year 2024 for you, Nick. Geoff S
Geoff,
All the best to you too for 2024
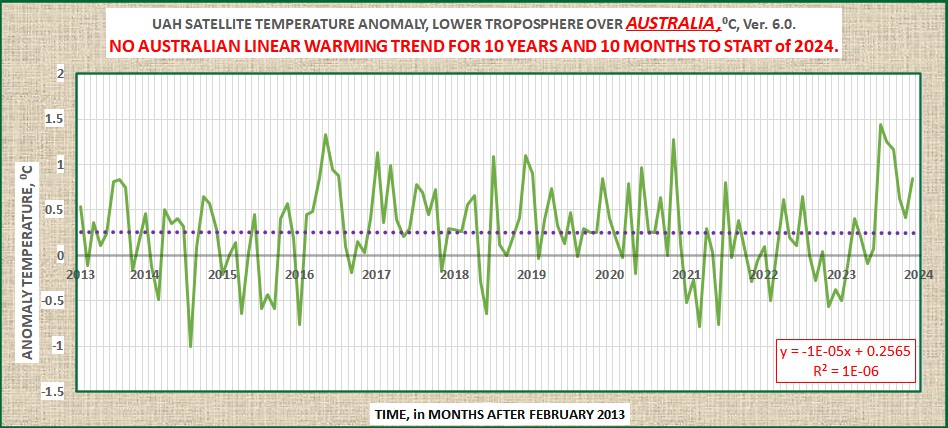
Australia doesn’t extend far into the lower troposphere where UAH is measuring. Down here, it looks like this:
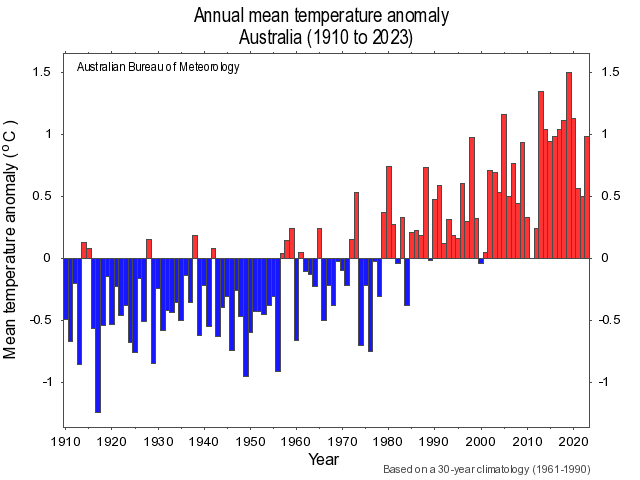
http://www.bom.gov.au/tmp/cc/tmean.aus.0112.4570.png
OK, wordpress won’t show a http:image. Here is is
OMG, have you seen some of the TOTALLY LUDICROUS sites that concoct that fabrication from.
A large proportion are TOTALLY UNFIT FOR PURPOSE, even by BoM’s lacks standards.
Stop being an anti-science suckophant,, Nick
And the fact is that Nicks is totally aware of the parlous state of the BoM network…
…. and he cites it anyway.
That is just downright dishonesty.
That is a great graph of URBAN DEVELOPMENT in Australia, Nick !
It is still too cold to live outdoors with no heat all year, outside of the tropics.
BoM cooling the past. LOL
Nick,
It is a nice personal attribute to be trusting, but how do you know that the numbers behind this graph are unaltered, reasonably altered or horribly altered?
Do you have the original Tmax and Tmin values? If so, please share them
Cheers Geoff S
Hi Geoff,
The BoM posts the original data. I have an interface
here to make it easier to find. But for automated use, I would probably use GHCN V4.
Tmax of Australia just above, Geoff.
Tmax shows it was just as warm in the Early Twentieth Century in Australia as it is today.
Tmax shows CO2 is nothing to be concerned about because even though there is more CO2 in the air today than there was in the past, it is no warmer today than then.
Tmax shows the chart Nick presents is not representative of reality as it shows the Early Twentieth Century to be cooler than today.
And then there is this:
resize=640%2C542
OK, here is the real Tmax:
Bob Tisdale tells me to beware of bastardized Tmax charts.
Looks like bumps up in temperature in 2000, and 2012, followed by declines – why declines if CO2 is always increasing by 2ppm/yr or more, even during the 2020 work at home from your bunker year.
You were read Chicken Little too much at some point in your childhood. The Precautionary Principle is the last resort of people afraid of their shadows.
Let’s see just what the PP could cause.
No more plastics, microplastics may kill us.
No more insecticides, they may kill us.
No more automobiles, they may kill us.
No more weapons, they may kill us.
No more GMO’s, they may kill us.
No more high speed highways, they may kill us.
No more leaving the house, someone may kill us.
No more self-defense, doing so may kill us.
No more tall building, they may kill us.
I could go on, but you get the point!
No more having babies, they eventually die
Unfortunately we would also need a plan to deal with the likelihood that it hasn’t come to stay and will turn down. If it does then renewables are the worst form of energy supply and would fail, causing the deaths of thousands or more. What are the plans in place to deal with a prolonged downturn in temperatures, Nick?
I se no evidence that it has ‘come to stay’. Don’t think you would even come to that conclusion from IPCC reports. Yes, there have been modest amounts of recent warming. But how much of it is natural cycles and how much due to the combination of emissions and feedbacks to those emissions? We do not know, but its certainly not all emission driven.
There is nothing in the science to justify extending current warming in a straight line for a couple of hundred years.
It has been warming since the middle of the Little Ice Age about 200 years ago.
And not warming fast enough, I say. We’re not even back to the middle ages level and certainly not the Roman Empire levels. Wouldn’t it be great to walk around in a loss fitting toga all year round!?
There is no likelihood that it has come to stay. The theory is that warming is due almost entirely to emissions. To assess how likely continued warming at the same rate may be, we have to look at the plausibility of the high growth emissions scenarios, like IPCC RC P8.5.
These are completely implausible because there are not enough fuel reserves to supply that level of growth. Also, that level of growth is not happening.
Its an insurmountable logical problem. To maintain alarm and thus drastic emission reduction measures you have to argue that the recent warming is caused almost entirely by emissions, and then that the supposed driving force, human emissions, will continue at RPC 8.5, which is becoming generally accepted to be impossible.
On the other hand, if its mainly or substantially due to cyclical movements of the climate, the alarm will go, as it becomes both likely that they will revert to the mean, and certain that human reduction of emissions will have little or no effect on them.
Question for you therefore: which RCP do you suppose most realistic, and what figure will you give for climate sensitivity?
There is no point incurring enormous costs now in the futile effort to affect vanishingly unlikely developments 200 years from now.
There is, equally, no reason to project that the world will run out of fossil fuels. You’ve asserted this probably five times in this one article’s comment section. It’s just not logical. The world will never run out of fossil fuels.
This sort of thinking results from not understanding the complementary concepts economic reserves, reserves, and resources — and the reality that technology evolves.
For example, in the last 70yrs, we’ve been told that the world would run out copper at least six times. Yet, here we are, still mining it. We’ve been threatened with peak oil, yet here we are. The truth is that we will never extract the last pound of copper or gallon of petroleum.
I don’t know whether or when the world will run out of fossil fuels. I was making a different point. Assume that CO2 does indeed drive climate as alleged. Are there enough proven reserves to drive emissions at the rate required by the theory?
They would have to meet RCP 8.5 to raise temps on the flat growth trend Nick is expecting. But there is general agreement that there are not enough proven reserves to meet RCP 8.5 levels of emission.
We may not ever totally run out of fossil fuels. More likely is that diminishing returns will set in and as they become harder to exploit and therefore more expensive they will be used less.
The point is, for a 6C rise to happen, RCP 8.5 must happen, and its agreed pretty much universally that its not going to, because of lack of proven reserves.
I may be wrong about the consensus on reserves.
https://judithcurry.com/2019/01/28/reassessing-the-rcps/
The case for the impossibility of RCP 8.5 is made here, among other places, but it does not cite as a reason a lack of proven reserves.
Whatever, either way its not going to happen.
Yes- it might be more accurate to say that rcp 8.5 is not going to happen because it requires a huge jump in coal plant development and coal mining – even the latest records for both, if continued regardless of the leveling off of population growth and other real world factors, we still wouldn’t be up to rcp8.5 levels.
And the world seems to like all the extra CO2 – despite an inflection point or knee around 2000, the Keeling co2 curves are at a fairly constant slope, regardless of what new super coal plants get built in Asia
Though see here:
https://www.washingtonpost.com/weather/2020/01/30/we-may-avoid-very-worst-climate-scenario-next-worst-is-still-pretty-awful/
“The levels of coal use in the high-end warming scenario were always implausible given the world’s coal reserves, argues Hadi Dowlatabadi, a climate and energy expert at the University of British Columbia who has published critiques of the “return to coal” hypothesis.
“The coal resource that underlies the assumptions … doesn’t seem to be there,” Dowlatabadi said.”
And here there are several sources cited suggesting there’s just not enough coal to do RCP 8.5
https://judithcurry.com/2018/11/24/is-rcp8-5-an-impossible-scenario/
Thank you, Michael. This goes back to my point about definitions of reserves and resources. I may have theoretical justification to believe that I have recoverable copper in my south fields and I may have some drilling results that lend support to that. However, I have no need at present to undertake in-fill drilling to quantify the resource because I have plenty of work in my north fields. As the current north deposit gets worked, we add more to reserves by drilling south — but usually at increments of no more than a handful of years of production.
Additionally, what was unrecoverable 20 years ago, may be economically recoverable today. Think of fracking technology, for example, which has opened up decades’ worth of oil and gas reserves.
Unfortunately, most non-mining folks don’t know this, and I doubt anyone from the WaPo would be an exception to that rule.
The USGS has a great deal of information in this regard, including carbon-based fuels.
What’s happening? Did you comprehend what Michel pointed out to you very kindly and patiently?
He said there is no climate crisis, can’t be a climate crisis and the solutions being imposed are pretend solutions.
The only planning needed if, IF the trend has come to stay, is coping with the oh, my, 20-30cm a century sea level rise on the coasts – less than 2 cinder blocks high.
Don’t plan to cancel your winter getaway plans any time soon!
“The facts are what matters”
And the FACT is that Nick’s comment was totally idiotic, and complete garbage.
If you can’t see that… it is you that has the problem.
Why should anyone be polite to AGW cultists that are intent on destroying western civilisation.
If you want to cow-tow and grovel to them… that’s on your head.
kowtow: to show obsequious deference.
cow-tow: to drag or be dragged by an adult female of a bovine animal that has had a calf. 🙂
If a bovine mother is a Cow, what is a bovine virgin called?
A Cow, Bryan. It’s not complicated.
Tell that to Stu
His definition specified that a calf was required
It’s not that simple either. Heifer!
A female bovine is a heifer until they have a calf
Well you live and learn. I was always told that a heifer was a cow that’d had her first calf and had started giving milk but hadn’t had any more calves as yet.
Well, you obviously knew what I meant…. 😉
You don’t have to stoop to their level of stupidity and make us all look bad. Just correct the idiot and pat him on the head. Don’t give the green cultists ammunition to criticize us as unthinking brutes. They already have the pandering Scientists™ on their side to make it look like they have the brains, so we have to point out from basic, easily understandable data how wrong they are.
Shouting matches and name calling don’t help.
You seem to think your numbers are absolutely correct. They are only wildly speculative at best.
That presumes that puny mankind has some effect, which can be put into practice to make the desired correction. Is man really that omnipotent?
Climate alarmists assume too much. It’s all they do.
The author is a fool, having given the Stroker all the ammunition he needs for climate scaremongering
0.03 x 100 = +3 degrees C.
+5 degrees C. in 168 years
That’s faster than the claptrap IPCC predictions of +2.5 to +4.0 degrees C. per CO2 x 2 which would take 168 years at a CO2 rise rate of +2.5 ppm a year.
In a completely failed effort to show the temperature rise per year is small, the idiot author gave us a annual average warming rate number that extrapolates to MORE warming than the top of the IPCC ECS of CO2 wild guess. What a genius.
“the Stroker”
Are you naming yourself now dickie… by your actions !
Only a complete mathematical illiterate extrapolates short-term data the way you have.
Poor dickie-boy… not remotely a genius, except in his own tiny mind.
No, they won’t, Nick.
Few people live for 100 years let alone notice a barely perceptible 0.03°C/year
Hi Nick – everyone is piling on your comment but not for the obvious problem with it: 3°C per century is not a problem! It’s a good start! Especially since the current warming has affected the minimums more than the max’s and equatorial temps hardly at all. No one and nothing at the poles is going to notice 3° or 10°C of increase. Even if the North Pole disappeared in the summer so much the better for the aquatic life there that would get much more sunshine.
The healthiest this planet has been when it was more warmer during the Jurassic and Cretaceous periods, when the planet was 10° warmer and not an ice cap in sight.
That extreme would take a millennium of crossed fingers that the warming would be steady – no chance of that happening, so relax.
Hallelujah!
that
august andwellonce-respectedscientificpolitical journal Nature.There, fixed that part.
Hitler coined the phrase “the big lie”, as something so alarming the masses would believe it. Saul Alinsky, in Rules for Radicals (Barack Obama began his political career in Alinsky’s living room), then said to keep a theme going, to enhance it if it starts to lose traction. Saying scientifically outrages things, like hottest in 100,000 or 125,000 years, is todays version of these deranged ideas. Makes you wonder who the target audience in the masses, is? Idiots? Power seekers? Loonies?
You could have just said “Democrats” Ron, and avoided tautology.
Remember Hitler even burned the Reichstag down so he could blame it on someone….remember the Reichstag!….Remember Jan. 6! The Nazis also faked an attack from Poland in order to justify the invasion of Poland. The target is dumb demrats.
umm….. where did the anomaly for 2024 come from ??
Considering 2023 warming was caused by an El Nino event.. seem pretty stupid to use it in any simplistic linear trend calculation.
Let’s use 2010-2022.. a rise of 0.2C over that period.
Is everyone really SCARED now !! 😉
And even that 0.2C came from the 2016 El Nino.
So effectively no human caused warming at all.
IT’S ONLY NATURAL !!
Mr. Layman here.
“Remember that these anomalies all refer back to the same constant: the global average temperature over the years 1850-1900 which has been agreed at 13.7°C.”
Just what global temperature data did they have for 1850-1900? And to a tenth of a degree?
(Please don’t tell me the numbers came from a tree ring or ice cores. The Sahara Desert is a fairly large portion of globe. Not many trees or ice cores there.)
“Just what global temperature data did they have for 1850-1900? And to a tenth of a degree?”
What was available was written regional temperature data from various places around the world, done with the accuracy of a thermometer.
There was basically no good data on ocean temperatures during that time and oceans cover 70 percent of the world.
The written, historical temperature data we have available shows us it was just as warm in the Early Twentieth Century as it is today.
For years NOAA was claiming one year was hotter than another even claiming a month as the single hottest. I went to their website to see what values they were quoting for any particular year. They were asserting one year was hotter than another by 0.01C! Worse the margin of error was +/- 0.05C! I won’t the word that describes their assertion
I think NOAA proclaimed about 10 years between the year 2000 and 2015 as being the “hottest year evah!” and they arranged their computer games so they could make this claim year after year by claiming each year was one-hundreth of a degree warmer than the last year.
Meanwhile, the UAH satellite shows NO years between 2000 and 2015 that could be called the “hottest year ever!”.
NOAA is playing games with people’s heads using manipulations of their computers.
Fraud. Or greater good. Or some motivation other than the truth.
“That’s how the damage was done. Perhaps even worse was the comment from that august and well-respected scientific journal Nature. ‘Earth boiled in 2023,’ they proclaimed, 2023 was ‘officially the hottest on record.’”
Then it said, “shattering previous records”
Oh my God- shattering the records! What did it go up, 20 degrees?
Oh, this article says “0.17 deg C warmer than the value for 2016”.
Sheesh, I gotta look up the definition of “shattering”. It must mean “extremely trivial”.
Hitl*r phones Biden
Trump is the one always quoting Hitler and other Nazis.
Trump’s Democrat political opponents *are* vermin. Trump is just telling the truth, and the vermin can’t stand the truth.
So if they are comparing this one year to all of the last 125,000 years, they must have average temperatures for each and every one of those years. Anyone know where I can get a copy?
The sun’s energy output 125000 years ago may not have been equivalent to the current output…..but they don’t care…must stay focused and man made CO2 warming….nothing else matters.
Mr Stokes Arse-nal
“So if they are comparing this one year to all of the last 125,000 years, they must have average temperatures for each and every one of those years.”
Yes, one would think so, if such claims are made.
But NOAA and the other Climate Alarmists just make unsubstantiated assertions because they don’t have any evidence to prove that today is the hottest in 125,000 years.
In fact, it is demonstrable, using the written temperature record, to refute this “hottest year evah!” lie. All unmodified, regional charts from around the world show it was just as warm in the Early Twentieth Century as it is today. They show today is not the hottest in the last 125,000 years, and that this is a ridiculous claim by people who should know better.
Any guess of the supposed global temperature rise since 1850 is confounded by many factors such as accuracy and precision, coverage, UHI effect and of course scientific skulduggery.
Whatever that GAT rise it cannot be entirely a result of human C02 emissions because they were relatively insignificant prior to ~1945 and clearly there was a 30 – 40 year period when emissions were rising and temperature was falling or in stasis.
None of that necessary ‘denies’ that CO2 is a ‘greenhouse’ gas or that the increasing atmospheric CO2 concentration had some effect including greening of the planet.
Mr Stokes usefully articulates what is implied but always dodged in alarmist media temperature reports viz. ” we have to have some plan for turning it around “.
Reversing the ongoing industrial revolution and concomitant human wellbeing is not it.
“” we have to have some plan for turning it around “.”
The plan for turning around “what” ???
The main thing harming the planet at the moment, is the idiotic Net-Zero and anti-CO2 nonsense.
The destruction of energy supplies and the anti-humanism that goes along with that.
Yes, the world desperately needs to turn this idiocy around.
Germany, UK, are basically on the brink of collapse because of it.
USA, Australia, and some other once modern societies will follow if they don’t wake the **** up !!
The earth has been hit before by huge asteroids….we must prepare now for another one…same for a super volcano….a super volcano once reduced the human population to about 20,000….oh the humanity.
While I find this post usefully and mostly correct, I don’t think it helps the cause much. More irrefutable generalization is perhaps a better way to go.
We know the surface temperature data is not fit for climate purpose. surface Stations project showed that here back in 2008. So arguing about its details is mostly beside the point.
We know the climate models are bad. They produce a nonexistant tropical troposphere hotspot and an ECS twice observational methods.
We know all the supposed to have happened by now bad things based on those models haven’t happened.
And we know there is no green solution for renewable intermittency, supposedly the answer to the climate ‘problem’.
“And we know there is no green solution for renewable intermittency, supposedly the answer to the climate ‘problem’.”
Maybe instead of burning coal for power we should burn EVs?
Burn a “solution” to provide a solution?
Very nice.
The real-time Global Temperature is 57.76F / 14.31C according to the WUWT value on the right side of pages based on https://temperature.global.
That is too cold for people to live outdoors outside of the tropics. It is so cold people have to live in heated houses and apartments, use heated transportation, and work in heated workplaces.
The bottom line is that so called “climate scientists” are being paid to put out this BS, and are rewarded to do so. And the same is true for the media that broadcasts the crap without ever questioning any of it.
This is the longest Saturday Summary Joe has done. It’s 28 minutes long. The meat begins at 1:25.
I think his forecast for what is coming is on the money. And I think he’s right in what he is saying about geothermal warming. Those that disregard the possibility that abyssal geothermal warming can have an effect on the weather and thus the climate need to provide good explanations for why these major unforecasted plumes of warm water in the pacific have shown up in just a month! The one just east of Australia started showing a speck of red just three weeks ago and has grown to what it is now since then!
Richard, the maps I tried to post earlier are in the video with a full explanation of not only their correspondence with seismic activity but also an explanation of their effects on the weather.
https://www.weatherbell.com/video/the-saturday-summary-132149637?full
Author claims
“Over fifteen years the rate of increase is therefore 0.03°C/year.”
UAH claims:
“The linear warming trend since January, 1979 still stands at +0.14 C/decade
That would be +0.014 degrees C. per year, since there are 10 years in a decade
+0.014 degrees per year would be less than +0.03 degrees C.
If you wanted to claim global warming was no big deal, which number would you use?
You would use +-0.014
The author is not very bright.
He data mined a short period that ended with a hot El Nino year and then assumed the next year (2024) would be just as hot
Not very bright unless he was trying to make global warming look worse