From NOT A LOT OF PEOPLE KNOW THAT
By Paul Homewood

Just a few simple numbers behind December’s CfD results:
- Generation: 2.6 TWh
- Subsidy/MWh : £86.68
- Market Price/MWh: £75.00
Market prices have ranged from £142/MWh at the start of the month when wind power was at a minimum, to £6/MWh during Storm Gerrit.
If this does not show the worthlessness of wind power, I don’t know what does! Its value is minimal when the wind blows; it only has any real value when the wind does not blow!
But because of subsidies, wind farms rake in the money whether the wind blows or not; their price is guaranteed. It is dispatchable generators, such as gas and nuclear, which have to pay for this market volatility.
“Just a few simple numbers behind December’s CfD results”
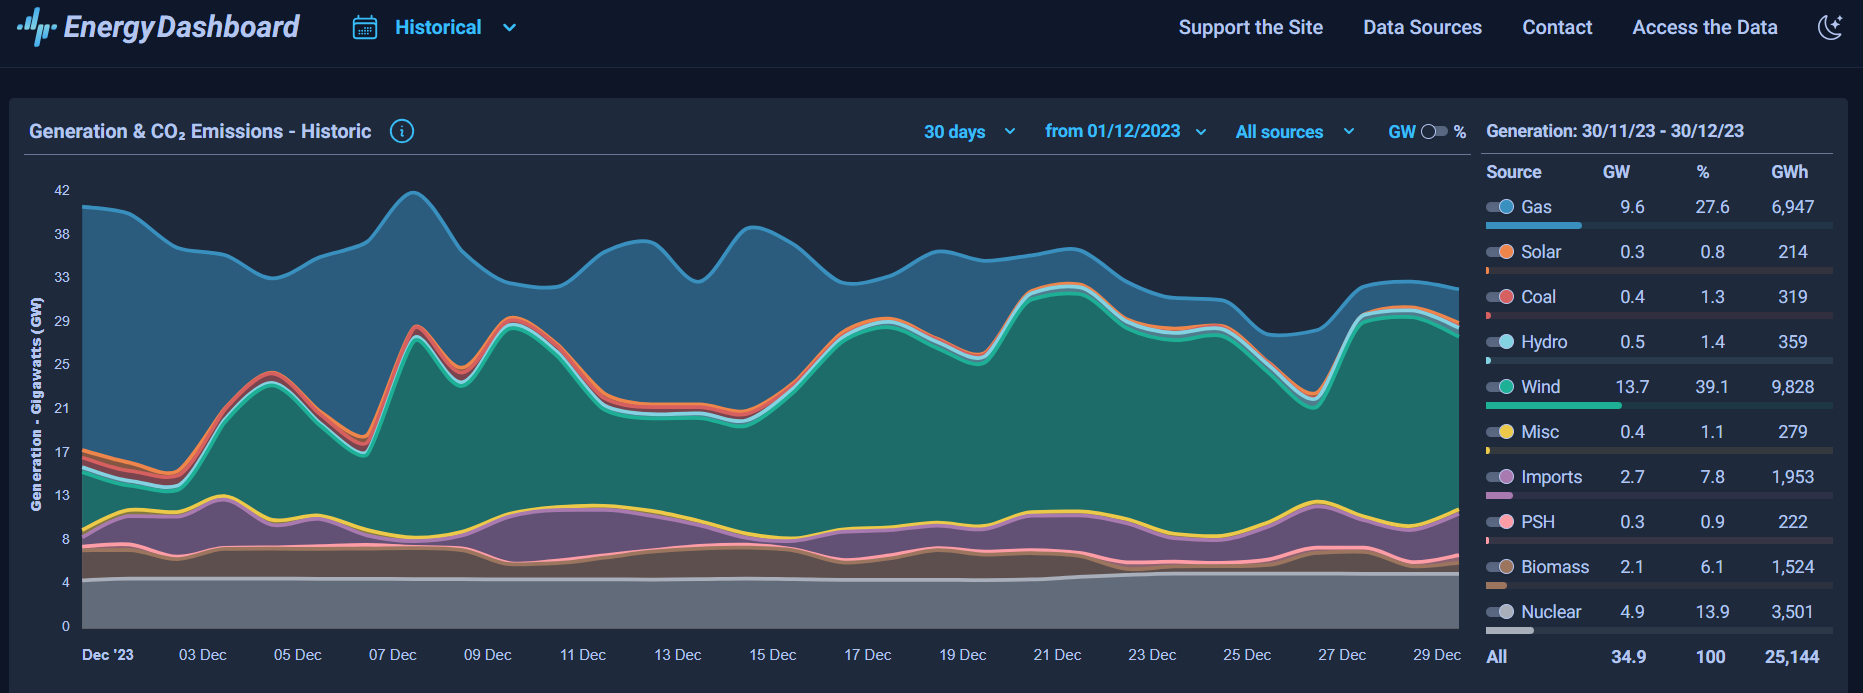
No link given. But according to this dashboard wind alone generated 9.8 TWh in December. You give 2.6 TWh for Wind+Solar+biomass, to get £86.68/MWh subsidy. The true subsidy figure is about £20/MWh.
Look at today’s board. Without gas we’d be freezing our nads off in the dark, Nick.
Why do you bother touting unreliables? They are an impractical virtue signal, nothing more.
Why not deal with his figures? Are his figures correct or not? The issue is not whether or not we need natural gas. The issue is the size of the subsidy paid in December.
I cannot remember a time when Nick got anything right. Can you?
The figures Nick cites have NOTHING to do with CFDs. They are wrong. The article is about CFDs.
Another Nick comparison of apples to walruses without links or other proof.
I gave the link and the screenshot. The generation was understated by a factor of at least 4, and the subsidy/MWh exaggerated by the same factor.
Wrong. Do you understand that the article is about CFD subsidies? No?
From the Nick’s graph source.
So what is the source of Paul’s 2.6 TWh for December? None at all.
From your… source
Gas 25.93GW
Solar 0.139GW
Wind 4.3GW
Imports 3.28GW
Nuclear (what’s left of it) 3.1GW
Only an utter fool would be opposed to more gas, gas that is right under our feet and needs no subsidies.
Still think we can turn off the gas, Nick?
That is not the December figure. You seem very keen to change the subject.
You know full well I am talking about today – 12th January
And you always get your fundament handed to you.
Is that masochism? I think in a weird waay it probably is.
Nick 2 Strativarius 0. (Talking about January is irrelevant when Nick is talking about December.)
Are Nick’s figures for December right or wrong? Keep to the issue.
Ok, let’s assume Nick’s figures are accurate and December was an ok month for wind. However, today and Many other days, weeks and months, wind does not do so well. Solar can never do well until we eliminate nights and seasons and biomass is a bad joke. This is why we call wind and solar unreliable and not fit for purpose.
Campsie
If you don’t like where I go with my posts…
Tough tittie. You are just another commenter.
But from GridWatch by downloading their data, which even Nick or you could do, it appears to me that there was just over 8TWh from wind in December.
Not all wind generation is on the same CfD or have activated their contract as far as I am aware. For some selling at the going rate is more lucrative
Many do much better than market price because they get ROCs. About 1ROC/MWh for onshore wind, and just under 2 for fixed offshore wind, with an outrageous 3.5 ROCs/MWh for flowting wind. An ROC is currently worth around £65/MWh, although we will have to wait until November for a final value.
It’s wrong: it is not the generation by CFDs, which is the topic of the article.
CfDs may be the topic of the article. But it says baldly that generation was 2.6 TWh in December, and said nowhere that is was only for the quarter or so that came under the CfD scheme. It then went on to write as if this ratio applied to wind gnerally, rather than the 1/4 or so of generation that comes under that scheme.
The reason that CfD payments were high in that month were two, both generally not bad for consumers:
The article title: December 2023 UK CfD Subsidies
The bit of the article that mentions 2.6TWh:
Just a few simple numbers behind December’s CfD results:
What could be clearer than that? The number is for CFD generators for the month of December. Your excuses do not wash. You jumped to conclusions without reading properly, not for the first time.
Market prices were low because gas was a whole lot cheaper than it had been, thanks to EU storage being full and relatively mild weather: the UK barely discharged any LNG in November and December, being able to survive on cheaper pipeline gas from the North Sea. Aside from a seasonal increase in wind the only increase in CFD generation has come from Triton Knoll taking up its CFD rather than pay windfall profits tax, and from the very belated startup of Teeside Renewable Energy Project (another biomass generator) that gets a very generous £165.97/MWh under its CFD, and the return to CFD operations at Drax and Lynemouth since the winter Baseload Reference Price was set (the summer price had acted as a massive tax on CFD generation for them).
Consumers gain no benefit from low market prices when CFD generators provide the supply: they have to pay for the difference between market prices and the strike price. Indeed, domestic and commercial consumers get saddled with paying the share of that attributed to energy intensive industry demand, which is exempt.
“Consumers gain no benefit from low market prices when CFD generators provide the supply: they have to pay for the difference between market prices and the strike price.”
They benefit from the low prices from other suppliers, including the 3/4 of wind not on CfD. And for CfD, they are indirectly partners to the two-sided CfD deal. They don’t get the benefit when prices are low, but they don’t get the pain (from CfD) when prices are high.
In the year through September (the latest period for which there is a full breakdown there was 18.07TWh of CFD wind generation, 48.95TWh of ROC supported generation leaving 6.14TWh not supported by those mechansims which will include some on FiT support as well as wind farms on market prices during construction and because they failed to take up CFDs at lower strike prices, for a total of 73.16TWh. Onshore ROC wind averages almost exactly 1ROC/MWh, while offshore ROC wind averages 1.9ROC/MWh. With each ROC worth around £65 currently, and an average across the wind fleet of 1.414ROC/MWh the ROC subsidy is worth £91.91/MWh.
If we compare a windy day with say 20GW of wind, and 10GW of other generation (2/3rds wind) with a windless day with 3GW of wind and 27GW of other generation (1/10th wind) we can estimate costs like this:
24.7% of wind is CFD generation
66.9% of wind is ROC generation
8.4% of wind is market priced (ignoring costly FiT that is a super CFD)
CFD average cost is £170/MWh
Windy day:
ROC subsidy 91.91×0.669×2/3=40.99
CFD cost 170×0.247×2/3=27.99
Market cost applies to 100-(24.7×2/3) percent of output, or 83.5%
Total cost is 0.835M + 68.98
Windless day
ROC subsidy 91.91×0.0669=6.15
CFD cost 170x.0247=4.20
Market cost applies to 100-2.47 percent of output, or 97.5%
Total cost is 0.975M + 10.35
If the normal market price is £50/MWh then the windless day costs £59.10/MWh, which means that the windy day would have to have negative prices below minus £11.83/MWh to be cheaper for consumers.
If the normal market price is £100/MWh, then the windless day cost is £107.85/MWh, so the market price would need to fall below £46.55/MWh to be cheaper on a windy day.
I don’t think that in general your assertion applies: the important parameter is the market price differential between windy and windless days, which needs to be large ev.en with ROCs and market priced wind
The image in the post gives, at top level anyway, the data source – Low Carbon Contracts Company. Go to their website and what appears to be the actual data can be readily found (see link in another comment, above) from which data for Dec 2023 can be extracted. The numbers (by my calculations, at any rate) come out close to, but not identical with, those given in the post.
You seem very keen to ignore the data source citation.
Erm…It relates to CFDs, and it comes from the Low Carbon Contracts Comapny (see attribution on the chart).
As far as I can see, data is available from here as downloadable CSV file, took only a few moments to find as the source (at least at top-level) is given in the image.
https://dp.lowcarboncontracts.uk/dataset/actual-cfd-generation-and-avoided-ghg-emissions
From simply summing CFD_Payments_GBP and CFD_Generation_MWh columns for Dec 2023 and dividing I get 2.9 TWh generation and £88.12 /MWh; and average daily Market_Reference_Price of £75.8/MWh. So not identical to numbers given above, but close. Maybe some rows should be excluded from the calculations, I don’t know.
Correct source. Market reference prices come in two flavours: Intermittent, which is the hourly day ahead market, and Baseload, which is set for 6 months at a time, and only applies to calculations of CFD monies for biomass plants. The winter baseload price is £128.01/MWh.
The data for intermittents shows not only the time average IMRP, but also the daily average weighted by the actual hourly generation of each CFD unit. There is a small complication in that a few CFDs don’t pay out if IMRP is negative for 6 or more contiguous hours for the period of negative pricing. Future CFDs won’t pay out on any hour where IMRP is negative. Wind farms subjected to those terms often curtail voluntarily, or at least try to get paid to curtail. This shows two adjoining wind farms on 23rd December: one operates continuously, collecting its full CFD subsidy, while the other curtails both voluntarily and being paid to do so.
“It is provided for general information only and should not be relied upon for any purpose. It is subject to change without notice.”
Wow, so it’s next to useless.
“Wow, so it’s next to useless”
That was my impression. I wouldn’t use such a source.
“9.8 TWh in December”
Was it all generated when needed? Was any of it wasted? Was any of it stored in any way? What replaced it when the wind wasn’t blowing? What did that replacement cost?
No, Yes, Not really, Gas and interconnectors, Who knows
Well wind did set a new UK record on 21st December 2023 generating 21.81GW, however it was only between 9.00 am and 9.30 am. Wind is so variable you see 🙂
It would have been somewhat higher if Scottish wind farms like Seagreen weren’t forced to curtail (orange in the chart) by transmission (and ?demand) constraints
Nick Stokes. The image in the article says
Source: Low Carbon Contracts Company
Created by Datawrapper.
Did you miss that in your haste to get the first comment?
We’ve had quite a wet and windy December as is usual in the UK. This can be seen in the Gridwatch data.
The original data come from the Low Carbon Contracts Company, which The Spectator cites and used to produce its chart
Link here:
https://www.lowcarboncontracts.uk/resources/scheme-dashboards/historical-dashboard/
Use the drill down features to get data by month. The underlying data at daily level can be found here:
https://dp.lowcarboncontracts.uk/group/cfd-actuals
You will want the Actual CFD Generation dataset and you may find it useful to have the hourly IMRP day ahead prices. I download this data several times a year, and use it to produce charts like this one:
A slightly easier to follow version of the chart, with the legend listed in price order, and the new biomass with CHP category included explicitly
Ugh! wrong one!
So why don’t they crank up all that cheaper nameplate solar and wind Nick?
US power prices soar ahead of extreme cold and record natgas demand (msn.com)
Duh!
Thank you for the link.
The article notes the problems caused by freezing gas lines from production fields and therefore a possible lack of sufficient supplies.
Funny thing is that COAL fired power plants can pile up MONTHS of supply and the “access” to that supply will take just a little more diesel for the loaders to break up the frozen piles of coal.
SO is the immediate destruction of coal electrical generation capacity intentional, so as to cause disruptions when weather happens, as it regularly does? Is the evil that deep?
The last two questions were rhetorical, just in case you didn’t know.
Nick, you should make this comment on Paul’s site so he can answer it.
DaveS and I have both explained why Nick is wrong, and given links to the source of the data.
Thanks for the link Nick. If we go to the “Live” section of the site, we see that today – not too cold (4degC) cloudy and not windy, we need Gas and coal to provide over 60% of our electricity (coal is currently providing more than solar). In the next hour or so 28 million gas boilers will start to kick in to heat homes and a significant proportion of the 45 million cars and vans in the UK will be coming home from work. In the not too distant future, those boilers will not be available and a lot of the cars will be plugged into the mains to recharge. 2 questions:
1 How is all this going to be generated?
2 How will it be transmitted to our homes?
(France will have to offer UK a hardship payment scheme 🙂 )
Presumably not all low carbon generation is subject to a CfD. I’d expect there will be some capacity where the CfD has now expired.
No CFDs have expired yet. The very first started in June, 2016 and won’t expire until 2031.
On BBC Radio 4 (aka Radio Woke) they have a half-hour condensed highlights of the day in Parliament programme. I caught some of last night’s offering – a debate on modular nuclear energy. It’s abundantly clear that the politicians – all of ’em – know not their fundament from their elbow. The overwhelming consensus appears to be ‘renewables are cheapest‘. Ergo, vote Reform UK.
Back in the real world our energy prices have just gone up again
https://www.ofgem.gov.uk/publications/changes-energy-price-cap-1-january-2024
We’ve reverted back to coal and wood as we have a fireplace – well, isn’t the general idea to go back to the noble savage, anyway?
Most houses round here could have covered fireplaces reopened for use….. warmer and much cheaper than a heat pump. And 100% more reliable than wind and Sun.
A couple o’ tons of nutty slack, should do nicely 😊
Of course no American knows that term. 🙂
not counting some British “migrants” I know- legal migrants
“Nutty Slack” is a term used in the UK and Ireland to describe a type of coal that is small and compressed into irregularly shaped pieces, often referred to as “slack.” The term “nutty” refers to the smaller size of the coal pieces.
Nutty Slack is generally considered to be a lower quality coal, as it tends to have a higher ash content and produces more smoke and soot compared to higher-quality coals. It is often used as a low-cost fuel for domestic heating, particularly in open fires and multi-fuel stoves.
Burning in open fires was one of the causes of smog in UK ciities particularly in London.
Thanks to my UK colleagues, for expanding on the term. Back in the 50s and early 60s, it was all that many could afford. Embedded within the coal, was lots of fine coal dust, which we used to bank it up on the fire, it would then slowly smoulder, making the slack last longer.
In the 50s, I lived in Manchester, and as Ben said, some cities suffered the smog. Manchester no exception, The smog would be so thick, that you’d have to find your way home, by feeling for the walls etc. On every traffic island, there would be a couple of oil lamps (bit like genie’s) with a little smokey flame.
I guess from Ben’s monicker, he enjoyed the lovely sweet air around Loch Lomond 😊
I miss a nice pint of Thwaite’s nutty black.
What about Old Peculiar?
I preferred Theakston’s Best, especially in summer. If you went to the bar at Simpson’s, you could get Brain Damage – a wicked blend of bottled Abbot and something else that I’ve had too much brain damage to remember. Sadly closed for now, and if they re-open you have to wonder whether they will remember or sink into GenZ mocktails.
I once had a few pints of Titanic Wreckage, in a pub in Manchester. It was aptly named 😜
This was on offer in Wetherspoons in Falmouth, I didn’t try it.
Bob,
it’s peculiar that it’s spelt ‘peculier’
You know, I’d never realised, just goes to show how potent it is 😃
Thanks, strativarius. I had to look it up, but there it is, my new word for the day: fundament. Polite definition: the fleshy part of the body you sit on. Less polite definition: a$$.
Charles could be watching…..
Visited a new owner of a cabin here on Cedar MT. The home he bought was built by an old timer and had a cast iron stove that is actually able to burn coal. On the deck was a 55 gallon plastic drum 1/2 filled with coal.
I heat with wood in a manufactured fireplace during the day when I can feed the fire. Because of where I live, and not having the desire to pay for wood, I burn aspen, pine and fir. Even the most dense fit will only burn, when well loaded, for about 2-3 hours. The fireplace was not designed to burn coal. If it were, I could just load some coal at night to keep the heat output. As it is, the propane central heat does its job at night. Heat Pump, at 7 f, I don’t think so. The gentleman who bought that cabin has a big advantage.
BTW, there is an active coal mine less that 40 miles from my location. 40 million tons of coal to be surface mined. But the mining company is owned by a Chicago crook (typical) who is not following the rules.
Seriously, that 2.6TWh figure for December wind generation is garbage – where did it come from?
Where’s our man Leo (Smith)
Ah: here he is
At least the data there is easy to download and is originally sourced from the UK’s own ‘Balancing Mechanism’
here
As attached is a shot from my little spreadsheet of what Leo is publishing at Gridwatch Templar.
btw: That ‘1475’ figure for Biomass represents 1.36 Million Tonnes of CO₂ being emitted from the flue-pipe at Drax itself
At least ten times more is coming out of the forest floor where the trees once were growing and 90,000 Tonnes per month is not being absorbed, going onwards into the future, while the trees are ‘no longer growing’
nonsense- anyone wanting to understand the forestry end of this issue should talk to a knowledgeable forester- not the climate nut job forestry haters which is where such stupidity comes from
The figure is not garbage. It relates to production under CFDs. There is of course a bunch more that is subsidised by ROCs and some even by FiTs, with a residual from wind farms under construction and those that have not taken up their CFDs despite being fully commissioned both of which get market prices.
Your numbers look like mine using GridWatch and December
The Gridwatch numbers take the live metered wind farm data from BM Reports. That does not cover the mainly distribution embedded onshore wind farms. There are also a handful of small nearby offshore windfarms that are only connected at distribution voltage. The non live metered output us treated as a reduction in demand, much like rooftop solar.
From the article: “Storm Gerrit”
When did Storm Gerrit occurr? Have there been more than one storm with the name Gerrit?
Storm Gerrit conveys no information. For someone like me, it does not tell me if it is a current storm, or one from the past. This is one reason giving weather fronts names is a stupid idea. Significant weather fronts should be designated by the date they occurred. If they want to include a stupid name, fine, but put the date in there, too, otherwise some people don’t know what you are talking about.
Gerrit is just a variation of Geddit, whch you are supposed to do…. What matters is the propaganda, never mind the dates.
Global Agenda Setting (2024) US delegation:
“The composition of the U.S. delegation was announced by the White House via a press statement. It lists the following representatives of the Biden administration, but is not limited to:
https://www.breitbart.com/politics/2024/01/12/climate-czar-john-kerry-leads-u-s-delegation-flying-to-davos-for-elite-wef-conclave/
Beanz will not be on the menu.
Groan, did I get that wrong:
The 2.6TWh refers to generation by windmills/farms that signed up to the CfD scheme
Many didn’t because the spot market price was so high for electricity and they were better off not signing up.
(Was it they themselves throttling the windmills to hold the price up?)
No matter, many others would have been on the (old now retired) Renewable Obligation Certificate scheme (ROCs)
Those ROC tickets were tradable items = things that windfarms were given for making renewable energy and that fossil generators were obliged to buy to offset their perceived naughtiness.
Onshore windmills were handed (by Government) one ROC per MWh generated and offshore mills got two ROCs per MWh generated
The usual ‘going rate’ for trading those was about £50 each – hence offshore windfarms were getting a minimum of £100 per MWh even if they gave their power away.
Aha – hence the ‘cheap’ night-time electricity we hear about
It is why many windmill operators walked away from the last auction of CfDs – because they would be henceforth obligated to join the scheme and is why the Strike Price for CfDs became exactly what it did =
i.e. £100 per MWh = the same as the old ROC scheme.
So of the 10TWh generated in December, 2.6TWh got the subsidy claimed by Nick but the rest got a minimum of £100 plus the market price.
Heads you win, Tails I lose – every single time
ROCs are still very much a thing, accounting for the bulk of subsidies paid out to renewables. What changed is that new projects could no longer join the scheme, being required to apply for CFDs instead.
Interesting. Payments for energy that makes no (almost) difference to electric service customers.
“Green” supply paid more with just a possibility of some imaginary benefit for some small amount of CO2 reduced (also possibly) without any measured/detected actual reduction or delay in “world temperature.”
Electric service by definition provides always available, correct voltage and frequency, in the amount of power (kW), and amount of energy (kWh’s) required by thermostats, ovens, water heaters, refrigerators, chargers, water supplies, ETC,..and most non-heating commercial and industrial uses.
WUWT keep up the good work….it may be too late, but starting to break through!
How much more price increase and availability reduction will it take before people realize that “renewable energy” is a scam being supported by a complicit media? Can’t people just look at their energy bills and figure this out for themselves?
Remove all wind and solar from the grid.