From NOT A LOT OF PEOPLE KNOW THAT
By Paul Homewood

https://www.metoffice.gov.uk/hadobs/hadcet/cet_info_max2023.html
I want to focus on the end of year CET graph, which gives the lie to the extreme temperature myth often bandied around.
The graph plots daily max CET temperatures, against the background of the percentiles of the 1961-90 climatology. The Met Office should of course be using 1991-2020 as the baseline, so the climatology should be shifted upwards by a half a degree or so. But we’ll leave that aside.
We can legitimately regard anything between the 5% and 95% bands as being “weather”. Only days outside this might be regarded as “extreme”. (I would actually argue anything outside 1% and 99%).
We see that apart from a handful of days, every day was within that “normal weather” band.
In a year there will be 36 days outside of that band on average. The Met Office do not supply the data for these percentiles to enable the number of days to be calculated, but this year it does not look to be excessive in terms of that average.
Moreover, although there were a few days in September which set record highs for that particularly day, none were records for the month as a whole. The highest temperature last September was 28.9C, but the record for September stands at 31.5C in 1906:

Of course most of the year had temperatures above the average. But we have a wide range of weather in Britain. We can have mild, wet winters, and cold, snowy ones; we can have cool, wet summers and sunny hot ones. But these are weather events, not climate, and they are dependent on weather patterns, the jet stream and so on.
A predominance of warmer weather is not climate change.
Over the past few years, UK has been fortunate enough to be BLESSED with a little bit more SUN-shine than they usually get.
Sunshine variability in the UK is closely related to jet stream tracks and the average position of the various semi permanent high pressure cells. All the evidence is that they are influenced by top down atmospheric effects from solar variations.
Probably linked to chemical effects in the upper atmosphere involving changes in the balance of ozone creation/ destruction caused by changes in particles and wavelengths emitted by the sun.
No evidence at all of anything out of the ordinary. Just a small slow recovery from the Little Ice Age and/or some minor temperature variations over decades due to natural system variation.
But nobody in the climate, energy or political establishments wants to know.
We have to dismantle our civilisation and potentially starve or freeze billions worldwide for this?
The warming rate since 1975, that correlates with a 27% increase in CO2 from manmade CO2 emissions is NOT the pattern of a typical natural climate change. The UAH temperature is currently up about +1 degree C. since 1979.
(1) A smart person says we do not know exactly what caused the warning since 1975
(2) A clever person says the evidence is somewhat stronger for a variety of manmade causes than a variety of natural causes
(3) A dumb person says
100% natural or 100% manmade.
You arer not smart or clever
on this climate science issue.
“The UAH temperature is currently up about +1 degree C. since 1979.”
No evidence it from CO2, since ALL the warming has come at El Nino events.
Certainly, only a complete fool could DENY that the recent spike is not from an El Nino event.
Silly short-term correlations are NOT proof of anything.
A clever person realises that there is no evidence of CO2 warming…
… but dickie is NOT a clever person, no matter how he likes to portray himself.
He is actually particularly ignorant of many things about climate,, and doesn’t realise it..
.. nor does he care about displaying how ignorant he is.
The El Nino Nut conveniently forgets
that La Ninas offset El Ninos in the long run and there is no net warming or cooling effect.
La Niña isn’t a cooling event but a no-warming one.
Krishna Gans:
No, a La Nina IS a cooling event, usually caused the injection of SO2 aerosols into the stratosphere by a VEI4 or larger volcanic eruption.
What causes La Niña?
Typically, a La Niña is preceded by a buildup of cooler-than-normal subsurface waters in the tropical Pacific. Then, easterly trade winds strengthen, cold upwelling off the west coast of South America and along the equator intensifies, and sea-surface temperatures (SSTs) drop below normal.
Not an SO2 event
But I will not call you an SO@ur momisugly Nut
because reduced SO2 emissions since 1980
are one cause of global warming.
Richard Greene:
Regarding La Ninas and El Ninos: See “The definitive cause of La Nina and El Nino events.
https://doi.org/10.30574/wjarr.2023.17.1.0124
La Nina refers to the periodic cooling of ocean surface temperatures in the central and east-central equatorial Pacific. Typically, La Nina events occur every 3 to 5 years or so, but on occasion can occur over successive years. La Nina represents the cool phase of the El Nino/Southern Oscillation (ENSO) cycle.
You are a dimwit.
Dimwit is you.
And as I said.. you don’t mind displaying it for all to see.
Copy/paste without understanding is never a good idea.
Dickie…displaying ignorance of what El Nino and La Nina are..
oh dearie me
Why do that ?
They are not opposite actions
Please try to learn before commenting..
“in the long run”
Depends on solar energy for the recharge cycle.
Been very high since the 1970s.
Or didn’t you know the Earth got most of its energy from the Sun ??
Are you really that ignorant !
Describe the pattern of “a typical, natural, climate change.” Please.
You are not smart or clever on any issue.
You start with a theory of which natural cause of global warming suddenly accelerated in 1975. What would that be, oh clever Insulter Man who hides behind a moniker like a coward?
With manmade causes, CO2 emissions accelerated in the 1970s and SO2 emissions decelerated after 1980. Two good theories supported by data that easily explain the poast 1975 warming with no need for any natural causes.
The correct answer, of course, is no one knows for sure.
Taking global temps, about 1975 the decline of temps ended, decline temp because of decreasing CO2 ? 😀
CO2 rose only _7% from 1940 to 1975 and the small warming effect was more than offset by rising SO2 and other air pollution
After 1975 CO2 rose 27% to 420 and SO2 emissions fell consierably after 1980. Bith manmade causes of global warming and possible the main causes of pst 1975 warming but the correct answer is we do not know the exact causes.
Following Occam’s razor principle, the simplest possible explanation for the post 1975 warming is more CO2 and less SO2, but that is not necessarily the right explanation.
Oh dear, using short term correlations.
Occam’s razor is used to cover ignorance… and is not science.
Stick to low-end finance, dickie. !
How much did CO2 rise and SO2 fall during the similar warming from the 1910’s to the 1940’s?
Actually dickie, between 1980 and 1997, atmospheric temperatures stayed about the same. while CO2 ppm climbed
And from 2001-2015 they also had zero trend. while CO2 ppm climbed
From 2016-begining of 2023, atmospheric temperatures actually fell.. while CO2 climbed.
Occam’s razor.. says you are an ignorant clown. !
Yes, of course, “the truth” usually lies somewhere between extremes.
I think the best “middle of the road” case is presented by Stephen Koonin in his book, “Unsettled”. He agrees there has been a mild warming but he wisely concludes its nothing to panic over and he manages to say that without insulting those on either side, as you seem to insult both sides. You could contribute more to this struggle by focusing on convincing the climate hysterics that the oceans aren’t boiling and that we don’t need net zero- rather than critiquing so arrogantly those here who see the massive defects of the unsettled climate cult and understand the immense damage this will do to our civilization.
You claimed about me insulting people … by insulting me, Clever. I know you guys miss Griff the punching bag, so I’ve tried to take his place. I’m 100% libertarian / conservative but I know how to get the crowd riled up.
I’ve always done a lot of climate and energy reading so as a public service a few years ago I launched a blog to list my favorite CONSERVATIVE articles each day, written by a wide variety of conservative authors
My climate blogs have had over 680,000 page views including about 1,050 yesterday. I’m hoping more conservatives will learn the difference between real climate science, junk climate science and wild guess climate predictions that have been wrong for 50 years.
Unfortunately, climate beliefs tend to be like a lunatic asylum with leftists believing the government is 100% right and many conservatives believing the government is 100% wrong. No one willing to admit “we don’t know that”. Both positions are extreme and wrong.
The leftists get the real science right.
Add CO2 to the atmosphere and earth can’t cool itself as well as before. No big deal. Completely harmless. Plants grow better so more CO2 is good news.
Then there is the junk science
For leftists it’s worst case assumption like CO2 staying in the atmosphere for up to 1000 years and a huge water vapor positive feedback that could triple the warming effect of CO2 alone
For conservatives we have the CO2 does nothing Nuts, El Ninos cause all global warming NUTs and there is no greenhouse Nuts.
For the wild guess predictions of climate doom, the conservatives are smart enough to rejet them. But the leftists love scary climate fairy tales and the fact they’ve been wrong for 50 years doesn’t bother them, if they even know.
The problem with conservatives is we have too many claiming CO2 does nothing, or CO2 is 97% natural, or there is no greenhouse effect. That science denying is counterproductive if we want to refute scary climate predictions.
Climate change is nothing more than scary climate predictions that are never right. Why debate basic climate science when the predictions are not based on basic science? They require a lot of worst case assumptions and unproven theories (aka junk science)
There is no hope in changing a leftist mind. Facts, data and logic did not create their climate doom beliefs so facts, data and logic can not change their climate dom beliefs.
Maybe someday during a cold year or a Nut Zero blackout they will listen to us for a few minutes. If we say CO2 does nothing or there is no greenhouse effect, they will immediately stop listening and I won’t blame them
The Honest Climate Science and Energy Blog
NOTE: The “you can’t prove it” argument does not work in science because science does not prove anything. Science neither proves nor disproves. It accepts or rejects ideas based on supporting and refuting evidence but may revise those conclusions if warranted by new evidence. That’s my theory. But I can’t prove it.
Well that was a funny little zero-evidence rant… rampant ego and all.
With the obligatory link to an arrogant lukewarmer blog.
“will learn the difference between real climate science, junk climate science”
Your comments often do the opposite , erring on the junk side.
“I didn’t say CO2 does nothing”
My claim is that there in no scientific proof that it does.
I am still waiting. !
Best dickie has managed is a call to vague short-term correlation, that break down immediately once you look at atmospheric data.
And theoretical calculations using radiation only, or measured in glass jars…
… neither of which remotely express the true atmosphere.
“NOTE: The “you can’t prove it” argument does not work in science because science does not prove anything.”
The “you can’t prove it” is aimed at an individual or indivuduals who are making scientific claims about something, and is not aimed at “the science”.
If you make a claim and I say you can’t prove it,then you better prove it or else it looks like I had it correct: You can’t prove it. Therefore, your claim is worthless, whatever claim that may be.
“Prove it” is a perfectly acceptable reply to someone who is making claims.
“Prove it” is the Foundation of Science,
So here’s one: Prove that CO2 has any discernable effect on the Earth’s climate or weather.
I didn’t say CO2 does nothing, as you claim some of us skeptics do, I’m saying CO2 has no discerable effect on the Earth’s weather or climate. Prove that wrong. If you can’t, that’s science. If you can, that’s science.
Saying “Prove it” does work in science.
“Add CO2 to the atmosphere and earth can’t cool itself as well as before”
What a load of idiotic anti-science nonsense.
True lukewarmer junk-science. !!
Did you know that when they tested CO2 in double glazing.
… they got an INCREASE in heat transfer compared to air.
Somehow all the “radiation” models seem to forget that as the temp goes up then so does the amount of radiation. The heat is *not* trapped. The typical argument is that the earth can’t radiate it all away at night while the truth is that if the initial nighttime temp is one degree higher than yesterday then the amount it initially radiates away is higher than yesterday.
What needs to be looked at is the total area under the exponential decay temp curve at night, not just an “average” value. The area under the curve for the first hour (as an example) will be greater for the curve beginning at a higher temp.
As usual, climate science tries to deduce the “truth” while using averages. No attention to variance of the data or actual integration of the curves. No idea if the “averages” are truly representative of the actual physical world.
“Somehow all the “radiation” models seem to forget that as the temp goes up then so does the amount of radiation.”
The only person forgetting that is bnice himself. He’s the one who thinks you can keep putting dollops of warm air onto the surface and expect the temperature to remain permanently warmer.
The greenhouse gas theory is saying that greenhouse gases decrease the amount of outgoing radiation, meaning the world has to get hotter before it reaches an equilibrium.
“The only person forgetting that is bnice himself. He’s the one who thinks you can keep putting dollops of warm air onto the surface and expect the temperature to remain permanently warmer.”
Your lack of reading comprehension skills is showing again. That is *NOT* what he is saying.
“The greenhouse gas theory is saying that greenhouse gases decrease the amount of outgoing radiation, meaning the world has to get hotter before it reaches an equilibrium.”
You shouldn’t speak to things you know nothing about.
The point is that the greenhouse gases don’t trap the heat. If the surface temp goes up then so does the amount of radiation from the surface. It does this during the day as well as at night.
If CO2 is well-mixed and blocks radiation from the surface then why do deserts get colder at night than prairies?
“Your lack of reading comprehension skills is showing again. That is *NOT* what he is saying. ”
Good to see you agree that his theory that all the warming of the last 50 years was caused El Niños. We finally agree on something. (end bnice mode).
“The point is that the greenhouse gases don’t trap the heat.”
Not permanently if that’s what you mean. But they reflect some radiation back, which means less is radiated away. Hence the earth has to warm to get to the stage where energy out equals energy in.
“If CO2 is well-mixed and blocks radiation from the surface then why do deserts get colder at night than prairies?”
Not an expert, but do you think it might have something to do with moisture in the air?
“ But they reflect some radiation back, which means less is radiated away.”
no! If this were true then the earth would have become a cinder millenia ago. This is the very definition of “trapped heat”!
If 10 photons of energy are radiated away and 9 escape and one is reflected then what happens? Does that one photon of energy raise the temperature of the earth? If it does raise it what happens to the radiation rate immediately afterwards? Does it go up in response (i.e. that one photon gets reradiated), does it stay the same, does it go down?
“Not an expert, but do you think it might have something to do with moisture in the air?”
Of course it does! Please note carefully that you didn’t say it was the CO2 that made the difference!
This is why temperature is such a piss poor way to measure heat. It should be measured using enthalpy – which we’ve had the capability of doing for over 40 years. Yet climate science adamantly refuses to even START an enthalpy record.
“The problem with conservatives is we have too many claiming CO2 does nothing, or CO2 is 97% natural,“
You have produce zero evidence that CO2 causes warming
The annual CO2 fluxes are about 97% natural.
Or are you still brain-washed with lukewarmer idiotology. ?
——-
” El Ninos cause all global warming”
Certainly there is no sign of any other warming in the satellite based atmospheric data.
Denying actual science and data, seems to be your thing. !
“The leftists get the real science right.”
Thanks for enlightening us on that.
“Lukewarmer”, may be the wrong word.
“Rabid leftist anti-science AGW proponent”, is closer to the mark
A clever person, keeps their mouth shut, and doesn’t get involved in the climate scare trivia.
“The warming rate since 1975, …is NOT the pattern of a typical natural climate change.”
Oh? Really? Explain. Please show your work.
1979 was the coldest period since the 1930s/40s warm period.
Extreme high anomaly in Arctic sea ice.
Time of the “new-ice age” scare
All raw temperature data from the Arctic shows a deep trough in temperatures.
Warming from the coldest period is TOTALLY NATURAL !!
Also from the 1970s was a period of massive urbanisation around the world, swallowing up once reasonable surface sites with urban warming effects, even rural area experienced this expansion.
Not to mention the massive amounts of mal-adjustment of past data.
Thankfully we have the satellite data, and it shows that since 1975, the only atmospheric warming as coming from the oceans at strong El Ninos.
There is essentially no direct correlation between CO2 and global temperature. There is a strong correlation between temperature increases and whether or not a D or an R is in the White House. Study the attached graphic. Can’t deny the science.
A comparison with Valentia shows a distinct human population growth effect as well.
Note… UK population has had a pretty steady growth rate since around 1800
That would be the urban heat island effect on our various observing sites.
No evidence of any CO2 effect at all.
Most of the warming in CET is in winter.. so yes, urban warming
Most greenhouse warming is in the six coldest months of the year. You have no data to blame the CET warming on UHI.
The present-day CET is calculated from stations located at Stonyhurst (Lancashire), Rothamsted (Hertfordshire), and Pershore (Worcestershire), but a number of weather stations and early archive records of personal measurements have been used to construct the series over time.
The Central England Temperature series – Met Office
“….early archive records of personal measurements have been used to construct the series over time”
Your ‘data’ extends back to 1660.
The Stevenson screen wasn’t adopted by the British Met. Office until 1884, that date mentioned in the Met. Office page you link to but which you are too dim to consider important.
In your desire to present yourself as knowledgeable, or even relevant on the subject of climate change you, once again, fall flat on your face.
(A little factoid folks – The Stevenson screen was invented by Thomas Stevenson (1818–1887), a Scottish civil engineer who designed many lighthouses, and was the father of author Robert Louis Stevenson [Wikipedia]).
dickie love faceplanting in his own BS. !
Does it oh so often it has become a habit he cannot break.
And beNasty2000 loves childish insulting, with no science content, comments
Lack of scientific content???
Still waiting for your scientific evidence that CO2 causes warming.
Total lack of any science from you.
Plenty of laughably arrogant blether, though.
Equipment was changed many times over the centuries, the screens were downsized and perhaps the station locations changed too.
Three weather station in central England are only useful for people who live in central England. There is no reason to assume local climate changes will always match global climate changes.
Kindly describe the standardised, internationally distributed weather measuring equipment prior to 1884, Dick.
Nor was the Stevenson screen ever designed to contribute to a global climate assessment project, they were standalone, local weather monitoring stations.
Most of the data from them was, at best, sketchy and it’s difficult to understand how they could have been globally synchronised, being that the fastest means of international transport in the early days of it’s inception was the Cutty Sark.
It would also have taken, probably, 50 years before they were adopted on an acceptable scale globally, so any possible reliable data from them wouldn’t be available until well into the 20th Century.
Canvas buckets over the sides of ships to measure water temperature, to no definable depth, were used well into the 20th Century (at least) and my understanding is that even today, ship intakes to determine water temperatures have no international standard.
https://os.copernicus.org/articles/9/683/2013/os-9-683-2013.pdf
(This folks, in my opinion, is how scientific papers should be presented. Very readable, factual, and at times, considering the hysteria today, rather amusing. It dates all the way back to back to, Oh my gosh, 2013!)
The Mauna Loa observatory wasn’t established until 1958, reliable and verifiable results from probably weren’t available until the 1970’s at the earliest.
Argo buoys and satellites were fraught with early problems.
And no one can convince me geological and ice core data can get within a 1ºC margin of error over any reasonable period of time.
Gosh, sorry, gone on a rant thanks to, Dick.
If you got this far, thanks for reading folks.
Observations and (sane) criticisms always appreciated.
You have absolutely NO DATA to blame the warming on human CO2 or any other human causation.. except perhaps aircraft exhausts.
You have continued in your total failure to back up your putrid lukewarmer CO2 warming fallacy..
Don’t get him started on chemtrails! 🤔
Oh, is dickie a chemtrails nutter.? that explains so many things 😉
Are you postulating that the UHI doesn’t work in cold weather?
Here in the UK we don’t do A/C in summer like much of America does but we do heat our houses in the winter, which is possibly why we see a big UHI increase in the colder months.
Back in the 90s, I lived in the Calder Valley, high up on the hills, 1000ft. I would drive into Manchester daily. In the winter, I’d have ice on the windscreen, and the dashboard showed an outside temperature of -1C. As I approached the outskirts of Manchester, the temperature had risen to 3C.
I wonder why?
Because for every ~ 300ft of height the atmosphere cools adiabatically by 1C.
One slight problem, it was the same at lower altitudes, and when on the outskirts I could be at 300ft. So you can rule out the old altitude differentials.
Richard Greene:
The ~ 30-year warm period during the LIA was due to an absence of VEI4 or larger volcanic eruption, so that the atmosphere was free of cooling volcanic SO2 aerosols.
The LIA, itself, was caused by VEI4 and larger volcanic eruptions. Every downward temperature event can be correlated to a known volcanic eruption.
The temperature rise since about 1980 has been due to global “Clean Air” efforts to remove industrial SO2 aerosols from the troposphere.
You maintain that SO2 aerosols have only a minor effect.
However, changes in their level in the atmosphere are the ONLY thing that causes temperatures to change. They are the Control knob for our climate.!
I was a long term participant at NALOPKT but it was nonsense on stilts like this, refusal to accept hard evidence that conflicts with our climate skeptic viewpoint, that caused me to leave.
Remember, the CET may not be perfect, but it is the best thermometer record we have, supposedly free of/compensated for other influences. Even if it weren’t, the warming is now so convincing in the CET that there is no possible reasonable doubt that it is real and substantial.
In nearly 400 years 2022 and 2023 are joint warmest, and of the warmest 10 only 1949 and 1999 aren’t this century.
The record warmth is indeed mostly a result of record high average minimum temperatures rather than extreme highs, but not from urban warming in the CET, but because our weather has been increasingly dominated by air masses from warmer/wetter zones and there has been a remarkable reduction in clear cold nights at any time of year.
And not, of course, because 90% of the UK weather stations have become contaminated by UHI over the last 50-60 years at all. sarc
Three weather stations in central England have shown significant warming since the very cols 1690s. There is the potential problem of repeated equipment changes. But the trend is almost certainly warmer by at least two degrees C. since the trough during the Maunder Minimum
This weather report has no purpose
“A predominance of warmer weather is not climate change.” Paul Homewood
That statement makes no sense.
Global warming here in SE Michigan is a gradual warming of winters and a lot less snow than in the 1970s. We love our warming.
From snow shoveling our driveway once a week to once a month in the past two winters.
In addition, the summers are not getting warmer. Last summer was unusually cool with the most rain since the 1970s. Our lawn remained green all summer with no watering – unprecedented in Michigan. We sure hope that will be a long term trend.
The change in our local climate was gradual over the past 45 years. Slowly the Michigan weather changed. In the 1970s a stom that hit Chicago reached Detroit one day laters. Now it may pass an hour south of Detroit. A very gradual change.
We do not need any Ph.D. climate scientists to tell us what climate change we have experienced, why our local climate change was very good news, and why we’d like more global warming in our region. The claim that global warming has been bad news, or will be bad news in the future, is a fantasy.
The increased CO2 may be improving plant growth but the only evidence is we have far more deer eating plants in the neighborhood than ever before. In 1987 seeing one or two deer once in a while in our yard was typical. Now we see deer in the same yard every day, with up to 14 at one time. The outdoor plants are supporting more deer than ever before.
yes dickie, increased atmospheric CO2 does allow plant life to produce more food and support more animal life….
Well done, you got something correct.. 🙂
Don’t spoil it !!
Too late, he did.
1690s? Were there thermometers back then- or is this based on tree rings? 🙂
It’s based on instrument records, but needs to be taken with a very large pinch of salt that far back.
Surface instrumental records need to be taken with a very large dose of stale cod-liver oil…
… and a strong enema. !
Story tip.
Giant offshore wind project axed in blow to Biden’s green goals (foxnews.com)
The government wants to play both sides
“” DEFRA FUNDS CAMPAIGNS BOTH FOR AND AGAINST WOOD BURNERS””
https://order-order.com/2024/01/04/defra-funds-campaigns-both-for-and-against-wood-burners/
It’s been mild but a cold spell is on the way. The weather is highly variable, but the climate here isn’t
So what? Still way within natural variability. Meanwhile palaeontology proofs with natural evidence that the Climate model reconstruction of the past is deeply flawed. Here a small examination from the Institute of Palaeontolgy of Vienna University. They found remnants of wisents (European buffalo) in the alps at altitudes of >1.400m with pollen of oak in the surrounding clay. Nowadays the upper limit for oak trees to grow in this region is at 800m.
: From this it can be concluded that the beech limit but also the forest line during the »wisent time« (6,000 to 1,200 years before today) was much higher and the average summer temperature had to be at least 3 to 6 °C higher than today… Oaks (Quercus) at an altitude of 1,450 metres around 2,000 years ago also indicate a climate approximately 4 to 7 °C warmer than today. Investigations of dated stone pines (Pinus cembra) in the Central Alps support this climatological interpretation (Nicolussi & Patzelt, 2006).
https://www.researchgate.net/publication/363535571_New_subfossil_findings_of_wisent_Bos_bonasus_in_caves_of_the_Northern_Calcareous_Alps_Upper_Austria
Natural variability only exists in real science not in “Climate Science” and in the heads of true believers.
Paul Homewood has a short memory.
Just 3 years ago he was claiming that warming in the CET series had stopped in 2006. He based this on the running 10-year average of the annual mean temperatures.
To support this claim, Paul ‘zoomed in’ on the period 1991-2020, pointing out that the running 10-year average had “reached the peak for the 1997 to 2006 period” then “gradually declined” after that.
Needless to say, Paul has now stopped using this metric for CET, because the two most recent 10-year running average periods (2013-2022 and 2014-2023) have both surpassed the 1997-2006 “peak” and the 2014 “warmest year” record he mentions has already been exceeded, twice, since 2021.
You haven’t paid any attention what so ever to the actual causations, have you fungal
Now,,… where is your evidence of anything happening apart from continual population growth, a strong El Nino event, and a higly beneficial increase in Sunshine hours.
Do you have any evidence at all that this slight warming was caused by human released CO2??
O, btw.. did you ever figure out how much warmer it must have been 1000 or so years ago for forest to grow where now there are glaciers, and deep peat bogs to form where now there is permafrost.
Or haven’t you yet got that little child-mind of yours working enough to realise the FACT that the current climate is still very much in a COOL period of the last 10,000 years
Whatever the cause of the trivial warming- there ain’t no need to panic- and no need for net zero. If anyone thinks such a trivial thing is a need to panic, they don’t understand life at all- given the immense problems we all face all the time.
It’s the constant flip-flopping people like Homewood do that should raise alarm bells, even among WUWT readers.
This is just one example. He wanted to detract from what was at the time a fairly warm year in CET (2020), so he came up with a running 10-year average that allowed him, at that time, him to claim that warming trend in CET had stopped in 2006.
Fast-forward 3-years and his 10-year running mean cherry-pick no longer works, because the last 2 years were jointly the warmest in the CET record and the fastest running 10-year mean in CET is the one ending 2023, with the second fastest now being the one ending in 2022.
So what does he do? Well, rather than just admit this, he switches the emphasis to something else that he thinks might work for him, for a while at least. Something about maximum daily temperatures that doesn’t even make sense.
Just one of many examples of Homewood’s flip-flopping over the years.
Poor fungal infection, its always about someone else.. never realising your own ignorance and stupidity. !
Not everyone has their life ruled totally by a single fetish bought about by their own ignorance, like you are.
At the time Paul was correct.. get over it.
And when sensible people get further information that counters that, they change their opinion… That is not “flip-flopping..
Cherry-picking? you are the one using 2 years only of data, after a large increase in sunshine, and a strong El Nino. !
But he didn’t change his opinion. He just stopped using the previous bluff that failed and switched to another one. Then he puts the ‘hat-tip’ box out for all the useful idiots too thick to know they’re being gas-lit, such as your good self. It’s you he’s fooling, not me.
You mean you were incapable of keeping up with an honest argument.
Poor fungal. !
Not a previous bluff.
That is just how YOU like to do things… lies, petty innuendo and misdirection..
… so you project that onto everyone else,
You think other people are as DISHONEST as you are.
We have seen you do that many times before.
It really is totally pathetic. !
Not only that, but an HONEST person, like Paul, will often try to look at things from different perspectives.
That is something you are totally incapable of doing.
Your one-track fetish on one-off slightly warm temperature is totally hilarious..
.. and the DISHONEST way you try to impute humans have caused it, really are getting quite puke-worthy.
flip-flop, flip-flop, I don’t get into that kind of detail- all I know is there is no need to panic and no need for net zero
Maybe you’re right about that. But the point is, why would an honest broker continuously change the metric by which they claim to judge something? Why, once their previous excuse is busted, do they not just acknowledge that they were wrong rather than embark on a whole new line of misdirection and obfuscation?
An honest person changes their mind when presented with new information.
You are therefore, and extremely DISHONEST one.
Constant misdirection, fake data, mindless panic, and ZERO science…
That is what you do.
You saying someone should be “honest”…
… is like a COP28 cultist saying you shouldn’t eat meat.
Then that would immediately rule Homewood out as ‘an honest person’; because all the ‘new information’, with regard to CET, shows that the most recent warmest 10-year average temperature was 2023, not 2006.
An honest person, by your own definition, for what little that’s worth, would then ‘change their mind’. Of course, Homewood has not changed his mind; he has simply changed his tactics. He still wants the hat-tips from idiots like you, though. Fill his boots! He loves imbeciles.
Why continue to mirror your incessant DISHONESTY and built-in PARANOIA onto other people?
We have seen this is something you have tried to do many times.. and fail utterly, as you have this time.
It really is well passed pathetic and totally idiotic.
If he loves imbeciles, you would be top his list…
… if he ever knew you existed.
And seriously, trying to pretend that two warm years were caused by CO2
You are really on an ignorance binge lately, aren’t you. !
Who even mentioned CO2?
Oh, it was you!
Great.. so you yet again admit that this is NOT caused by CO2..
and is totally natural… Well done.
Now you can stop your idiotic panic and realise that current temperature are NOT warm, they are actually on the COOL side compared to the rest of the Holocene.
And then stop your ridiculous chicken-little panic.
Again, you are the only person mentioning CO2, so….?
There you are admitting CO2 has nothing to do with it.
Or are you being deliberately DISHONEST, as usual.
What is it with you and C02, little bnasty?
Is it, like, an imaginary giant that you are scared of?
I’m keen to get to the bottom of what causing your anxiety.
I think it will be good for you.
Take the nastiness out of you, a little.
Still no evidence of anything.
Just you mindless chihuahua type yapping.
It is great that you have finally realised, and admitted that…
… human released CO2 has NOTHING to do with the current slight warming
I will hold you to that whenever you post yappy little posts about slightly warm temperature.
NO HUMAN CAUSATION.
Now that you have admitted that CO2 has nothing to do with warming..
Welcome to the REALIST CLUB !!
“The graph plots daily max CET temperatures, against the background of the percentiles of the 1961-90 climatology. The Met Office should of course be using 1991-2020 as the baseline, so the climatology should be shifted upwards by a half a degree or so. But we’ll leave that aside.”
Warming of half a degree or so in 30 years. But he’ll leave that aside.
For the record, CET 1961 – 90 average was 9.4°C, 1991 – 2020 was 10.2. So that’s a shift in climate of 0.8°C in 30 years.
This shoes the difference between daily means between the two periods.
Out of an ice age, what a cherrypicking nonsense…
Ah yes, the ice age of the 1980s. I remember it well. Had to trek across the glaciers to get to work, always keeping an eye out for herds of woolly mammoths.
You only show a part of a continuous warming since the LIA.
As you know (because I’ve pointed it out here numerous times, including to you), there is no global warming trend for the ~80-year period from 1850-1930 in any of the temperature data sets that cover the period (HadCRUT, NOAA and Berkeley Earth).
What happened to your “continuous warming” for those 80-years?
Seriously. The surface data is a manic fabrication…. a huge agenda-driven lie.
It does not remotely represent temperature history in any way shape of form.
That is in agenda-adjusted data
.
It is NOT REAL
There was actually a LOT of warming during that period .. just ask people like Hansen, Jones etc.
Even Mickey Manns Hockey stick shows strong warming from 1850..
.. are you saying Mickey was wrong 😉
Also look at historical accounts.. if you have the mental ability to do so.
Try not to remain totally ignorant all your life.
Other NCAR data also shows strong warming up to the 1940s, then strong cooling.
Why is it you are so incredibly badly informed about everything ???
I was specifically pointing to the nonsense of claiming we could remove half a degree of warming by using a more recent base period. That only works because you are admitting the 30 years after 1990 where warmer than the 30 years before. I make no claims as to why it warmed, I just don’t like the desire to pretend it didn’t happen.
As to your claim that the warming over the last 60 years can be attributed to the last ice-age, or even the little ice age, suggests a profound It makes no sense to me to suggest that something that ended a century and a half ago, could still be causing ongoing warming.
Still, if you want to see the entire picture, here’s the CET rolling 30 year average.
Will you show me a contradiction ? 😀
You may have a look at the AMO around 1975,
and a look at the NAO annual mean around 1975,
and a look at starting sunspot cycle 21and it’s strength around that date too.
Maybe, you may have an idea where the warming comes from 😀
the late 1970s was the coldest period since the warmer 1930s/40s
It led to the new ice age scare,
It led to an extreme high Arctic sea ice anomaly in 1979.
It is the coldest period in every unadjusted temperature series from around the region.
The perfect time to use as reference period for a warming scam.
I didn’t mention the start of a second peak of the SOI index at the end of 1974 😀
Sunshine hours… certainly nothing to do with human causation. (except possibly changes in thermometers.)
Or are you going to pretend human CO2 caused a this small spike after a period of near zero trend.
That would be hilarious.
Or this one..more global.
“Or are you going to pretend human CO2 caused a this small spike after a period of near zero trend.”
Since all the bellboy can do is red thumb.. I assume he agrees completely that the warming is of ZERO human causation, and purely from the El Nino event
Welcome to the Climate Realist Club, Bellboy !!
You really are quite pathetic, and it’s fantastic you’ve set yourself up as the emblem of WUWT fans.
I’ve given you evidence – you reject it with your usual infantile jibes. So help me out, what evidence would you consider acceptable? What would make you change your mind that there is absolutely no human causation?
Warming is the end of a cool period, nothing more simple than that 😀
Can you tell me what the NOAA Global Average Temperature was for 1997 and 1998, as computed in 1997 and 1998, please?
The NCEI/NOAA climate reports for 1997 and 1998 put them at 62.45°F and 62.57°F. Even accounting for a different baseline than the 1991-2020 baseline that we use today they’ve removed a fair amount of warming from the record.
So, Bellman, tell me more about this ‘nonsense’ of yours?
“Can you tell me what the NOAA Global Average Temperature was for 1997 and 1998, as computed in 1997 and 1998, please?”
No I couldn’t, and I wouldn’t care. Global Average Temperature depends a lot on how you define it, and is difficult to estimate. That’s why everyone prefers anomalies. You don’t need some arbitrary global average temperature to know how much one year differs from another.
“The NCEI/NOAA climate reports for 1997 and 1998 put them at 62.45°F and 62.57°F.”
Never trust figures that aren’t in proper SI units.
“So, Bellman, tell me more about this ‘nonsense’ of yours?”
The nonsense I was talking about was Homewood talking about CET, saying that we should use the more recent base period in order to shift climatology up by 0.5°C, without realizing that he’s admitting the English climate has warmed by over 0.5°C in 30 years.
Had our distant ancestors not killed off the woolly mammoths through over hunting — people who we just have to admit were not that environmentally or socially conscious — just think of the millions of dollars in profits which could be made today in harvesting mammoth wool from domesticated herds of these animals.
“Ah yes, the ice age of the 1980s”
All over the news.. the new ice age scare….
We got lucky, didn’t we.
Instead of temperatures continuing their rapid downward trend..
…. it started warming after the 1979 low point.
The Arctic, instead of being frozen solid most of the year, driving away sea life, became open around the edges for a couple of months, allowing sea life to return.
Still way more sea ice than most of the last 10,000 years, …
.. that’s because global temperature are COOLER than that have been for most of the last 10,000 years.
The idiotic panic about a slight increase in temperature is totally irrational and based purely on ignorance of climate history.
Paul also fails to point out that the WMO recommend using 1961-1990 as the standard reference period for monitoring climate change, which is one of the reasons the UKMO maintain CET. Therefore they use 1961-1990.
Using the COLDEST period, the time of the new ice age scare, when all temperatures in the region showed a big dip in temperatures.
Of course its warmer than the coldest possible reference period they could use.
All the scaremongering about modern temperature rises. OK I ain’t a climate scientist, but just looking at the historical evidence over several thousand years, the most obvious thing, is that it was bl**dy cold in the LIA. And that there was a fairly rapid cooling after the MWP. And similar previous instances. Warm periods, followed by rapid cooling and likewise warming. Significantly (to me), is the inference that the LIA, lasted longer than any previous cooling period.
So logically, what should we expect? To me, the answer is a fairly rapid warming, with an eventual slowing down, perhaps a plateau, followed by another cooling trend.
Where are we at the present? Is the rate of change, static, speeding up, or slowing down?
From, what I’ve heard from genuine scientists (those not engaged in crisis mongering), they suspect, they’re seeing the first differential in the temperature trend, towards a possible cooling period.
I think I’ll stick with their assessment, rather than the ‘boiling earth’ mob.
I am in the middle of an investigation and writing a piece on TXx — and find the same shape in the US Contiguous TXx graph.
The situation appears to be related to the definition of TXx — “TXx is defined as the maximum of the maximum
daily temperature in a given time period [day, week, month, year…]”
Why would this be a modern issue since 1980? Wait and see…..
“We can legitimately regard anything between the 5% and 95% bands as being “weather”. Only days outside this might be regarded as “extreme”. (I would actually argue anything outside 1% and 99%).
We see that apart from a handful of days, every day was within that “normal weather” band.”
Here’s my graph showing 2023 daily temperatures compared to the 1991 -2020 median values, and the 5% – 95% range for that period.
Out of the 365 days, I make it 51 where above the 95% mark compared with 23 below 5%.
I’m not sure what Homewood’s definition of handful is, but this is more than would be expected purely by chance.
There were 23 days above the 1991-2020 maximum temperature, and only 3 below the minimum for the day of the year.
You truly go to town when there are El Nino temperature spikes don’t you little child.
Human causation… not so much. !
You need to take it up with bnice2000. He thinks it’s all down to sunshine.
As always you are obsessed with finding some cause, any cause, that can avoid any blame being put onto increased CO2. But that’s irrelevant to my to my comment. The point is that Homewood is being less than honest when he claims that all but a handful of days where in what he calls normal weather. It doesn’t matter why there are more than a handful days outside this magic 90% weather interval – I’m just trying to explain he’s wrong on that point.
You truly are ignorant aren’t you !
STILL NO EVIDENCE OF CO2 WARMING!
You know you are being TOTALLY DISHONESTLY using the El Nino to try to set an innuendo of human caused warming..
.. when you obviously know there is no human caused warming
At least now you have admitted that the SUN has played a major role.
Maybe you are capable of learning…. in tiny little toddler steps. !!
so funny….. using an El Nino year and thinking it shows man-made warming, and is worth going all chicken-little panic mode.
Where is your evidence that this very slight extra warmth (in an otherwise COLD country) has any human causation?
Not as funny as the fact you feel the need to demonstrate your own monomania against everything I post. I can say the sky’s blue today and you’ll post have a dozen sniveling insults, insisting I prove it’s blue because of CO2.
Hilarious watching you slithering around when asked to present evidence of human causation.
Not my fault all your comment are based on ignorance at the most basic level.
Just keep using those El Ninos.
You KNOW it is all you have to create your monkey-like linear trends.. !
Bnasty is just a little dog, snapping at your heels. He can’t hurt you; he just yaps and makes a big noise. It only impresses people who like little snappy dogs. Plenty of those here though.
You poor little LOSER.
You are the mongrel here…..
Continuously yapping mindlessly about small changes in temperature.
Unable to answer simple questions or back up any of the crap you post.
Lets watch the little yapper cut and run again.
How much warmer must it have been 1000 years ago, for deep peat bogs to form, where now there is permafrost?
Do you have any evidence at all that the recent El Nino spike had any human causation whatsoever?
Answer .. or run away with your **** tucked between your legs. !
Best you can manage is a red thumb.
You really are EMPTY and a totally dishonest COWARD. aren’t you. !
bnice talking to himself again.
It is great that you agree with everything I have said Bellboy.
fungal is a loser and a coward, with zero science to offer….
…. as opposed to you who is just totally confused and ignorant.
At least you have finally figured out El Nino is the only cause of atmospheric warming.
Shown by the fact that you rely on them completely to create a warming trend.
Well done.
Bnice2000:
If all El Nino warming is deleted from, HadCRUT5, for example, there is still a warming trend!
When dealing with the UK winter warming since the late 60’s, l think there are 2 key factors to this.
First there is their has been natural background warming created by increasing sunshine amounts during the winter combined with a very likely increase in warmer SW winds.
But between the mid 1980’s to the 2000’s there was a sudden jump in the warming trend and its sudden jump in temps that am now convined has been largely caused by the switch over from glass thermmeters to digital thermometers.
As my current study into this topic is starting to show that there is a real with AWS’s temp recordings running warm during winter sunshine.
sorry “its the sudden jumps in temps” and “there is a real issue with AWS’s temp recordings”
“A predominance of warmer weather is not climate change.”
Well actually that is exactly what climate change is. According to the UAH satellite measurements the long term temperature trend is 0.14 degrees per decade. Which means that over time you would expect to see a predominance of warmer weather.
According to UAH there is no human caused warming in the last 45 years.
So called “climate change™” is all about human released CO2 warming.
And you AGW fools keep proving that it JUST DOESN’T EXIST.
“you would expect to see a predominance of warmer weather.”
Yep, NATURAL warming will do that. !!
So “climate change” is only warming. Got it.
The gridded Community Emissions Data System (CEDS) of the University of Maryland shows that dimming industrial SO2 aerosol emissions rose from 56 million tons in 1950 to 139 million tons in 1979, and they are the cause of the decreased temperatures in that era.
This image shows the atmospheric loading of SO2 aerosols in 1980
Between 1980 and 2019 (latest CEDS data available), due to global “Clean Air” efforts, industrial SO2 aerosol emissions fell by 47 million tons This decrease is the cause of all of the warming that occurred between those years.
To put that in context, since 1980 volcanic SO2 aerosol levels have been measured by satellites and, on average, a VEI4 eruption injects 0.2 million tons of SO2 aerosols into the stratosphere, causing 0.20 deg. C. of cooling, and the same amount of warming, when they eventually settle out. A 47 million decrease easily accounts for ALL of the warming that has occurred since 1980.
The included image shows the atmospheric loading of Industrial SO2 aerosol emissions for May of this year.
Nice work.
“The highest temperature last September was 28.9C, but the record for September stands at 31.5C in 1906:”
Always interesting to see this in context. 1906 started the month with two extremely hot days, but then quickly cooled down. 2023 warmed up during the first 2 weeks of the month, and had a run of 6 very hot days, reaching a peak on the 9th.
And of course, 2023 also had warmer night time temperatures.
SO WHAT !!
1906 started with record heat.. That is a long long time ago and it is still the record.
Also NOT having any human causation.
Why does there always have to be a “WHAT” with you?
I thought it was interesting to compare these two record breaking months. I found it interesting, and thought others would too. I’m not claiming it proves anything.
So you are agreeing with my “So What” comment.
Thanks
Bellman:;;
“The record for September stands at 31.5 deg. C in 1906”
?? None of the data sets that I looked at showed high temperatures for Sept 1906.
However, the monthly GISTEMP maps do show a large Heat Dome a bit east of central USA, which was gone by Oct.
A temporary event that has nothing to do with the climate.
We’re talking about the UK here.
https://en.wikipedia.org/wiki/1906_British_Isles_heatwave
Monthly averages won’t show this, as it was only a couple of days in September.
Bellman:
I missed that.
However, as far as I have observed, the only way that a short-term temperature spike can occur is via a temporary heat dome.
There was a small one in that area, just south of the UK, in August, according to the NASA/GISS heat maps, but the UK showed only mild warning in Sept, possibly because of the short duration.
The problem with Paul’s analysis is that the data isn’t up to the task.
While it has been claimed to be a continuous series, in fact there are no less than seventeen! changes in the stations used to calculate the CET. That makes long-term comparisons … well, let me call them “problematic”.
Here’s a graph showing the timing of all of the splices.
w.
If I squint a bit your chart looks like a picture of Phil Jones smiling.
Willis, as I understand it, all the ‘splices’ are fully documented and the methods used to homogenise the CET data have been reported in scientific papers that are peer-reviewed.
Do you have any specific objection to these?
First, the idea that something being “peer-reviewed” means something is an illusion. Something on the order of 50% of peer-reviewed papers are later found to be wrong.
Next, I’m not clear how you can “homogenize” the data.
Suppose we take the average height of ten kids as they grow over time.
Then we swap one of the kids for a new kid … how can you “homogenize” the average? Even if the two growth records are quite similar in the past, what’s to guarantee the new kid is about to stop growing while the other kid is still going strong?
I discuss these issues in my post “GISScapades”.
Best regards,
w.
Apart from CET, another interesting data set is from UAH for the lower trop above Australia. It does not show sensational warming, being flat for the last 10 years. How do you explain hypothetical El Nino connections?
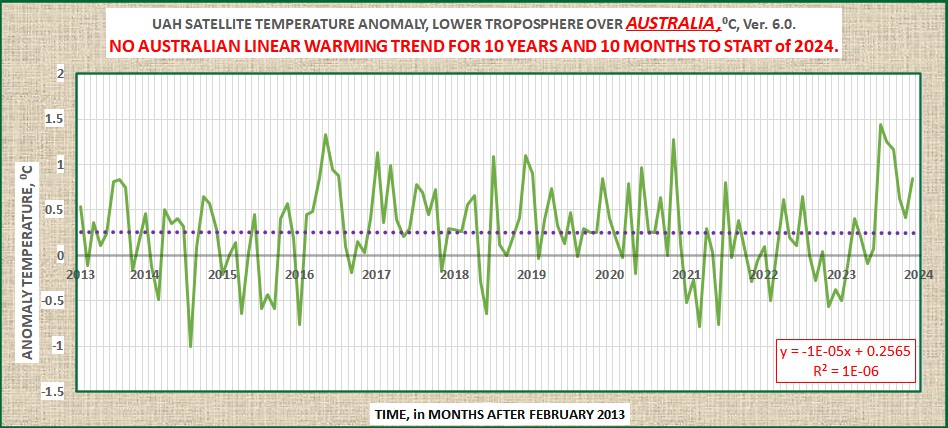
It has long been a weakness of climate research that unfortunate observations are seldom discussed. Fingers in ears, chant La La.
Geoff S
Sherro01:
To see what our climate is ACTUALLY doing, temperatures during all temporary La Nina and El Nino episodes need to be deleted from a temperature data set, and the remaining temperatures plotted.
You will find that temperatures are actually substantially rising
Geoff, I just downloaded the latest UAH MSU data for Australia.
Contrary to your claim, it shows a trend of 0.17°C per decade.
You absolutely cannot trust your eyeball for these kinds of calculations. You have to do the math.
Best regards,
w.
173 years of monthly average CET data here…
https://mynaturaldiary.wordpress.com/2024/01/01/whither-the-weather-2023/
The November data is interesting, showing a rising value continuously since 1900 at much the same trend rate. This is before CO2 effects became noticeable, suggesting other effects are also in play.
Averaged temperatures across a region is no better than across the globe. Still meaningless. Temperature readings from different locations should NOT be averaged. Intensive properties.
It’s not just intensive properties. It’s also the different microclimates. Temps in San Diego are stabilized by the ocean. Ramona, CA, twenty miles away has a vastly different diurnal range. Yet climate science averages the two together with no weighting for the variance of the two temperature profiles.
You just explained why temperature is an intensive property. They shouldn’t be averaged at all, with or without weighting.
What is there about an intensive property such as temperature that should prevent it’s measurement from being averaged?
Say you have two rocks, mass1 and mass2. Mass is an extensive property. I can add the two masses, divide by two and get an average mass. I can then substitute two rocks of the average mass on the scale and get the same exact mass reading as the two original rocks would give on the scale.
Now, I measure the temperature of each rock, temp1 and temp2, an intensive property. I add the temps and divide by two to get an average temperature.
What do you have if you substitute two rocks at the average temperature for the original two? Say one original rock will burn your fingers and the other will freeze your hand. Will either of the substitute rocks burn your fingers or freeze them? If not, then do you have the same thing as the original?
Good question, nail.
To get an average, you add the items together and divide by the number of items. Examples.
Two blocks of steel have masses of 10 kg and 20 kg. Add them together and you get 30 kg. Their total mass is 30 kg. You can verify that by putting both on the scale and taking their weight.
Next, two blocks of steel have temperatures of 10°C and 20°C. Add them together and you get 30°C.
Is their “total temperature” 30°C? Of course not, because you can’t add temperatures—there’s no such thing as a “total temperature” of several objects. If you take their temperature is it 30°C? No way.
w.
There is no doubt that mean annual temperatures have increased in this dataset. This means that the annual minimum temperature has increased. (Data not shown.) Why would the minimum increase but not the maximum? And, if someone has time (right now I do not), it would be interesting to see which seasons of the year show the greatest warming.
Over the most recent 30-years, autumn/fall (Sep-Oct) shows the fastest warming trend in CET (+0.3C per decade). Summer shows the slowest trend, but still warming (+0.1C per decade).
Winter and spring are both +0.2C per decade over the same period.