From the Cliff Mass Weather Blog
Cliff Mass
The poor coverage of snowpack trends in the Seattle Times and other newspapers was very evident today on the front page of our local newspaper (see below).

A story “Winter has arrived, snow not so much” filled the right side of the front page. A reprint of a NY Times article by Mike Baker, this story suggests that the lack of snow was the result of global warming/climate change (see below).

Amazingly, this article neglects the key reason why our snowpack is not doing too well: this is a very strong El Nino year.
This incurious article does not review the trend of mountain snowpack over the past several decades: a crucial test of whether climate change could be blamed.
Just poor journalism. But let’s do the proper analysis in this blog, and you can decide for yourself.
El Nino
We are in a very strong El Nino and such events are highly correlated with warm winter temperatures and poor snowpack over the region. Sea surface temperatures have been about 2C above normal over the past two months (see below).

According to NOAA/NWS, El Nino years are associated with warmer than normal October-November-Decembers (see below for a local climate division)

And snowfall is less than normal over our region for El Nino autumn periods (see below, brown colors)

The warmth and low snowpack over the Northwest during El Nino years are produced by enhanced low pressure over the eastern Pacific and high pressure to the northeast of our region. The observed pattern for November 1-December 27th this year at 500 hPa (about 18,000 ft) is just like that.

El Nino is clearly a major driver of our anomalous warmth and low snowpack, something not mentioned in the article.
But there is another check on the Seattle Times/NY Times climate-change origin of the low snowpack.
If climate change was the origin, there would be a progressive loss of snowpack over the region as the planet warmed.
This is something we can check. Below is a plot of the water content in the NW snowpack on April 1 for the past few decades (1984-2023), courtesy of past Washington State Climatologist, Mark Albright. The linear trendline is also on there (black/brown line).
Lots of ups and downs, but no trend. Thus, climate change is not causing a significant long-term decline in our snowpack.

An independent check on these numbers is to determine when the mountain snowpack has melted out. Clearly, with less snowpack, the snow would melt out sooner. Below is the date of the melt-out at Steven Pass (around 4000 ft).
If anything it has gotten later.

Now don’t get me wrong. The planet is slowly warming. Human emissions are a part of that. And this will contribute to reduced snowpack over the long term. But currently, the impacts of global warming on Northwest snowpack are quite small.
Suggestions that our greatly reduced snowpack this year is due to climate change are clearly false.
It is a shame that the national newspaper on record (the NY Times) and our local paper (the Seattle Times) can’t investigate the situation sufficiently to get the story right.
Their readers are being poorly informed.
____________________________
Before I forget, Happy New Year to all. If anyone missed my ATMS 101 class and would like to take a similar class by an excellent colleague of mind (Professor Greg Hakim), you can take it online or in person during the upcoming quarter. And if you are over 60 you can take it for little cost using the UW Access program
Good article Cliff, thank you. But I disagree on one point. The Earth may be warming slightly, but we don’t understand our planet’s climate or how it changes even remotely enough to know if human activity has anything to do with it, or is it 100% natural. I lean toward the latter.
I agree, enjoyed the article/blog Cliff; and the OND Temperature Distribution graph was very cool.
I think there must be at least -some- anthropogenic causality contributing to the mild to moderate global warming experienced since about 1800. Somewhere between 5% to 50% anthropogenic; perhaps it’s 25%. Not alarming and perhaps actually generally positive…
I’m thankful to have found this website and how it’s help me build a better understanding of some many facets of the climate change issue. More free education for 2024!
I would believe more that humanity was causing cooling (from so2, soot) than warming. And more belief in localized warming (asphalt and concrete, clearing land, draing swamps) than generalized all over warming.
Just because we put CO2 in the air doesn’t mean that the yearly increase affects the climate – water vapour would saturate IR absorption at most wavelengths. And what happens in the, say coming decades when the population levels off and almost everyone enjoins the benefits of fossil fuels – i.e. human emissions level off and the biosphere has a chance to catch up? It already absorbs about half human output and has been doing that for decades even though emissions have increased – seems like the biosphere is a climate change denier and likes all the extra CO2!
We don’t really know if the entire planet is warming, because all we’re presented with are averages. Which, in a global context, is meaningless.
Even if it were meaningful the measurement uncertainty is at least in the units digit and likely in the tens digit – meaning any actual change is completely in the GREAT UNKNOWN.
Well, you might look at some of the known factors that affect the temperature of the Earth and then see how man could possibly influence them. I suggest starting with the sun.
Earth’s Magnetic field.
re: “Earth’s Magnetic field.”
Secondary, follow-on effect to magma/internal fluid movements. What then would be the primary factor influenced? (I think I just named it?)
There is no evidence since the 1970s of top of the atmosphere solar energy changing enough to even round to a 0.1 degree C. change in the global average temperature.
How much solar energy reaches Earth’s surface depends on SO2 and other pollution and daytime clouds.
The energy from the sun is not changing and there is no observed 11 year global average temperature cycle that matches the 11 year sunspot cycle.
30 year trailing average shows you are very misinformed.. as is very often the case.
There has also been large changes in the UV channel, the one that actually warms the oceans.
On top of that there has been a significant reduction in tropical cloud cover.
CERES data also shows the absorbed SW radiation matches temperature rather well.
Solar also matches CET very well
Also in the Arctic. there is a good match between solar and air temperature.
It would be strange if human activity did not have any impact on the climate at all, but that is an Art Student statement anyway. The correct question is not if humans make a difference, but how much difference do they make?
The correct question is why do people make wild guess climate predictions that always claim the climate can only get worse … after the climate has improved for the past 50 years.
Warmer is good
Colder is bad
Plants love more CO2
Agricultural production is up.
I recently heard an expert saying that the climate crisis was TOO LITTLE CO2 in the atmosphere. He suggested plant life is in danger of a mass die off due to the dearth of CO2. what is the minimum level of CO2 needed to sustain healthy plant growth? Does it vary ( I expect) by plant types, terrestrial or oceanic, algae or multicellular, latitude, heat, etc.?
‘what other contributing factors would come into play?
Most climate scientists are artists too
They specialize in BS: predictions of climate doom — just like good science fiction writers would do
Thanks, Leo, for boiling down the issue.
Hell, I make an influence on the micro-climate in my yard depending uopn watering schedule, type of shrubs and grass and, and…. You can see the difference just looking at next house yard left and right.
But globally? Beam me up.
Gums sends…
There is more evidence of manmade causes of the [ost 1975 warming than natural causes
The right answer is we do not know but few people will accept we do not know as the answer to any question
Manmade (AGW) causes of warming since 1975
More CO2 emissions
Fewer SO2 emissions
Economic growth near weather stations
More UHI, even applies to rural weather stations
Land use changes
Biased pro-warming temperature statistics
In my opinion the probability that the warming since 1975 was 100% natural is near zero.
The fact that the warming matches what CO2 alone would have caused is not likely to be a coincidence (based on lb CO2 and water vapor data in the HITRAN database)
The fact that Antarctica is not warming can only be explained by more CO2
The fact that the Arctic is only melting in the winter can not be explained by more solar energy reaching the surface of the Arctic
The fact that TMIN is increasing faster than TMAX is a symptom of an increased greenhouse effect, which can only be caused by more CO2 or more night clouds.
The Honest Climate Science and Energy Blog
The Arctic is melting in Winter?
The Arctic is not melting at all. Sea ice breakup is caused by high winds and storm action, most often in February but can occur from Jan-April. Richard Greene, as usual, doesn’t know what he’s talking about.
“The fact that the warming matches what CO2 alone would have caused is not likely to be a coincidence”
You were doing ok until this griff-like comment !
It is a very stupid comment unbacked by any actual science.
Did you know that current Arctic levels are basically at the top of the last 20 years?
Your comment on Arctic melting in winter is another attempted griff-emulation.
Even though CO2 continues to increase, Arctic sea ice has levelled of (at a level far higher than the Holocene norm)
There goes your short-term correlation with CO2.. totally busted.
“The fact that the Arctic is only melting in the winter”
Seriously.. did you really write that.. WOW
Winter is when the Arctic re-freezes , you moron !!
“The fact that the warming matches what CO2 alone would have caused is not likely to be a coincidence”
Another totally ANTI-SCIENCE garbage statement
Did you know that Ocean seismic activity is a FAR BETTER correlation to atmospheric temperature than CO2 is..
.. and at least there is a rational scientific reason for the correlation.
“The fact that Antarctica is not warming can only be explained by more CO2″
Now you are really heading off into griff nonsense territory !!
That is probably the most idiotic statement I have ever seen, even from dickie-griff. !
Man’s impact is certainly insignificant if any at all
How many consecutive years have low snowpack conditions been commonplace? If it’s only one or two, aren’t the alarmists, as usual, hitting the panic button prematurely? During the 1930s, didn’t drought conditions prevail over the American Central Plains and Canadian Prairie Provinces for about seven years and didn’t those conditions revert to normal by the end of the decade? No one claimed climate change had anything to do with that temporary departure from the norm at that time; but if that were to occur today, the panic-mongerers would be guaranteeing that this was incontrovertible proof of human-induced climate change. So bring on new carbon taxes and restrictions. As usual the best response to the permanent low snowpack claim would be to ignore it
In December 1939, there were days in the upper 60s in Minnesota.
We are, what, 12 days into Winter? And the climate enthusiasts are bemoaning a lack of snowpack already. Wait until the end of Winter and look back over the season to determine what the conditions were. I see no point really in pre-judging conditions that may change dramatically.
“Wait until the end of Winter”
The climate change alarmists are jumping the gun, as usual.
Weather attribution science is pseudoscience. It is personal opinions about the weather, pretending to be facts.
So was last year’s near-record snowpack a sign of the coming ice age?
You not allowed to talk about facts that disprove the narrative – facts are the new lies. Truth is a climate change denier.
You see there is your proof of climate change.
In northwestern Ontario, large parts of nw MN and Wisconsin, a succession of deep snow winters since 2014 has resulted in the collapse of the white-tailed deer population. There are other factors as well, but the number one reason is long, snowy winters.
Huge snow in other NH countries !
Just variable WEATHER.
Yes, look here:
https://www.washingtontimes.com/news/2023/dec/31/seoul-south-korea-records-most-snowfall-on-single-/
South Korea is getting the same arctic air that was freezing China.
this page shows the real history of the snow pack and what they left out.
There might be a story tip in this.
This is climate denialism at its best. As if there has never been warming before CO2 because the traction this claptrap has.
The Northern Hemisphere is warming. The Southern Ocean and Antarctica are already cooling. There is no “global warming”. The place and time of most warming is the Greenland plateau in January – going up at 9C/century – way faster than anywhere else.
When you can explain how the last interglacial ended then you will have a clue of what is happening now.
Do you even know how the precession cycle shifts peak solar intensity?
There are two important trends – NH September ocean surface temperature is rapidly increasing and fall snow extent across the NH is increasing:
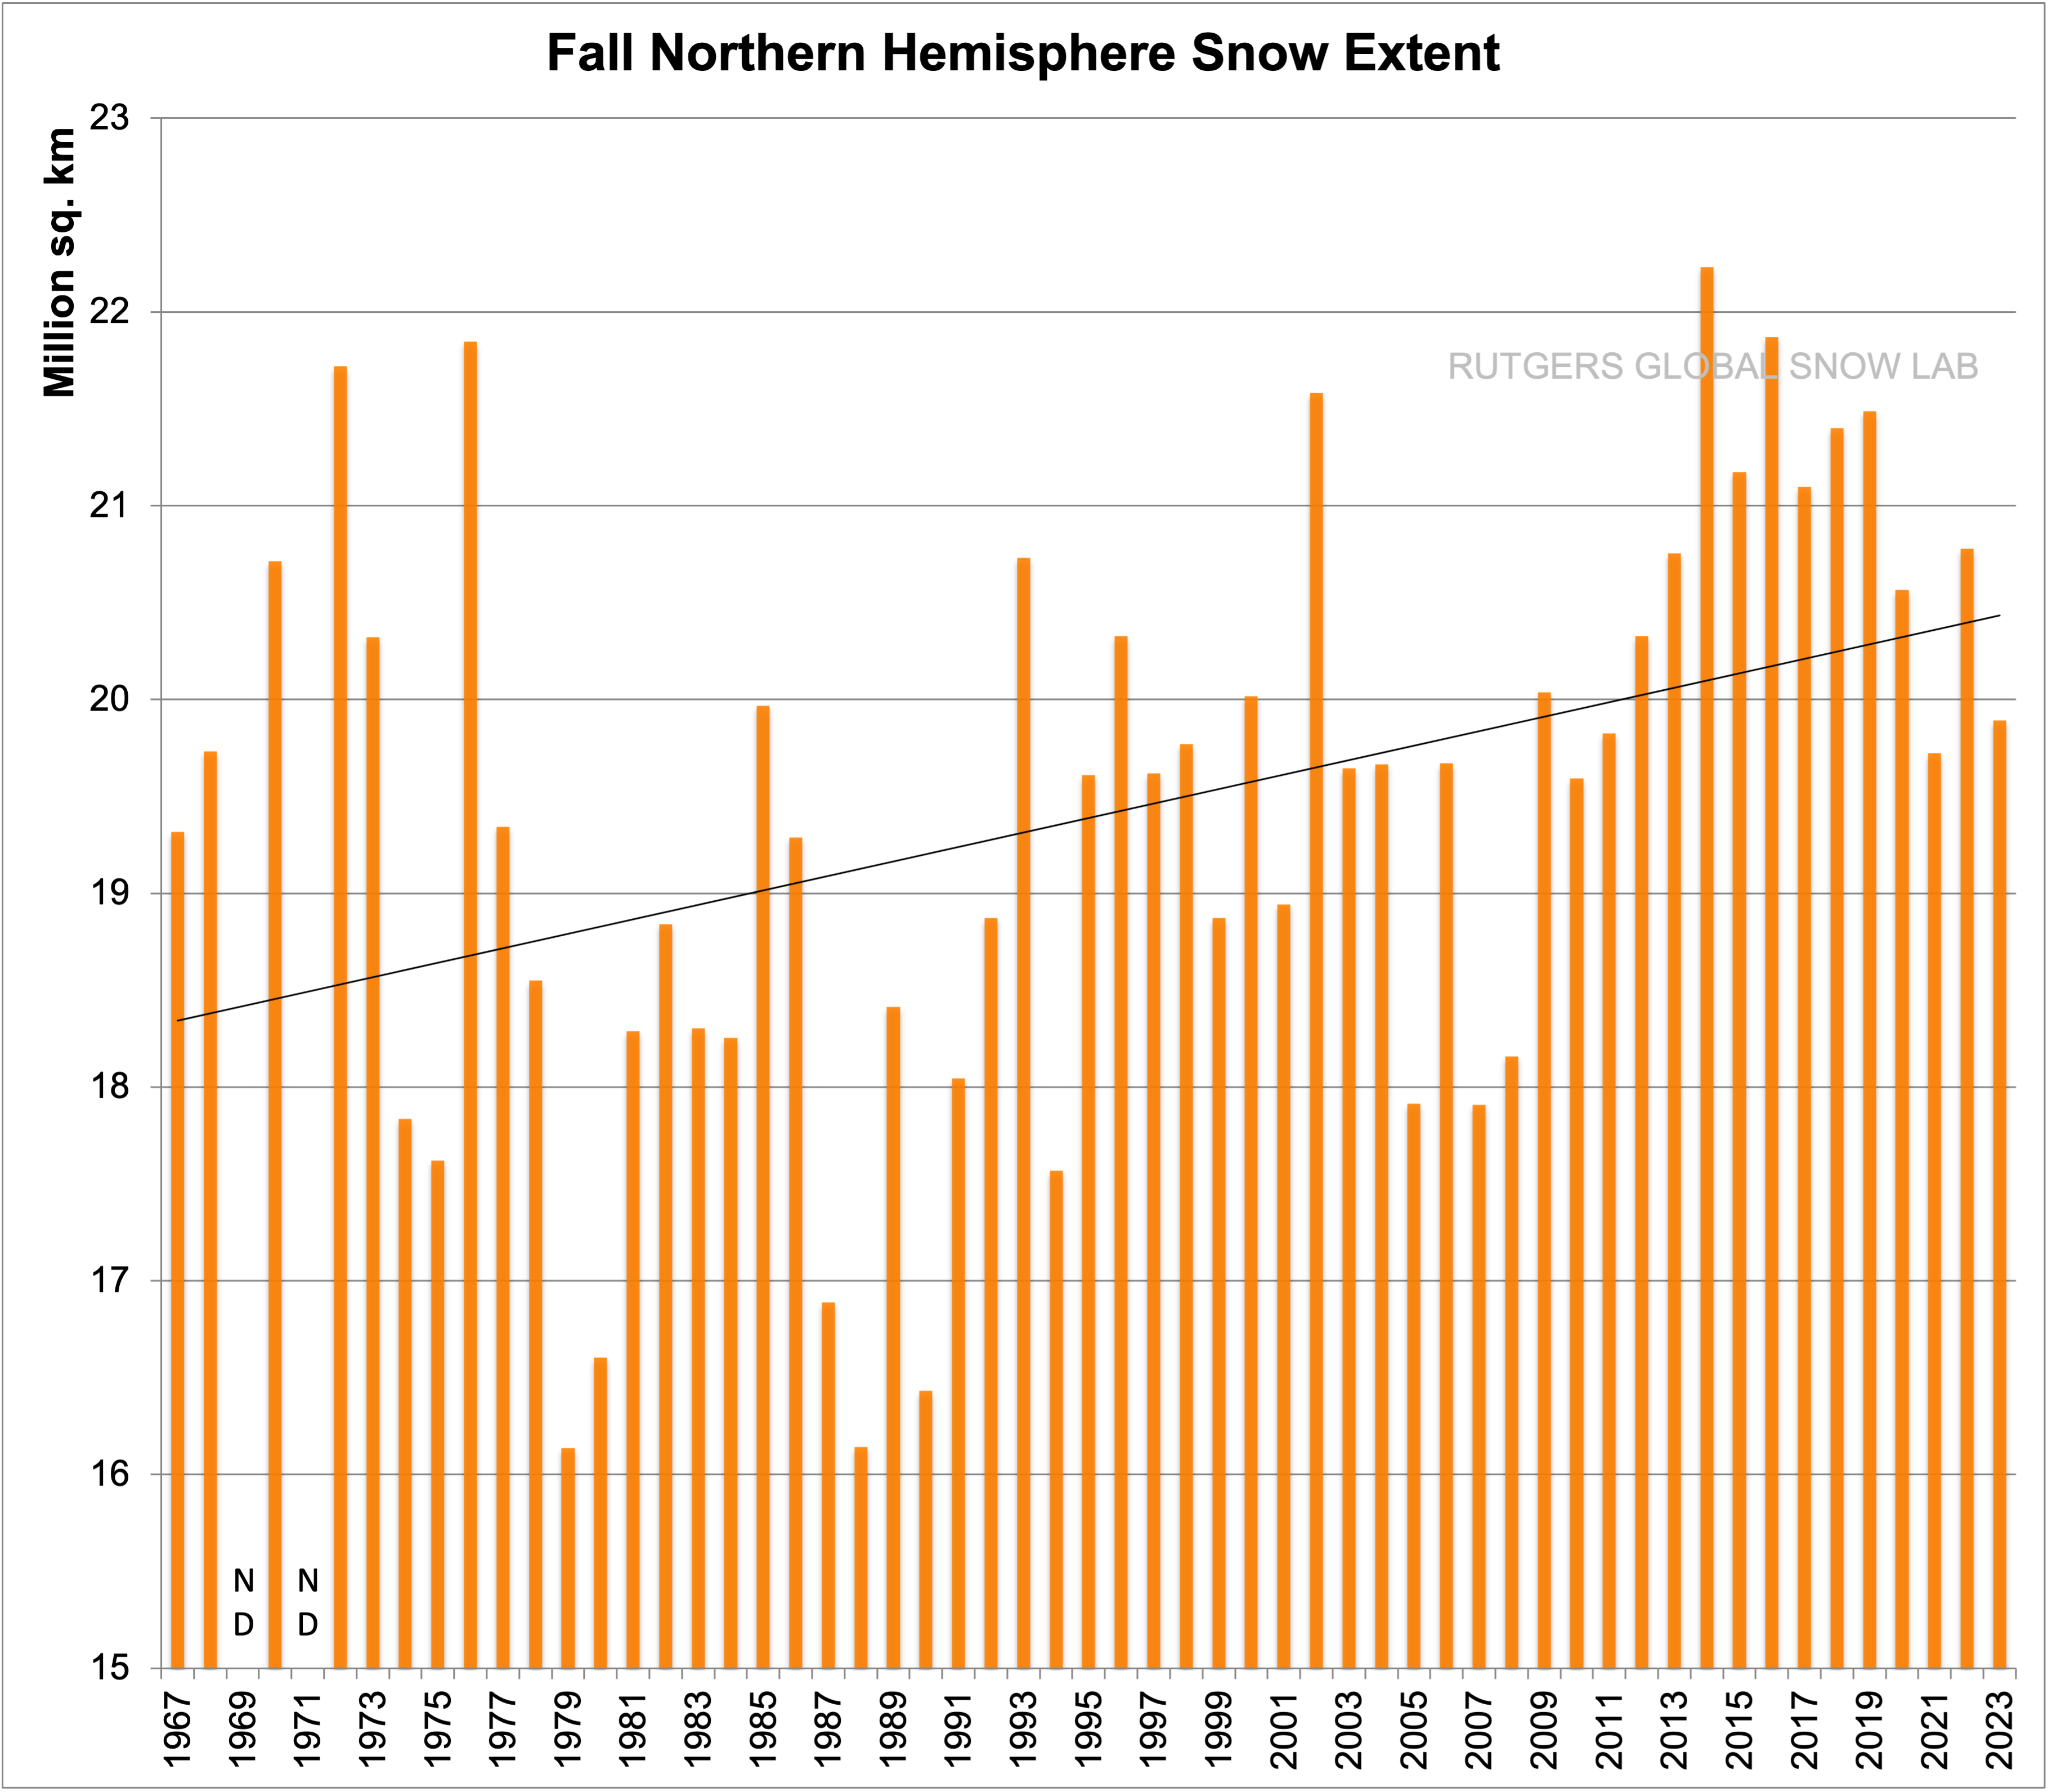
These two trends are linked for obvious reasons.
Once you understand that liberating 1 tonne of water from an ocean and depositing it on land requires equivalent heat to burning 100kg of coal going into the ocean surface you realise that glaciation is an energy intensive process that depends on oceans getting warm. Think about that before offering silly throwaway lines about CO2 being the temperature control knob..
The Fall chart is data mining BS
Snow is mainly in the winter not in the Fall
And Spring snow cover is falling
The annual snow cover has been steady
for almost two decades
You have cherry picked a Fall chart to confuse people
You are a liar.
I will post an honest chart … again
Winter and fall increasing
Why do you want snow is Spring.. talk about griff-like cherry-picking
That is when you want it to melt !
We can see the very cold period when the climate stooges were panicking about a new ice age. Don’t be a climate stooge. !
There is no unusual low snowpack. In contrary winter season in Northern hemisphere was starting with an unusual high snowpack. Now it’s well within the Standard Deviation compared to 1982-2012: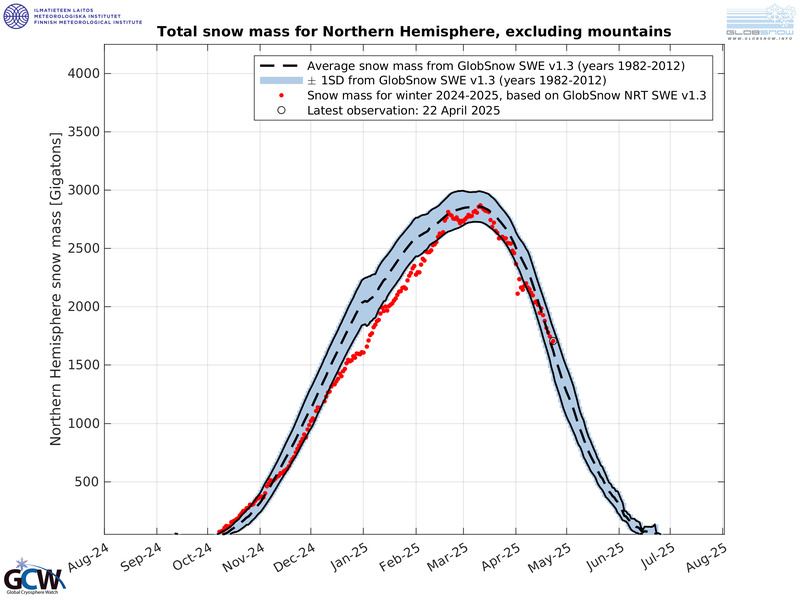
“Enough Volume loss to fill Lake Mead”
Um.. Lake Mead is already pretty much full !!!
Lake Mead Water Level (uslakes.info)
Oops.. didn’t have the other years turned on.
My bad !
Well, at least the water level went UP by about 20ft over the course of 2023 – every other year in the past 5 it was going the other way – if this climate change drought keeps up for another decade Lake Mead will indeed be full!
Lake Meade is far from full.
It is 160 feet below full pool.
But this has more to do with tens of millions of people moving to the desert SW than anything else.
But it will be overflowing again, probably soon.
Maybe by this Summer.
The notion that there will never again be excessive rain in that quadrant of North America is jackass stupid.
Meanwhile (in Australia) the BOM and the MSM have been uber-hyping this year’s El Nino – predicting a looonnnng hot, dry and bushfire filled Summer.
Despite the very late declaration of EL Nino – the forecast LONG, HOT, DRY has not only failed to appear – but much of Australia’s Eastern Seaboard has been subjected to intense drenching rain and flooding over the last 2 months.
These ‘climate experts’ are now trying to tell us (the Proles) that not only is this intense, months long, rain ‘completely normal’ during an El Nino event – but that this is a sure sign of advanced GLOBAL WARMING.
All I have to say, from the Hunter Valley, is
Would someone please stop the grass growing so fast.
This mowing is getting past the ridiculous stage.
The so called “climate experts” will FABRICATE and lie about basically anything and everything to try to push their moronic scam.
I just wish more people would wake the **** up to their blatant and petty anti-science con-job.
Take a look at the NOAA ENSO forecast for an exceptionally short El Niño vanished by early autumn 2024. Ozzi can relax
Probably going to vanish before that – the NOAA forecast appears to be an outlier.
Is the slight drop in UAH a sign that the El Nino warming peak has passed.
Time will tell.
Will this EL Nino add a small step change to atmospheric warming like the 1998 and 2016 El Ninos did?
Time will tell.
One thing you can be absolutely certain of, is that the climate scammers will use this El Nino as a CO2-warming prop, despite there being no-evidence it has any CO2 causation.
They will draw monkey type lines using it to show dumb linear trends, and try all sorts of other anti-science nonsense to push their fakery and their anti-human agenda.
Meanwhile in the French Alps it’s a glorious new years day…
That must be an optical illusion. The Alps are melting away.
I know it is because, can all those jackasses be lying about everything, every day, all the time, for year after year?
Perhaps someone could dig out the Guardian articles about the imminent end of the Alpine ski industry. We all need a laugh.
Grauniad 26th December 2023
‘Downhill from here? Ski industry faces existential crisis as the world heats up’
Concentrating on the Alps it says “The most recent scientific report has added to fears the industry faces an existential threat……the study warned that if the world heated up by 2C above pre-industrial temperatures, 53% of the 28 European resorts examined would be at very high risk of scarce snow cover”
And, of course, just like everywhere in the world
“Temperatures in the Alps are rising at more than twice the global average”
So many wrongs.. (but of course our author is hidebound and does not want to find himself tied to a stake while shrieking & maniacal ‘people’ dance around him throwing buckets of petrol)
This is maybe gonna be a 2-parter, one to explain the wrong and another to explain what is happening on the ground
Wrong #1
Is of course the Low Pass Filter, which throws away the very thing you are looking for
i.e. Change
Low pass filters destroy change, they mash it down to a low level, and, as low as you like depending on your ‘cut off frequency‘
Which is as everyone knows and according to Fourier, (and his eponymous transforms) the start and end points of the chosen data.
aka: Cherry Picking and when you tweak the start/ends, = Confirmation Bias
So, if you want to look for ‘change’, as in ‘Climate Change’ and the ‘extremes’ that CC™ is supposedly creating, you go looking for ‘accelerations’
i.e. Acceleration is = Change
To look for acceleration (change) in your data, you execute a High Pass Filter
IOW: You do a ‘differentiation‘ (with respect to time) instead of an ‘integration‘ which is what low pass filters do.
(There is Bad News incoming, stop reading now if you are an appeaser or denier)
What I did was to ‘eyeball’ the snowpack graph and digitize it as best I could to (just) integer values.
Then to do a basic time differential, take the absolute value of the difference from one year to the next – and plot it.
In Excel: =ABS(Year(n) – Year(n-1))
[your image was translated into thousands of characters of ascii text, so I deleted –mod]
As scare stories go the piece about the Boeing 737 Max was much more impressive.
Holy cow, what happened there?
Lets try again and CTM, please delete that garbage while its in moderation.
(I think I pasted the image instead of some words)
So many wrongs.. (but of course our author is hidebound and does not want to find himself tied to a stake while shrieking & maniacal ‘people’ dance around him throwing buckets of petrol)
This is maybe gonna be a 2-parter, one to explain the wrong and another to explain what is happening on the ground
Wrong #1
Is of course the Low Pass Filter, which throws away the very thing you are looking for
i.e. Change
Low pass filters destroy change, they mash it down to a low level, and, as low as you like depending on your ‘cut off frequency’
Which is as everyone knows and according to Fourier, (and his eponymous transforms) the start and end points of the chosen data.
aka: Cherry Picking and when you tweak the start/ends, = Confirmation Bias
So, if you want to look for ‘change’, as in ‘Climate Change’ and the ‘extremes’ that CC™ is supposedly creating, you go looking for ‘accelerations’
i.e. Acceleration is = Change
To look for acceleration (change) in your data, you execute a High Pass Filter
IOW: You do a ‘differentiation’ (with respect to time) instead of an ‘integration’ which is what low pass filters do.
(There is Bad News incoming, stop reading now if you are an appeaser or denier)
What I did was to ‘eyeball’ the snowpack graph and digitize it as best I could to (just) integer values.
Then to do a basic time differential, take the absolute value of the difference from one year to the next – and plot it.
In Excel: =ABS(Year(n) – Year(n-1))
What you see is that ‘1st time differential’ of the snowpack graph
Apart from where everything stalls in 2017 and onwards, that graph is skyrocketing and THERE is your climate change
i.e. ‘Something’ (is it = Climate?) is changing the amount of the amount of snow = the changes in the amount of snow are getting bigger = climate is getting more extreme.
(That was NOT a typo)
Because: If climate was static and not changing, that line would have some value, it could have any value it doesn’t matter, BUT, it would be a horizontal flat line and it patently is not
If you want some real brain-ache, that graph obviously might have a trend-line and calculating it as is, (using all the data(’84 thro ’23) the trend-line has and actual value and is as flat as a pancake.
Telling the alert reader that: Climate is changing and at a constant rate
(If of course you want to use snowpack as an indicator of Climate)
What is really going on and explains the complete non-explanation guff & waffle about Old Nono
If you want to invoke El Nino you must explain Nino himself and not just with some vague arm waving
What’s happening is in the attached and is it just soooo beautiful’
You see I even zoomed it out to explain the freezing cold still ongoing in China (beyond and west of Beijing)
It’s dead simple and depends on the functioning of hot air balloons
And there is your climate change, the rain-bearing and snow creating systems were blocked by the resistant ridge high pressure system, it being created by the desert it is sitting upon while doing all it can to reinforce that desert
Look at that picture and (mind’s eye) compare to the UK and Northern Europe right now.
i.e. Under a severe rain weather warning here in the south east of England at this very moment
Because the UK is NOT = a desert, the storms are riding over the top of us and dumping huge amounts of rain.
They are in fact being steered and reinforced by the desert that continental Europe now is
Next: Apply that high pass filter technique (from my previous post) to rainfall data – count the number of days with no rain compared the number when it doesn’t rain at all
THAT is how to calculate if a drought is ongoing or not.
I say the exact same applies as does the snowpack calculation, you will see a rising trend in the number of dry days and an increasing variability in the quantity of rain that falls on any given day
Yes, that is = Soil Erosion doing that
Soil erosion is = the increasing dryness of the continental landmasses; it is changing the climate and you’ve just read how and why
See the purple temps in China and the frigid temps over western North America
See also the 1014mb isobar (automatically emboldened) – doesn’t it so perfectly split east from west USA?
See how it’s dry on the high side and rainy/wet on the low side
That data is crying out for a non-linear regression.
Could Cliff Mass be another El Nino Nut along with Joe Bastardi and David Wojick?
The El Nino Nuts talk about the effects of El Ninos and completely forgets about the effects of La Ninas. Over the long term this ENSO cycle is temperature neutral
To the CO2 Nuts:
Mass says: “The planet is slowly warming. Human emissions are a part of that.”
How dare that man claim CO2 causes global warming — all the CO2 Nuts say that is just speculation!
How about this explanation why global warming might cause no significant change in snow cover (see chart below)
Atmosphere gets warmer
Warmer atmosphere holds more water vapor
More water vapor leads to more clouds
More clouds lead to more precipitation
A smaller percentage of that precipitation is snow,
but the extra precipitation adds enough snow cover
to offset the snow cover loss from global warming.
Richard, you are making it easier and easier for me to ignore absolutely everything you write. Utter garbage from start to finish.
He actually says “some” stuff which is basically correct..
… but it is littered with lukewarmer garbage science.
Rabid DENIAL of El Nino, puts you well and truly in the “Simon the simpleton” category !!
Then the evidence-free suppository of CO2 causing warming.. bizarre !!
Things are looking pretty darn STUPID in dickie-griff land. !!
“Over the long term this ENSO cycle is temperature neutral”
Admitting ignorance of what El Nino event is and does…
Not a good look, even for a small-brained lukewarmer.
Can see the period of COLD that gave us the “new ice age scare”
Then nothing..
No evidence of anything happening since 1995.. despite all the massive CO2 increase.
Your correlation nonsense has run out of steam.
Well, since it is only second day of the year is it not a bit early to tell?
Not a tremor on the sawtoothed climb of the Keeling Curve since COP1 in 1995, not even during the COVID deindustrialisation. It’s natural. And btw take a look at NOAA ‘s forecast for this El Niño. 50% neutral or La Niña by early autumn 2024. El Niño gone. Short, eh? Another 30 month La Niña upcoming? Break out the woolies
It will be interesting to see if, once it all settles down, this very major El Nino leads to another small step in atmospheric warming like the 1998, and 2016 El Ninos did.
Those steps are actually the only atmospheric warming in the satellite data.
No evidence of any human-caused or CO2-caused warming whatsoever.
The cities, where 90 percent of the weather stations are, are growing warmer because asphalt and concrete hold heat. The rural areas, not so much.
The planet is getting warmer? Since when? I think Cliff should be more careful in making such statements. The data supports the statement that the planet has been getting colder since the Holocene Optimum 10k to 5k years ago. Lots of the Earth’s surface has gotten colder over the last 50 years. Blanket statements like Cliff made are poorly defined.
Yep, the current warming is a minor and very beneficial blip after the coldest period in 10,000 years.
Cliff’s insight is always refreshing to hear. Last year we went from a La Nina winter to summer without much of any spring at all here in the Northern Rockies. Did the Hunga Tonga eruption have
any impact on these weather deviations? Low snow pack is always a concern for us in this
region but as an ol timer farmer from the homestead days told me years ago, it’s not the snow
but the spring/summer rains that make the difference moisture wise.
I’ve seen similar years to this in the past
that worked out well due to late Feburary/March spring snow storms. Wishing all a healthy and
happy new year!!
Yes, there is no doubt that the HT water vapor is still in effect in both hemispheres.
(Lat. vs Date) Altitude: 32 Km.
mls_h2o_qbo_lat_75S-75N_10hPa.png (1926×1394) (nasa.gov)
Climate is a one-season average of weather.
Title is newspeak. It should be “Is the high snow-free areas this year a sign of global climate improving?”
YES. [“The children aren’t going to know what snow is.”]
NO. [“Heavier snowfall is ‘consistent with global warming. “]
They have all the bases covered.
Whatever happens, it’s our fault. Cause we’ve always been in control of the weather, right?!
🙄
“Their readers are being poorly informed.”
Their readers are being intentionally misinformed.
Did great right up until the end.
“Now don’t get me wrong. The planet is slowly warming. Human emissions are a part of that. And this will contribute to reduced snowpack over the long term”.
Pure speculation based on hints and assumptions and wishes.
Besides common sense says more moisture in the air and on balance more snow.
Before that, data and science.