From Dr Roy Spencer’s Global Warming Blog
by Roy W. Spencer, Ph. D.
With the approaching El Nino superimposed upon a long-term warming trend, many high temperature records were established in September, 2023.
The Version 6 global average lower tropospheric temperature (LT) anomaly for September, 2023 was +0.90 deg. C departure from the 1991-2020 mean. This is above the August 2023 anomaly of +0.70 deg. C, and establishes a new monthly high temperature record since satellite temperature monitoring began in December, 1978.
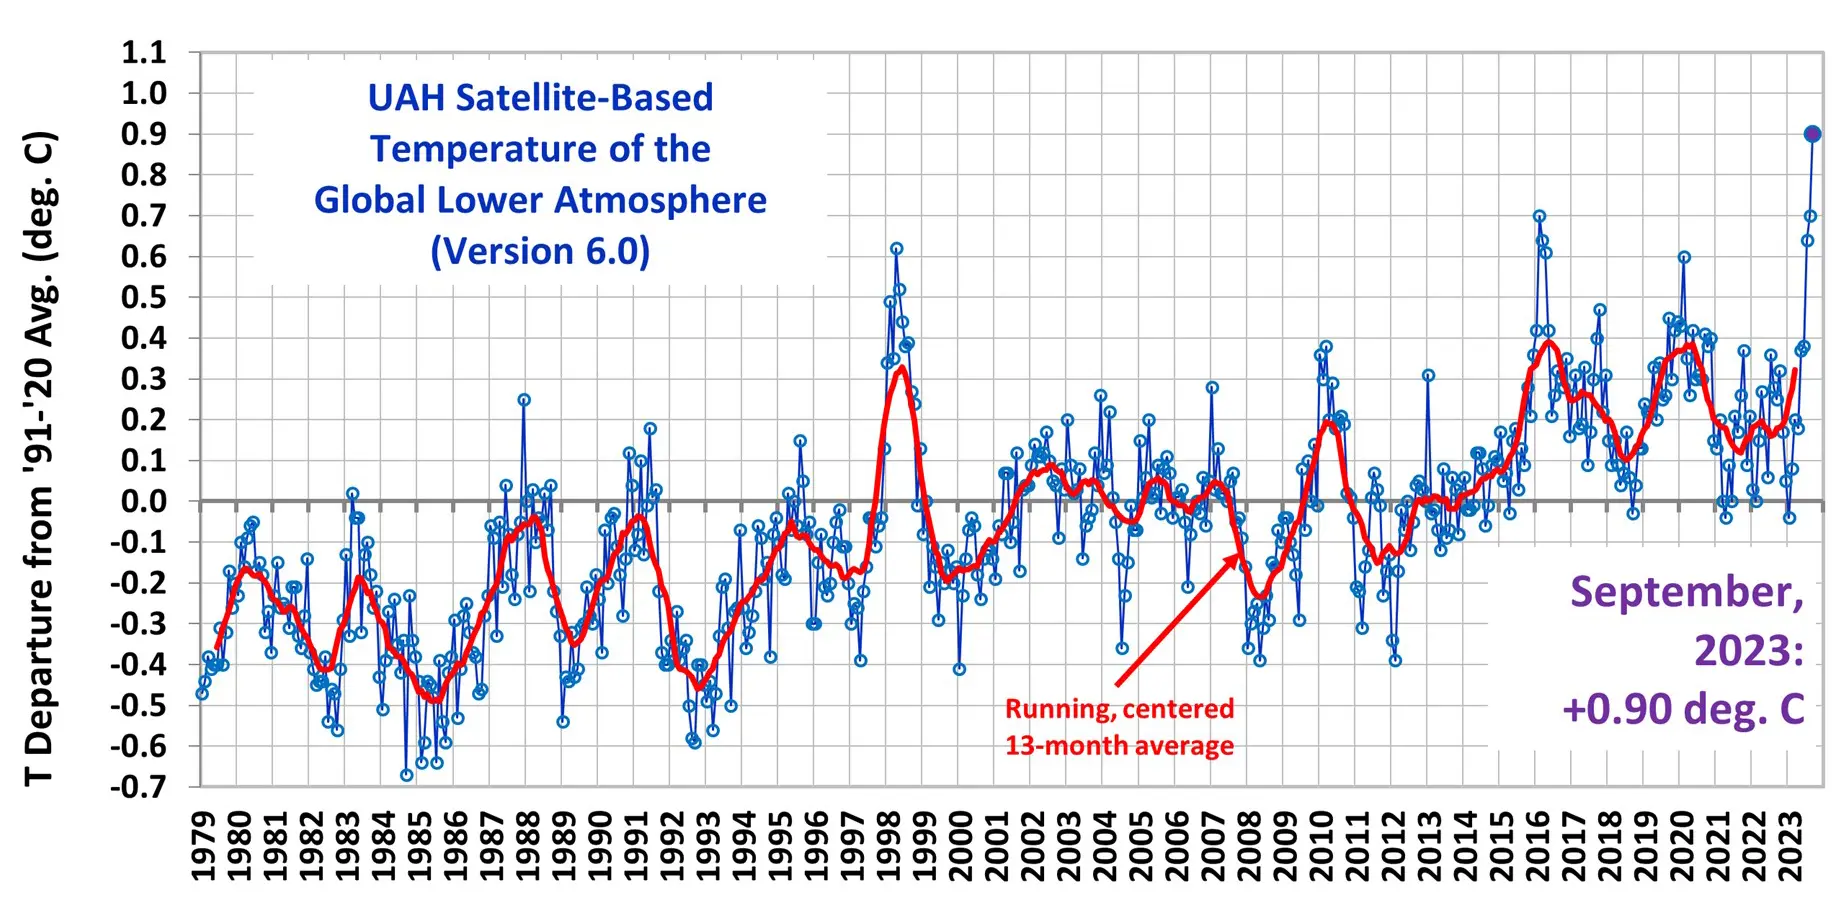
The linear warming trend since January, 1979 still stands at +0.14 C/decade (+0.12 C/decade over the global-averaged oceans, and +0.19 C/decade over global-averaged land).
Regional High Temperature Records for September, 2023
From our global gridpoint dataset generated every month, there are 27 regional averages we routinely monitor. So many of these regions saw record high temperature anomaly values (departures from seasonal norms) in September, 2023 that it’s easier to just list all of the regions and show how September ranked out of the 538 month satellite record:
Globe: #1
Global land: #1
Global ocean: #1
N. Hemisphere: #2
N. Hemisphere land: #1
N. Hemisphere ocean: #4
S. Hemisphere: #1
S. Hemisphere land: #1
S. Hemisphere ocean: #1
Tropics: #6
Tropical land: #2
Tropical ocean: #8
N. Extratropics: #2
N. Extratropical land: #1
N. Extratropical ocean: #4
S. Extratropics: #1
S. Extratropical land: #1
S. Extratropical ocean: #1
Arctic: #11
Arctic land: 7th
Arctic ocean: 65th
Antarctic: 15th
Antarctic land: 26th
Antarctic ocean: 14th
USA48: 144th
USA49: 148th
Australia: 12th
The full UAH Global Temperature Report, along with the LT global gridpoint anomaly image for September, 2023 and a more detailed analysis by John Christy, should be available within the next several days here.
Lower troposphere:
http://vortex.nsstc.uah.edu/data/msu/v6.0/tlt/uahncdc_lt_6.0.txt
Middle troposphere:
http://vortex.nsstc.uah.edu/data/msu/v6.0/tmt/uahncdc_mt_6.0.txt
Tropopause:
http://vortex.nsstc.uah.edu/data/msu/v6.0/ttp/uahncdc_tp_6.0.txt
Lower Stratosphere:
http://vortex.nsstc.uah.edu/data/msu/v6.0/tls/uahncdc_ls_6.0.txt
This is 0.45C warmer than the previous warmest September set in 2019, and is 0.63C warmer than September 1998.
Of the 10 warmest Septembers, 6 have occurred in the last 8 years.
For the first 9 months of 2023 the average anomaly is 0.38C. This is only 0.01C below the all time annual record of 2016.
The next 3 months need to average around 0.43C for 2023 to be warmer than 2016, which would be quite remarkable given how average the first few months were.
Excellent!
On average, the planet is definitely too cold.
Outside of the tropics, it is too cold to live in during the winter without lots of technology to keep warm.
Let me know when the lobsters are ready.
The Earth is still in a 2.56 million-year ice age in a cold interglacial period that alternates with very cold glacial periods. https://en.wikipedia.org/wiki/Quaternary_glaciation
Outside of the tropics people still need to wear warm clothes and shoes, live in warmed houses, use warmed transportation, and work in warmed workplaces most of the year.
The Cenozoic Ice Age began 34 million years ago, when Antarctic ice sheets formed.
The Late Cenozoic Ice Age (LCIA) began ~33.8 mya, when permanent year-around ice first appeared somewhere on Antarctica.
But it took 6 million years (~28mya) for the East Antarctic Ice Sheet to begin to form, and another 14 MY to reach it’s full extent.
In other words, The onset of the LCIA is considered to have started with the onset permanent ice. It took quite a long time before an entire continent-spanning ice sheet to form and far longer for it to reach it’s current extent.
It was not until about 2.6 mya that the northern hemisphere became cold enough for permanent ice to begin to form and get extensive enough for it to have a separate geological era named, the Quaternary. The Quaternary Glaciation is part of the Lare Cenozoic Ice Age. This period is more commonly called the Pleistocene, and this more intensely cold period of the LCIA alternately referred to as the Pleistocene Glaciation.
It should also be noted that most of these dates and events are the subject of at least some amount of controversy or disagreement.
If different criteria are selected, or new evidence comes to light, opinions about dates and timing of specific events could always change either a lot or a little.
More recent events are probably less likely to need to be revised much.
To sum it up, the LCIA began about 33-35 mya, and at that time only involved the southern hemisphere. It took tens of millions of years for all of antarctica to become covered in an ice sheet. For the first bunch of millions of years, the ice was only in the highlands and mountain ranges. Some sources say the defining event that marks the onset of the LCIA is the land ice reaching all the way to the ocean, thus depositing glacial erosional debris onto the sea floor.
It was not until far more recently, that large sheets of permanent ice first formed in the northern hemisphere. It is fairly uncertain how much ice formed precisely where and exactly when, but by about 2.58 mya, there were extensive permanent ice sheets in several parts of the northern hemisphere, and the Quaternary Glaciation is said to have commenced at that time.
Therefore, the Quaternary Glaciation is part of the Late Cenozoic Ice Age.
Note that the onset of this Ice Age occurred when CO2 levels were at 750ppm.
The primary factor seems to be the opening up of the Drake Passage, allowing the circumpolar current to become established around Antarctica.
As the ocean got ever colder, it absorbed ever more CO2, and by 20,000 years ago, most complex life was very nearly wiped out on our planet due to CO2 starvation.
Then about 30 years ago, the era of Global Warming Alarmism™ commenced, and a doomsday apocalypse cult took over entire branches of the scientific and academic establishment. And this time, it was declared that all of the factors that had previously caused the temperature patterns of the Earth to fluctuate on numerous time scales, had ceased to operate, and all variations are now caused solely by The Sins of Man. As such, Climate Nirvana is now on hold due to the intransigence of those who doubt this humongous crock of steaming malarkey, and the promised state of Climate Bliss is presently on hold, awaiting the Re-education of the last of the Deniers, a stalwart gaggle of folks who insist on clinging stubbornly to evidenced-based science and a dogged adherence to the principles of the Scientific Method, in the forlorn hope that humanity may yet avoid the eradication of industrial civilization, and a rapid descent into a new and very awful stone age, the onset of which will be marked by the presence of billions of human corpses strewn about the planet.
That is really a non sequitur. With any time-series with a positive trend, one can expect most of the highest values will be the most recent ones. That is almost the definition of a positive trend.
Excellent news!
Far fewer people might die in northern hemisphere winters.
“Far fewer people might die in northern hemisphere winters.”
Lots of assumptions there.
No, cold kills. Add in green energy it will be assured.
Lots more assumptions in the concept that the world will be a worse place if it’s warmer.
All demonstrably untrue as the world has been warmer in mankind’s history with far better outcomes than when it is colder.
If it gets warmer, winters get less severe, even a climate scientist should be able to figure that out.
That’s one of the assumptions. Yes.
So, less cold deaths.
Well done bellboy.. you got there !!
Another assumption.
Another admission.. Well done.
Maybe. Maybe not. And it may depend on how you define “severe”. Ceterus Paribus it snows more at say -5 C then it does at -10 C because the atmosphere holds more water vapor at higher temperatures. Or if the warming results in the quasi resonant amplification of planetary waves then you you might expect more winter storms. So if “severe” is more snow or more winter storms then your assumption may not hold at least until it warms enough to cross 0 C.
Cold kills between 7 & 10 times as many people than heat, certainly at the latitudes of Northern Europe, even in the U.K. where our winters are tempered by the Gulf Stream. We are a still a predominantly tropical species, despite having Neanderthal genes in Europe and other homo subspecies genes elsewhere.
“With any time-series with a positive trend, one can expect most of the highest values will be the most recent ones.”
Then why are you claiming it’s a non sequitur?
“That is almost the definition of a positive trend.”
Well, I’d say the definition of a warming trend is one where the trend is statistically significant and positive. That can easily be seen over the history of satellite data, but many here would sooner focus on the last few years and claim that there is no warming trend.
I’m not sure where you hair-on-fire alarmists get the idea that anybody is denying a mild warming trend.
The question is why you don’t understand that it’s a GOOD THING?
There is NO CLIMATE EMERGENCY!
“I’m not sure where you hair-on-fire alarmists get the idea that anybody is denying a mild warming trend.”
Probably from all the people who either deny it or try to persuade others that it isn’t happening. The focusing on every cherry picked pause or down turn. The direct claims it isn’t happening. The attempts to discredit any temperature measurement that shows warming. The focusing on every supposed record cold event as evidence that there is no warming. The claims that every record is fake. The constant claims that it was a lot hotter during the 1930s.
“The question is why you don’t understand that it’s a GOOD THING?”
Possibly because rather than providing proof that it will be a good thing – you resort to shouting, and dumb insults (hair-on-fire alarmist). Personally I couldn’t tell you how much warming will be a net “good thing” and how much a net “bad thing”. I would just sooner not take the risk.
If wishes were horses, then beggars would ride, Bellman.
Even if fossil fuel emissions do explain the entire modern warm period, and even if that warming is eventually going to have some downside despite ever-increasing crop yields, dramatically lower deaths from extreme weather events, fewer wildfire acres burned…there is no practical or moral alternative to adaptation.
Forcing the whole world back to 1600s living standards and letting billions starve won’t even change things much. There isn’t a magical solution that allows the West to maintain our standard of living and allows the third world to rise while not using fossil fuels.
There’s a far greater risk that unreliable energy will cause famine and death than that any conceivable warming would harm us.
This is a move towards phase 2 of denial: ‘OK, you were right about warming, but it’s good for us.’
The next phase (in case I’m not here for it) is: ‘OK, it did warm and it was bad for us, but there’s nothing we can do about it.’
The final phase…?
The first phase would be you producing evidence of human causation.
Second phase would be explaining just how much warmer it must have been for trees to have grown where they are now being uncovered by slowly retreating glaciers.
Until; then, you are just yabbering empty, meaningless platitudes.
The earth has greened over 10% since the 80’s. Something the climate alarmists ignore because, 1) they can’t explain it and 2) it undercuts their alarmism. More green *is* good. Who knows if it is because of warming or more CO2 fertilization or a combination of the two. It’s just certain that it is happening.
Freeman Dyson’s main criticism of the climate models is that they are not holistic at all. They simply do not try to assess the total consequences of any climate change. They are nothing more than rationalizations for use by Catastrophic Anthropogenic Global Warming cultists, emphasis on “Catastrophic”. There’ll be no Phase 2 for them – just a continuation of Phase 1 “end of the world” prophecies accompanied at ever growing loudness.
Eventually all their arguments go away….
“Eventually all their arguments go away….”
From something that ZERO arguments to start with
That is quite ironic. !
Can you say “Hunga Tonga”?
What unusual event happened before we got all these record temperatures this summer?
>> This is a move towards phase 2
>>but it’s good for us.’
Absolutely, not only fewer deaths through cold, but also lots of global greening from the additional CO2 in the last decades!
>> denial
Yeah.. you should not deny that! Or put valid informed skeptics with sound criticism in the corner with holocaust deniers that makes you look very weak.. ever heard of the Nazi club? You try to swing it, babe!
>>‘OK, you were right about warming
Not even close! The argument that the alarmists of the past were warning using facts is laughable.
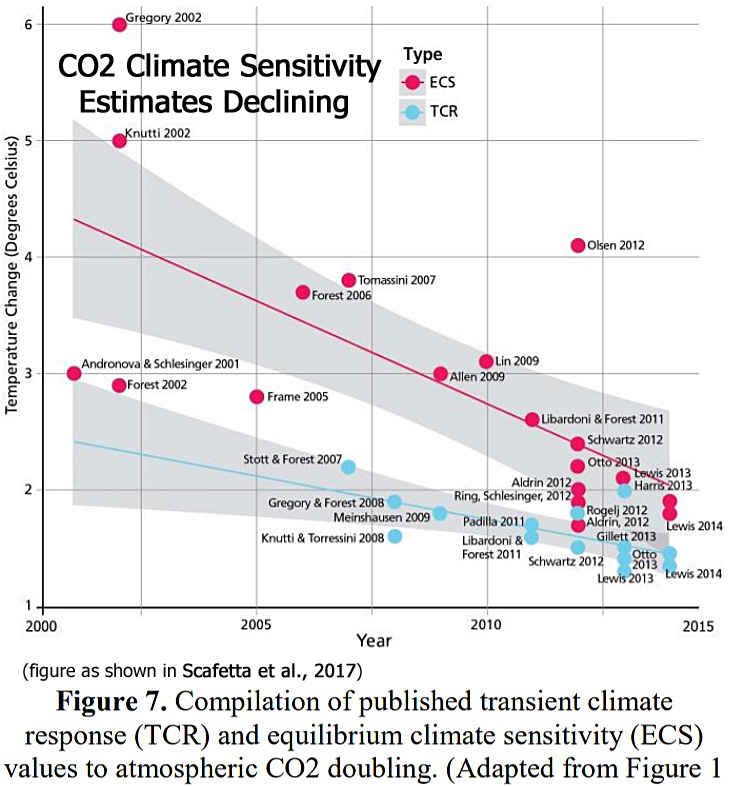
Do you deny that the CO2 sensitivity between CMIP5 andCMIP6 models changed by about 25%? Just imagine for one moment the error bars for ALL older models stemming from that single fact alone!
If alarmists of the past were right with their sure knowledge about CO2 and climate we would see flat trendless lines here:
Oops, wrong again. .are you startign to see why alarmist dont come here to “debate” they very quickly just look silly..
>> : ‘OK, it did warm and it was bad for us,
Really, how would we know that as long as valid research on this topic is suppressed by Mann, Holland, Alexander, Sherwood, Otto and Rahmstorf? (anti-science has names)
https://rogerpielkejr.substack.com/p/think-of-the-implications-of-publishing”
Alimonti has now published his work:
“We conclude that the patterns observed are largely attributable to progressively better reporting of natural disaster events, with the EM-DAT dataset now regarded as relatively complete since ∼2000. ”
Is it even possible or allowed to ask if there is a chance that you are dead wrong about your view? The warming from anthropogenic CO2 might be there but it has no significant harmful effect whatsoever and greening does plenty good?
Well stated. And Bellman finally outed himself as just another run-of-the-mill climate alarmist (not that many on WUWT had any doubts in this regard).
What alarm do you think I’m spreading? Is it worse than claiming billions of people are going to die if we reduce CO2 emissions?
“Forcing the whole world back to 1600s living standards and letting billions starve won’t even change things much.”
I love the fact I’m called an “alarmist” because I’m not entirely sure warming the planet indefinitely will be an entirely good thing. But I keep being told any attempt to avoid it will mean traveling back to the 17th century and killing billions of people.
The earth is currently warming, yes. That is a different statement than to say that we are warming the planet.
Most skeptics acknowledge that there is an enhanced greenhouse effect in principle, superimposed on natural variability. How big the effect after all other feedbacks is very much unsettled science.
There’s a limit to how much CO2 can warm the earth because its effect is logarithmic and we have limited stores of fossil fuels. Emergent phenomena may negate most or all of that effect.
I think it was warmer in the 1930s. It was at least as warm during the Roman Warm and Medieval Warm periods. There has been a modern warming trend, but its a perfectly normal cyclical phenomenon and no cause for alarm.
You say “I would just sooner not take the risk.”. It depends whether the measures you would advocate have any bearing on that risk. I’ve never seen any proposals by the climate alarmists which would, even if they were right about CO2 as driver, have any effect on global temperatures. Look at the various international conferences from Paris onwards. Even if all the pledges were to be implemented, and even if the alarmists were to be right, the effect would be negligible.
The risk of runaway global warming is negligible. The effectiveness of the proposed measures is zero. It doesn’t make sense to do things at huge social and economic (and environmental) costs to eliminate one of many vanishingly unlikely risks.
It is in terms of logic an endless reiteration of Pascal’s wager. This claimed that if there was only a tiny chance of Catholicism being true, one should believe, because the cost of disbelief, eternal damnation, was so high. The fallacy is that this only works in a world in which there are no other religions with a tiny chance of being true which also promise eternal damnation or something equally bad for disbelief.
The argument, lets devote all our energy to eliminating CO2 emissions to avoid the tiny chance of global warming driven by CO2 leading to catastrophe assumes for validity that we have nothing better to spend the resources on. But we obviously do. Clean water, better medical care, economic growth. Even asteroid strikes….
Can you post a link to a global average temperature dataset showing that?
“global”?
How about the US? From Wikepedia:
July 14, 1936
Detroit, MI: 104 °F (40.0 °C) (105 °F (40.6 °C) on July 24, 1934)
Springfield, MO: 104 °F (40.0 °C) (113 °F (45.0 °C) in 1954)
Indianapolis, IN: 106 °F (41.1 °C) (tied July 22, 1901 and July 21, 1934)[32]
Columbus, OH: 106 °F (41.1 °C) (tied July 21, 1934)
Cincinnati, OH: 106 °F (41.1 °C) (108 °F on July 21-22, 1934)
Madison, WI: 107 °F (41.7 °C)[23]
Louisville, KY: 107 °F (41.7 °C)
Kalamazoo, MI: 108 °F (42.2 °C)[26]
Minneapolis, MN: 108 °F (42.2 °C)[30]
Rochester, MN: 108 °F (42.2 °C)
Xenia, OH: 108 °F (42.2 °C)
St. Louis, MO: 108 °F (42.2 °C) (115 °F (46.1 °C) in 1954)
Lima, OH: 109 °F (42.8 °C)
Cedar Rapids, IA: 109 °F (42.8 °C)[18]
Dubuque, IA: 110 °F (43.3 °C)
Terre Haute, IN: 110 °F (43.3 °C)
Springfield, IL: 110 °F (43.3 °C) (112 °F (44.4 °C) in 1954)[18]
Decatur, IL: 110 °F (43.3 °C) (113 °F (45.0 °C) in 1954)[18]
Moline, IL: 111 °F (43.9 °C)[18]
Burlington, IA: 111 °F (43.9 °C)[18]
Rockford, IL: 112 °F (44.4 °C)[22]
Waterloo, IA: 112 °F (44.4 °C)[18]
Palestine, IL: 112 °F (44.4 °C) (114 °F (45.6 °C) in 1954)[18]
Mt. Vernon, IL: 114 °F (45.6 °C)[18]
Collegeville, IN: 116 °F (46.7 °C)
————————————————–
Although heat in the Midwest had begun to subside, heat had been building in the Great Plains over that period. It began on July 13 when there was a noticeable increase in temperatures but began to peak on July 14.
On July 14, the temperature climbed to 107F in Lincoln, NE after having 5 days of temperature’s in the low 100’s, though that night it would be the first time the temperature fell below 80F in a week. Norfolk, NE hit 105F and Omaha, NE hit 109F. Further south, Topeka, KS hit 108F, and Kansas City, MO hit 109F. In Tulsa, OK, temperatures had been climbing the past couple days and hit 110F this day. This heat would persist into the next day before temperatures would fall noticeably on the 16th over the Central Great Plains.
On July 17, temperatures once again began to rise. Nebraska set a record high of 118F in Hartington, NE. Sioux City, IA and Sioux Falls, SD also set record highs of 110F.[20] In Grand Island, NE it was 114F, falling 2 degrees short of the record in 1934, while Hastings, NE would set a record of 115F. It was also 110F in Fort Smith, AR.
On July 18, the heat would peak. Kansas and Oklahoma set record highs of 121F in Fredonia and 120F in Alva, respectively. Wichita, KS hit 112F, Salina, KS hit 116F, 110F in Topeka, KS, and 113F in Tulsa, OK (a record high for July). On July 19, Oklahoma’s record would be tied in Altus.
———————————————–
On July 24, Grand Island, NE broke their record high with a high 117 °F (47 °C). Hastings, NE also set a new all-time high of 116 °F (47 °C). Both Kansas and Nebraska tied their all-time record highs in Alton and Minden, respectively just days after they were set.
On July 25, the temperature rose to 115 °F (46 °C) in Lincoln, NE (a record high for the city) but would only fall to 91 °F (33 °C) that night. Outside of the Desert Southwest, this is one of the highest low temperatures ever recorded in the US. Omaha, NE also set a record high of 114 °F (46 °C), though had a low of 83 °F (28 °C). On the previous day Grand Island, NE broke their record with a high 117 °F (47 °C). Des Moines, IA would set their record high of 110 °F (43 °C) this day as well.[21] Iowa set their record high of 117 °F (47 °C) in Atlantic and Logan.
——————————–
How about the attached graph from NASA? The globe looks pretty hot.
This map from NASA shows the decade of the 1930s compare to the past decade:
Notably, part of the northern Atlantic was warmer than today, but none of the rest of the global was. The US was not warmer than today, though a limited part of the southern US saw temperatures comparable to today’s.
Ultimately, the exercise you’re engaged in is pure cherry-picking. You’ve chosen the US (less than 2% of the global surface area) not because it is representative of the state of the global climate in the 30s, but because you think it is the one region that might best persuade people into thinking the 1930s was warmer. You know full well that no global temperature record supports the claim you’re making.
You’re not cherry-picking enough. It was mainly the summers that were warmer, and 1936 in particular.
Yeah, but all the regional, unmodified temperature charts from around the world support his claim that it was just as warm in the 1930’s as it is today.
Here’s a chart of the US showing it was just as warm in the past as it is today, and below it is a chart of Australia showing the very same thing even though it is on the opposite side of the Earth from the US and is in the southern hemisphere.
No global record? Where do you think the temperature data bastardizers got their original data to create a global temperature chart? Answer: They got the data from regional charts and combined all of them. Dishonestly, as it turns out in this case.
All climate change alarmists are deniers. They deny these charts exist. And the reason is obvious: If they acknowledge these charts as being legitimate, then they can’t claim we are living in the hottest time in human history because of CO2, because today is NOT the hottest time in human history.
This reeks of further cherry-picking. Why the contiguous US and why Australia? What about… everywhere else? Why annual highest monthly daily max? Why not min? Why not mean? Why the single highest value you in the year? Why not the annual mean?
If you can’t defend these choices with an answer other than, “it might not show what I want” then you are cherry-picking. I’ve provided a global map – you can’t make the accusation that regions hav been “dishonestly” combined, because they aren’t combined, the regions speak for themselves.
“This reeks of further cherry-picking. Why the contiguous US and why Australia?”
Why not? I explained that the US and Australia were on opposite sides of the world and in different hemispheres, yet they both show the same temperature profile where it was just as warm in the recent past as it is today. Global, don’t you see.
“What about… everywhere else?”
Well, if you want to know about everywhere else, just go to the link below and Bob Tisdale will explain to you how to get the raw data from Berkeley Earth and you can make your own Tmax charts for anywhere on Earth, if you have the charting skills.
https://wattsupwiththat.com/2018/12/13/examples-of-how-the-use-of-temperature-anomaly-data-instead-of-temperature-data-can-result-in-wrong-answers/
“Why annual highest monthly daily max?”
We are talking about the hottest year evah! here, so if you want to see what was the hottest, you look at Tmax charts.
“If you can’t defend these choices with an answer other than, “it might not show what I want” then you are cherry-picking.”
I just defend my answer with temperature charts. They show that the bogus Hockey Stick chart profile is a lie. None of the regional temperature charts look like the Hockey Stick profile. That doesn’t cause you to question the Hockey Stick profile? It does me. Especially when I read in the Climategate emails about the corrupt temperature data manipulators worrying about “the blip” and how to get rid of it in the global temperature chart. But you buy all their nonsense, given the evidence?
“I’ve provided a global map – you can’t make the accusation that regions hav been “dishonestly” combined,”
Of course, I can. Where do you think the data mannipulators got their original data? They got it from the written, regional surface temperature record. As is obvious, the land surface temperature records conflict with the “hotter and hotter” Hockey Stick, the regional charts showing it was just as warm in the recent past and the Hockey Stick chart showing this is the hottest time in human history. How do you get from a benign temperature profile like the regional temperature chart show to a scary, hotter and hotter temperature profile like the Hockey Stick? Answer: You cheat. You add in bogus sea surface temperatures and artificially cool the past.
Seriously, you guys who trumpet the Hockey Stick charts, don’t have any reservations after seeing that the regional temperature chart profiles look nothing like the Hockey Stick profile? That doesn’t cause you pause? Shouldn’t you be asking yourself “why the discrepancy”?
And if you don’t like Tmax charts, then here are about 300 Tavg charts from around the world that show the same thing: That it was just as warm in the recent past as it is today, and none of these charts look like the scary bastardized Hockey Stick profile.
http://notrickszone.com/2017/06/16/almost-300-graphs-undermine-claims-of-unprecedented-global-scale-modern-warmth/#sthash.neDvp33z.hWRS8nJ5.dpbs
I’ve been saying the same thing for some time. Anomalies are basically first derivatives. Averaging 1st derivatives from different functions is never a good thing. I understand the thought behind this, an easy way to compare growth rates, but it isn’t that easy.
Simpsons paradox can have an effect here. All the derivatives pounded together regardless of various confounding variables like NH/SH, different baselines, etc.
You never explain why you believe these selected regional charts as genuine when they come from exactly the same data and source as the global data sets you claim are fraudulent.
Nor do you acknowledge that your graphs are not showing annual temperatures, they are just showing the hottest month in each year, or that they end in 2012.
And you never seem to figure out that if Australia was hot in 1932, when the US was cold, and cold in 1936 when the US was hottest, then you are not seeing a global average.
“You never explain why you believe these selected regional charts as genuine when they come from exactly the same data and source as the global data sets you claim are fraudulent.”
The written regional temperature charts are legitimate. They were written down before human-caused climate change became a thing, so are free from that bias.
And, yes, the temperature data mannipulators used this data in their calculations. The bastardization of the global chart came about by adding in bogus sea surface temperatures to the land temperatures and this had the effect of cooling the past so that the global temperature profile appears to be getting hotter and hotter, decade after decade, and we are now at the hottest time in human history. Just what the data mannipulators wanted us to believe. The want us to be afraid. Be very afraid. And give us lots of money to save you.
“Nor do you acknowledge that your graphs are not showing annual temperatures, they are just showing the hottest month in each year, or that they end in 2012.”
Well, I posted a link just above to 300 written, historical Tavg charts and they show the same thing as the Tmax charts, i.e., that it was just as warm in the Early Twentieth Centur as it is today. Feel free to update the charts. The raw data is at Berkeley Earth. Bob Tisdale explains what to do in a link I posted just above.
“And you never seem to figure out that if Australia was hot in 1932, when the US was cold, and cold in 1936 when the US was hottest, then you are not seeing a global average.”
I believe Australia is both hot and cold every year. The timing is caused by the orbital position. The data manniplators didn’t have any problem combining Australia’s temperautures with the rest of the world when they created their global “temperature” chart.
“The written regional temperature charts are legitimate. They were written down before human-caused climate change became a thing, so are free from that bias.”
The BEST ones go up to 2012. The Hansen one goes up to 1998. How old are you if you think climate change wasn’t a thing a couple of decades ago?
“The bastardization of the global chart came about by adding in bogus sea surface temperatures to the land temperatures…”
You do realize sea temperatures are warming less than land ones – don’t you?
“Well, I posted a link just above to 300 written, historical Tavg charts and they show the same thing as the Tmax charts, i.e., that it was just as warm in the Early Twentieth Centur as it is today.”
It would be a lot easier if you just posted the one global graph you think shows it being as warm in the 20th century than it is today. I’m not going to go through 300 dubious graphs. Just scanning through the first few and they are either starting after the 1930’s or only going up to 2000, or simply not showing what you claim.And most are based on proxy data.
“I believe Australia is both hot and cold every year.”
A clever trick if you can do it. How does it simultaneously have a hot and a cold hottest month every year?
“Bob Tisdale explains what to do in a link I posted just above.”
I don’t think even he understands what he’s doing. He keeps claiming this is the difference between using absolute rather than anomalies, but what he’s actually doing is comparing the warmest absolute month each year with the warmest anomaly each year. One will always be in summer, the other could be any time of the year.
Note, as far as I can see, BEST no longer updates the regional data, and the links on their page fail. But using the archives it’s possible to find the data up to 2018.
Here for instance is the graph for the UK.
Germany.
Spain.
Sweden.
All of Europe
NOOOOO! A hockey stick!
Everyone go buy a battery car!
Go buy a battery car and stop whining.
And you think Monckton’s living rent free in my head.
Greener planet
Crop production up with Cereal grains leading the way.
Increased life expectancy globally.
Climate disaster deaths declining to new lows.
What’s not to like?
(7) The American Storm on X: “This is so spot on right. Would you rather have it the opposite? Why would you push the opposite idea unless you’re trying to stop the progress of humanity. We are in a climate optimum not a climate emergency” / X (twitter.com)
(7) Latimer Alder on X: “We hear a lot about a few people who die because they get too hot. But rarely about the EIGHT (8) times as many who die because they get too cold Everywhere in the world it is COLD that’s the big killer So why are we ‘fighting global warming’? To keep them dying of cold? https://t.co/Wmts8SBfNq” / X (twitter.com)
I think that you miss the point that much of that is veiled sarcasm over the focusing by the Media and alarmists on every cherry picked transient high or up-turn.
Maybe it would have been a better choice of words to say “meaningless” or “uninformative.” Something one would expect from Captain Obvious.
The upward part of a sinewave gives the same result.
Warmest in a 45 year time series. Doesn’t tell you much.
It’s warmest in a 45 year period that is already the warmest in a long time.
Yeah – shut your eyes when the warmer times in the earlier part of the Holocene appear in the chart …
It really is amazing how they want to start the record at the coldest time in the last 2000 years, but object to looking at the entire record.
Nobody want’s to start the record 45 years ago – but UAH is satellite data and that’s as far back as it goes.
If you want longer records use surface data, but for some reason that’s never published monthly here – so we are stuck with he last 45 years.
What makes you think 1979 is the coldest time in the last 2000 years is a mystery known only to you. I assume you missed all the talk about the little ice age or the Maunder Minimum.
1979 , there was nearly as much Arctic sea ice as during the LIA.
Are you saying Arctic sea ice isn’t related to temperature ?
Another baseless assumption from bnasty.
Sorry that you can’t understand basic evidence.
Been posted many time. !
“1979 , there was nearly as much Arctic sea ice as during the LIA.”
And your precise data that shows that is…? I’m guessing all those memes about frost fairs, and armies marching across seas suring the LIA are nonsense then.
Still it’s good news for all those people terrified that the earth is about to return to a new little ice age. Don’t worry, it’s no colder than 1979.
Been posted many times.. pay attention or stop sitting at the very back of the class.
How soon we forget Lord M’s “no warming in ‘X’ years” (‘X’ being considerably shorter than 45 years).
‘Significance’ is such a moveable feast.
Yep, 1000 year old trees under glaciers, are much more significant..
Wouldn’t you agree. 😉
So what caused the great drought of 1540 in Europe when there was virtually no rain for 11 months and extreme heat across the Continent, corroborated by documents from several countries?
This is 0.45C warmer than the previous warmest September set in 2019, and is 0.63C warmer than September 1998.
Yeah but is it 0.5C warmer than September 1623? Or Sept 1624 for that matter…..
Probably a lot more – but without reliable satellite data it’s impossible to be sure.
Almost certainly a lot cooler than 1000 years ago.
Perhaps you would like to estimate how much warmer it must have been for large trees to have grown where they are now being uncovered by slowly retreating glaciers.
There’s no “must have been”. Glaciers onlyyell you about what’s happening in a single location, and you can’t simply use the size of a glacier as a proxy for the immediate temperature at that location. It takes time for glaciers to grow and time for them to shrink.
“only tell you”
High noon for alarmists.
The Thames is boiling!
Maybe Trenberth finally found his missing ocean heat /sarc
Just remind them that record NH ocean surface temperature in September guarantees record snowfall later in the year. (Something climate models fail to predict)
Early October and there is 52mm of water in the atmosphere at 40N. That is going to end up as snow on the ground by end of November. Not sure if this is unprecedented but there is still a lot of moisture in the atmosphere at high latitudes over the NH.
I think the Farmers Almanac is predicting the same thing. Long, snowy winter. The Farmers Almanac is a better predictor of the future than are the climate models.
The big question will be how long the snow remains on the ground. If we *are* warming then the snow should melt faster also. I guess we’ll see.
Brace yourself: Remember when Mann misused 1997 as endpoint in his hockeystick?
Breaks the 7.5 year downtrend since February 2016.
“Breaks the 7.5 year downtrend since February 2016.”
Not true. There’s still a 0.05°C / decade downward trend since Feb 2016.
There is now only a small window to cherry pick any downward trend though; May 2015 to March 2016.
Current El Niño will end the cooling trend, but not due to man-made “climate change”. Even a new Super El Niño probably wouldn’t have done it. A giant tropical Southern Hemisphere submarine volcanic eruption did.
Keep up at the back.
Spencer and Christy said that the Hunga Tonga eruption added at most a few hundredths of a degree to their monthly temperature anomaly.
Their September 2023 anomaly broke the previous September record by +0.45C. You need Hunga Tonga x 10 to explain that.
You need to explain how much warmer it must have been for trees to grow where there are now glaciers.
You keep ducking that. cowardice ???
More like willful ignorance. The stock in trade of the CAGW cultists.
And let’s review yet further, shall we?
-Still no expanding deserts. In fact, the opposite is occurring.
-Still no widespread crop failures. Instead yields & total harvests continue upwards.
-Still no climate refugees.
-Still no submerged islands. In fact, almost every one is larger than ever.
-Still no increase in severe weather events.
-Still no ice free polar Summers.
-Still no end of snow, and no end of skiing. In fact, record snows have fallen.
-Still no workable plan to replace fossil fuels, due to unwillingness to consider any viable option.
-Still no explanation of what exactly is dangerous about slightly warmer weather.
-Still no explanation of how exactly less polar sea ice is even slightly bad.
-Still no acknowledgement that CO2 is plant food or that extra is hugely beneficial.
-Stil no reason to believe people that ignore facts and instead make stuff up
-Still no willingness to abandon low lying coastal areas that flood.
-Still no willingness to spend even small amounts on mitigation infrastructure.
–Still not one single alarmist willing to lead by example, or even to start acting like they believe the nonsense they spew.
Never mind all this logical data driven stuff, Exeter university – neighbour to the Met Office has the course for you
The MA in Magic and Occult Science is one of the only postgraduate courses of its kind in the UK
https://www.itv.com/news/westcountry/2023-10-02/uk-university-to-launch-new-masters-course-in-study-of-magic
Is that run by the climate change department at Exeter, where James Dyke , author of ‘Fire, Storm and Flood: The violence of climate change’ resides?
A certain underwater volcano might have something to do with it.
Probably also still warming from the Little Ice Age.
When Tongan water condenses out of the stratosphere, cyclical cooling should resume, within secular warming trend since end of the LIA, c. AD 1850. Or from its Maunder Minimum depths, c. 1700.
Spencer an Christy explicitly stated in their August report that Hunga Tonga was responsible for, at most, a few hundredths of a degree in their monthly anomaly data set.
September beat the previous record by 0.45C. So no, it wasn’t Hunga Tonga. The excuses are running out, boys.
Good old Sol
And the evidence for “good old sol” causing this massive uptick is…..
(We’ll wait a long time.)
And the evidence that CO2, or any other human factor, caused this slight uptick is. .. where ?????
We will wait for ever for you provide any scientific evidence.
Contrarians will still argue that for imminent global cooling!
Excuses for your total lack of scientific evidence showing it is CO2 ran out long ago !
Had to wait for another strong El Nino. 😉
Still waiting for your explanation of trees growing under glaciers.
There he is, my wee mate benasty!
Last month you were on here declaring that because the July and August UAH monthly anomalies weren’t the highest in the UAH record, that meant that they somehow weren’t record temperatures (even though Roy Spencer was saying that they were, in absolute terms).
Here we are now, with the record highest monthly anomaly for any month in the UAH record (and many more to follow, by the looks of things) and you’re now babbling about ‘trees growing under glaciers’.
Desperation makes you say silly things.
“Desperation makes you say silly things.”
Yep, your desperation and panicked fixation is palpable.. and hilarious.
Have you found any scientific evidence of human causation yet ??
Have you “invented” any method of growing trees under glaciers yet.
How much warmer must it have been for trees to have grown where they are now being found under slowly retreating glacier.
Still waiting for your hilarious explanation. !!
Funny how you have become a tree hugger all of a sudden.
“Desperation makes you say silly things.”
Hey that’s not fair. Benasty doesn’t need “desperation” to say silly things. He can say silly things any time thank you very much.
Excuses for El Nino’s, a naturally occurring ocean heating phenomena? Lets hear them. Go on, tell us how fossil fuel burning causes El Nino’s.
Just wondering why all these El Ninos are getting hotter and hotter?
We’ve had treble-dip La Ninas for the past few years with no discernible cooling.
Funny that.
So when does the ocean start rising, the sea ice all melt, the crops all fail, and when do we all (or even any of us) start to perish?
When does the first alarmist in the history of bullshit make one single change in how they live or behave, that would indicate to the rest of us that they actually believe how we all live is gonna cause bad things to happen?
When do alarmists, who have spent decades gravely intoning about the obvious very-very-awfulness of the coming Bad Times, stop gloating about every heat wave and wringing their hands at every cold spell?
You make some good points there, Nicholas.
I am certainly guilty as charged, with regards to my lifestyle. I make little effort to contain my CO2 emissions. In my defence, I have never advocated that others do so either. I worked in the aviation industry for +30 years.
I’m just an observer of climate science and the psychology of denial thereof. That’s what interests me about this site. I do not consider myself to be more virtuous than the average poster here. I do try to be honest about my ‘alarmism’; that’s all.
“psychology of denial”
Yet YOU are the one in manic DENIAL that most of the last 10,000 years has been warmer than now.
YOU are the one unable to explain how much warmer it must have been for trees to grow where there are now glaciers.
YOUR whole AGW idiotology is based on manic DENIAL of climate.
”I’m just an observer of climate science and the psychology of denial thereof.”
Psychology of denial? You mean the denial that the cause of the milding is known? Is that the denial you’re talking about? If there is another kind please illuminate us.
You should be more interested in the psychology of your own blind belief.
“We’ve had treble-dip La Ninas for the past few years with no discernible
coolingwarming”In fact for nearly ALL the last 45 years, there has been no discernible warming..”
The only warming has come at El Nino events…
Do you DENY that fact ?
Did mankind’s CO2 emissions cause a frequently seen climate anomaly called El Nino then?
What goes up must come down. Don’t start hyperventilating over a naturally occurring event which is more often than not followed by a La Nina event you won’t hyperventilate over, but rather dismiss as a frequently seen climate anomaly.
Ho Hum.
No. ENSO is a natural oscillation that causes cooling in its negative phase and warming in its positive phase. It has no long-term effect on global temperatures because these phases average each other out. ENSO cannot explain the obvious warming trend seen in all the global temperature data sets over recent decades. Something else is causing that and it’s so obvious that it hardly needs repeating, other than at sites like this.
“Something else is causing that…”
Here is a novel thought: What is causing fluctuations in temperature is the exact same things that have caused the temperature to fluctuate at every time scale, from hours to millions of years, for the entire history the planet!
Dufus!
Look at the trend.
ENSO (nor solar) does not explain the trend.
CO2 does.
“CO2 does.”
ROFLMAO…
How does CO2 explain no warming except for El Ninos for the last 45 years. ???
You live in a fantasy brain-washed la-la-land.
Wrap this round your tree stump.
chrome-extension://oemmndcbldboiebfnladdacbdfmadadm/https://static.berkeleyearth.org/pdf/annual-with-forcing.pdf
ohhhh so nice to reread the cretin science yet again.
I guess the CO2 also explains why the Viking (MWP) and the 1st century AD at least in most of the northern hemisphere were considerably warmer than today?
Or perhaps why the 1930s were at least as warm as now (without the massaged heat-island measuring sticks?)
Anyone fancy making wine in Scotland? huh?
How do you know there is not an artifact of a previous El Nino?
The steps would suggest there is. How do you explain rising SSTs occurring con-currently with falling or stable atmospheric temps? Just face it. We don’t know.
bnice2000 has asked you several times to explain the observation of trees under glaciers. Why have you dodged this? Too inconvenient for you?
How does CO2 explain the trend?
And if it did, why would a warmer planet be bad?
Yet you have to wait every time for El Nino to give you your atmospheric “warming” fix.
You have just admitted that El Nino is responsible for the current warm spike.
Finally figured it out, well done. ! 🙂
Do you even think about the absolute crap that you write ??
Something else causing warming… but you have zero clue what it might be..
Certainly CO2 would not cause this spike and certainly would not cause the ocean warming..
Maybe get out of your padded basement and look up 😉
” ENSO is a natural oscillation that causes cooling in its negative phase and warming in its positive phase. It has no long-term effect on global temperatures”
Define ”long term”
No sh*t Sherlock?
No sh*t Sherlock?
Full of sh*t Sherlock.
It should be noted that according to the fossil record the greatest explosion of life on earth occurred during the late Cambrian and early Ordovician.
That explosion took place in the oceans and that exposes the lie to the claim of “ocean acidification” causing deadly harm to corals and other sea life. Hard corals first appear in the fossil record during that period as do the first sponges, bivalves, and jawed fish.
How Spencer and Christy know the effects of the volcano? Like everyone else, they are in the dark.
“Like everyone else, they are in the dark.”
Everyone apart from all those here insisting they know the current warming is entirely caused by the volcano.
Ooh, snap!
Good one!
Hey, remember back about about 25 years ago, when alarmists said the 1998 was the new normal, and it was from then on going to rapidly get ever warmer, and moreover that even 5 or 10 years with no new net warming would disprove the idea that CO2 controls temperature, and then by 15 years later, when it had not warmed up any more, and had in fact cooled way off, and instead of being glad, the alarmists just made up some new ways to lie about the historical data, thus proving there was no pause at all, and furthermore, even though in 1998 all the warmistas said the satellites were by far the best way to measure global warming since it was a measurement of the entire lower atmosphere of the planet, which comports much better with the idea of global atmospheric warming than spotty surface temps anyhow…but then when the satellite data sets showed zero new warming but instead overall cooling for over 15 years, then warmistas changed their minds and claimed that satellites data did not matter because “no one lives in the troposphere”?
Remember that?
I bet you do not, or at least will not admit it, but I sure recall it all vividly.
In fact, I can vividly recall all 35 years of whack-a-mole new pronouncements of what the real indication of global warming is…submerging islands, that is what we really need to be worried about, oh, wait, no, it is hurricanes.. we need a new category, cat 6, yeah, that’s the ticket…oh wait, no…it is Arctic sea ice, that is what really counts, Antarctic ice does not matter at all, duh(1)…forget all that other stuff, um, hold on, the end of snow, that’s what’s gonna kill us, eh…no, never mind it is fires and droughts, erm, nopers, it is floods…floods and droughts both, wait, blizzards, that is the real tip off, never mind about what I was saying before, just talking off the top of my head, this is what I really meant, not warming, not cold, it is climate chaos, that is what I meant to say, climate change, warming does not matter, warm and cold and drought and flood, all of that, and no snow, except when there is too much, wait, the islands again, global warming is back, the Arctic does not matter, it is the Antarctic, you cannot go by the Arctic, it is never gonna rain again in Texas,I mean Australia, I mean California, I mean Colorado, I mean unless it snows too much, Satellites do not matter, it has to be homogenized and fluffed and razzamatazzed just so, or it don’t tell yah jack… Hey…look at that Satellite temp! Oh noooooooooos!
Being the mindless idiot that he is, Nicholas cites more baseless claims with no links. He is a sheep in a herd of other sheep. With the sheep herder being none other than folks with a poo swapped for a brain like Steve Milloy and Tony Heller.
Aww stop, before you hurt my fehwings and make me cry, yah big meany!
Nicholas, you must be especially effective for a new troll to single you out from the rest of us sheep with his first post at WUWT.
Spongeblob cannot let fact disturb his mental incontinence.
Can you point me to one fact you’ve said? I can’t find any. Just the usual ad-hominem followed by some more nonsense.
I can’t help it if your tiny dried-sponge brain can’t recognise facts
Maybe an education passed primary school would help you. !
Everything is Nicholas’s post is facts.
Sorry it causes you so much mental anguish !
You are , and will always be.. a fact-free zone.
This month’s new sockpuppet — spongeblob. Last month’s (and the month before) didn’t even last 2 weeks, already gone and forgotten.
Same person flying monkey 🙂
I gave Nicholas an up vote for his fine commentary. I thought he made a lot of sense. Does that make me a sheep?
Tom you are a sheep at best and a shill paid to lie at worst. If even that. Your “U.S. was warmer in the 1930s argument” are so easily refutable by any minimally informed individual. Your response is “fraud or bastardized bureaucrats!” Can you even the biases the adjustments are intended to target?
“Tom you are a sheep at best and a shill paid to lie at worst. If even that.”
Who do you think gets paid more to be a shill, me or you?
” Your “U.S. was warmer in the 1930s argument” are so easily refutable by any minimally informed individual.”
Well, refute Hansen 1999:
And Hansen himself said that 1934 was 0.5C warmer than 1998, and of course, you know that means it was warmer than any temperature since that time including 2016 and last month.
And btw, in the Climategate emails, a colleague of Hansen’s emailed him and told him that his temperatue estimates for 1934, were the same as Hansen’s estimate: 0.5C warmer than 1998.
Richard M
That would put you also in the dark, right?
I don’t know why Spencer and Christy say the impact of the HT eruption had negligible influence on the observed warming; but they said they had investigated its effect and that their scientific conclusion, so far, was that it was insignificant.
Whatever is causing this latest upsurge in warming it wasn’t HT. And even El Nino is just starting to have its lagged effect on LT temps. There’s much more to come, alas.
I don’t think the UAH side-bar will last much longer here at WUWT (very bad look for global warming ‘skeptiks’, and I notice that, as of Oct 3rd GMT, they still haven’t added the Sep 2023 update); but I am ready to stand corrected, as always.
NOTHING humans do cause things like this tiny warming spike.
Very bad look for AGW stooges that like to pretend humans caused it…
… with absolutely zero scientific evidence… (of course)
Just imaginary unicorn farts… is the best they can come up with..
TFN,
Let me ask you a question: Why do you think that WUWT would do this? Are you alleging that they have some type of agenda? And if so, how would September 2023’s massive spike change their “agenda”?
It might be for the same reason that they abdicated the Berkeley Earth dataset. It was advertised as the be-all end-all dataset that would finally provide a real picture of what the global average temperature really was. The sites owner said “I’m prepared to accept whatever result they produce, even if it proves my premise wrong.” It was released shortly thereafter showing that the planet was warming by the amount GISTEMP and HadCRUT showed thus proving his premise wrong. The Berkeley Earth dataset is not well received here anymore.
Berkeley uses the same data as all the other groups. Therefore, it’s no surprise that they arrive at the same conclusion. Also didn’t Muller admit later to not being a climate skeptic?
I mean it uses surface station data like GISTEMP and the like. That was the whole point. They were going to show that the same data leads to a completely different result when processed “correctly”.
Yes. Muller later said that his effort on the project caused him to change his position. I believe he said something along of the lines that he was a “converted skeptic”.
Where is “here”?
I like the Tmax Berkeley Earth data sets. They show it was just as warm in the Early Twentieth Century as it is today, all over the world.
“The Berkeley Earth dataset is not well received here anymore.”
And if they keep it up…. it won’t be long before UAH has to sit in the naughty chair too.
The raw Berkeley Earth data is well recieved by me. It tells the truth, which is what I want. It puts the lie to the Hockey Stick profile.
Of course, we have to be careful that the raw data isn’t manipulated before presentation.
Bob Tisdale covered this subject in a link I posted just above.
What “raw” data. You keep spamming regional data from BEST which is generated using the same methods as they use for the global data.
That would include you, about everything……..
Nobody has been denying a warming trend, Rusty. Do we have to repeat this every month?
The glorious mild weather can’t last forever but we should enjoy it while it lasts. The real climate crisis will be the onset of the next glaciation. Meanwhile…
There is NO CLIMATE EMERGENCY!
Funny how Christy is only an expert when you agree with him.
Must have been CO2 then. Temperature anomaly jumped 0.21 C from +0.69 to +0.90, increasing 30% in one month, just like CO2 increased 30% from 421.42 to 421.62 ppm. Oh, wait. CO2 increased by a minuscule 0.047%. Where’s the correlation to CO2, to “greenhouse gasses”, you’re crowing about? It’s almost like you’ve never heard of natural variation, but we know you’re smarter than that, right?
“explicitly stated “
WRONG.
The word they used was “appeared” not to be.
You have just invented words someone never said.
I am ok to accept that co2 has a warming effect, that slowly builds up over time, although I believe the data would point to this being fairly benign (but not without risk). Having said that the early ocean heat experienced this year seems unusual as well as the heat seen over the last few months as el nino was in early stages. These jumps are not explained by the slow increase in temp associated with co2 ( even if we attribute all the long term trend to co2 which I think is probably a portion but not all). So while I am sceptical about the HT theory this to me would explain the variance seen recently better than the GHE. I am open to other possible explanations and will continue to follow, hopefully some interesting science can come out of all of this.
You think 150 MtH2O is responsible?
What about the 70,000 MtCO2 that got injected into the atmosphere since then?
Water is the main GHG, especially in the stratosphere
Well mixed GHGs cannot cause warming.
H2O is well mixed in the stratosphere.
But not in the troposphere where it really matters.
Being well mixed means the concentration matches the overall density changes as you rise through the atmosphere. This is how the movement of energy to space is kept constant and the lapse rate is maintained.
That 150 MtH2O pulse went into the stratosphere.
How much went into the upper troposphere, and lower troposphere.
How much heat went into the different levels of the ocean?
And it is currently way off its normal balance. !
Due to one massive sub-ocean eruption.
Stephen Wilde:
I had predicted the possibility of warming returning soon, during the long La Nina
of Jan 2020-Feb 2023, back in Sept of 2022::
“Net Zero Catastrophe Beginning?”
https://doi.org/10.30574/wjarr.2022.16.1.1035
The reason being that removing SO2 aerosol pollution from our atmosphere, as we are doing, through Clean Air and Net-Zero activities, etc., will cause temperatures to rise.
The VEI5 Hunga Tonga water volcano eruption of Jan 15, 2022 did not cause any cooling, as always happens because of the SO2 from a VEI4 eruption, even though it also emitted approx. the same amount of SO2, 0.18 vs.0.20 million tons. It appeared that the expected cooling was being offset by decreasing SO2 aerosol emissions, for the above reasons.
For a VEI4 eruption, it takes on average, 16 months for its SO2 aerosols to settle out, and for warming to occur.. For Hunga Tonga, the warming began to occur 15 months later, in
March of 2023, and it promises to be the strongest ever seen, in modern times, probably being aided by Clean Air and Net Zero SO2 aerosol reductions.
Evidence that this is indeed happening is in a more recent article “Definitive proof that CO2 does not cause global warming. An Update”.
https://doi.org/10.30574/wjarr.2023.19.2.1660
A long post, but keep the above in mind as time passes. The prognosis is not good!
I’d say pretty much all the warming up until this month was due to Hunga Tonga. It took awhile for the cooling gases to fall out which were balancing the warming for the first year. The El Nino effect is just kicking in.
The eruption has caused warming in 3 distinct ways, maybe more:
All of these effects will pass in a couple of years.
Yep, lots of water ejected high into the stratosphere…
… but there is no way it totally by-passed the troposphere.
No way it didn’t add energy to the water around it.
The deeper ocean currents passed Tonga also head downwards toward the Antarctic, then circle around to head up along the Peru coast.
I haven’t looked closely, but is the long tongue of warmer ocean further south than usual for an El Nino ?
It seems to have been there longer than they have been calling it an “El Nino”.
I refer you to the UAH August report:
” it appears.”
Ok, is that the best you can manage?
It “APPEARS” that you have no estimate of just how much warmer it must have been for trees to grows where there ae now glaciers.
Suddenly, you believe Spencer!
“decreased the absorption if high energy UV. More of it passes through into the lower atmosphere and surface.“
UV has good penetration into the oceans… maybe turbocharging the El Nino effect ?
You’d say that, but it doesn’t really matter what you say.
The scientists (even your normally preferred scientists at UAH, in this case) say you’re wrong.
It had minimal impact.
“It had minimal impact.”
Notice that you have changed the subject to atmospheric CO2.
You have yet to provide one bit of scientific evidence of human causation for this slight El Nino warming spike..
https://temperature.global/ is falling rapidly for a couple of weeks. Not buying satellite measurements anymore.
Casting doubt on even UAH now?
Lol, this happens so often! I’ve seen it for decades now. As soon as the self-described skeptics’ data set of choice starts confirming all the other ones, as they all inevitably do, it gets thrown under the bus. Here we go again!
Rusty, I don’t hold you to what every loon on your side spouts, only to your own nonsense. You can point to opinions by commenters that are at odds with many authors on this blog. That doesn’t mean that all skeptics hold those views. It shows that WUWT allows free speech.
You know full well that most skeptics recognize that there’s a warming trend. You never address why you can’t see that it’s a BENEFICIAL warming trend.
By my own “nonsense” do you mean the long term warming trend that I and others have been pointing out for the past ~15 years has has been roundly denied here at WUWT over that entire period?
If you now want to turn it into: “OK, it’s warming but it’s good for us”, then you’re entering a phase that, to date, has had only minority support here, in my experience. But it’s progress, I guess.
No Rusty, like many others, I have always acknowledged that there has been a warming period, which has variously been referred to as the Modern Warming Period (in analogy to the Egyptian, Minoan, Roman, Medieval quasi-millennial, natural Warm Periods), the recovery from the Little Ice Age, or the recent mild warming.
What has been denied is its potential magnitude, that it is dangerous, that CO2 is the only cause, that it has been accurately measured, that effects have been accurately attributed to it, that even if CO2 is the primary cause and has net negative impacts, that intermittent energy is a practical solution as opposed to adaptation. What has been asserted is that political bias drives the science, that alarmism is an unreasoned emotional quasi-religion, that natural variability still plays a role, that nothing is simple, that science cannot be ‘settled’.
Of course there have been some commenters holding what I would characterize as unreasonable and ill-founded opinions, who deny all sorts of things and claim all sorts of things. I would just say that you should not judge a book by its cover or a blog by its crank commenters.
The positions taken by the skeptical article authors such as Anthony Watts, Willis Eschenbach, David Middleton, Susan Crockford, and numerous others whose names are only omitted here due to my inadequate memory, should be the measure of WUWT. That there are crank opinions expressed as well as discussions like this one, is a testament to the free speech principles that Anthony Watts has championed.
Occasionally I see a glimmer of reasonableness in you, but it’s always struggling to escape and promptly squelched.
Some of us have recognised a warming trend for a lot longer than 15 years. We just don’t attribute it to a single trace gas.
Nor do we catastrophise about a beneficially warming planet.
“pointing out for the past ~15 years”
??
It has been cooling since the last El Nino. (until this sudden non-CO2 spike)
So what nonsense are you dredging up this time ??
The only warming in 45 years is from a couple of El Nino steps.
The rest is basically ZERO TREND.
How are El Niño spikes producing a long term warming trend? Could you please describe the mechanism driving this?
“Could you please describe the mechanism driving this?”
I’m picking he will struggle with this.
What do you mean by “long term”?
He blindly follows his pea-sized brained master Steve Milloy. Who puts forth arguments so bad that even a minimally informed individual who knows anything about trends would so easily dismiss them. The fact that this idiot’s tweets are aired with the Heartland Institute says a lot.
The fact that this nonsense of a global temperature set is even brought up at all says a lot.
https://woodromances.blogspot.com/2022/02/the-marketing-of-alt-data-at.html
By all means suggest that ground stations are more reliable than remote satellite measurements. But seriously, temperature.global?
A website that has zero explanation of their methods and produce results that are just unbelievable. 2018 was half a degree warmer than 2016 – really?
I agree with bdgwx, TFN, etc. Your comment is stupid. Stop being contrarian just to be contrarian.
Not buying our satellite measurements?? Welp, there goes our funding. 😉
I am not doubting yah Roy!
I am just glad I do not live in the middle troposphere!
I mean, I live in Florida, so I love it hot, but not at night, and there is no power up there for my AC, so…
Did you ever?
You aren’t the only one. It looks like Steve Milloy who was once on the UAH boat has jumped ship.
https://twitter.com/JunkScience/status/1708874554498560426
We have reached peak scare with data.
It is said that UAH TLT lags ENSO by 4-5 months. The ONI is 0.5 and 0.2 for 4 and 5 month lags respectively. If UAH TLT behaves the same way it has in the past then we cannot eliminate the possibility that the peak is still yet to come.
Yes, we are only at the early stages of the ENSO influence on UAH. I’m pretty sure that in July (possibly June) Dr Spencer said that it was too soon to attribute this exceptional warmth to ENSO.
He speculated then that Hunga Tonga may have been a factor; but in the August UAH report Spencer at Christy conceded that HT probably had only a minimal effect.
Probably not, the Planck feedback will likely take care of that spike, if not by Oct 1, by Nov 1….An extra degree in a month is 5.5 watts per sq.M leaving the surface, while an extra 0.2 ppm of CO2 increase since the previous month is too small of a watt forcing to measure….”what can’t continue going up will come down”, is somebodies law…
The real question is “what keeps it from going down all the way ?”
Because the long running UNDERLYING trend is always warming……. which started around 1700.
I can guarantee you that a future monthly anomaly will be lower than 0.9 C. The question is…is 0.9 C the highest for this El Nino cycle? Past experience tells us not eliminate the possibility.
Admitting that the El Nino release of energy is the cause of this slight warming spike.
Good boy ! 🙂
bnice2000:
El Ninos do NOT release energy. They result from higher global temperatures
The Monckton Pause reduces to 101 months on this update and is now on the verge of a quick collapse. If the next month comes in at 1.08 C or next 2 months at 0.68 C or next 3 months at 0.54 C then the pause ends entirely. Given that the El Nino response has only just started I would not eliminate the possibility that the Monckton Pause ends this year.
Not sure why you even pay attention to that crank.
He gets his nonsense published and, usually, uncritically commented on here; I assume that’s why bdgwx commented on him.
He publishes a simple piece of mathematics.
Sorry it is beyond you to comprehend.. !
OK, Einstein.
Admitting you don’t comprehend basic maths
At least that is a start.
Once you realise just how DUMB and IGNORANT you are..
…. that will be a good next step
Because what Monckton did was useful while bdgwx is properly showing that the pause is about to vanish into a warming trend.
The long pauses he brought up never mean over all cooling at all since 1979 just a cessation of warming for a period of time.
Thankfully, we should be in the midst of forming the perfect starting point for a brand new pause so that we can deny that global warming isn’t happening for a few years.
*is happening
“brand new pause “
Each pause is 0.2-0.3C warmer than the last one.
Each new pause is merely being lofted high on the angels wings of the pauses that came before.
Yes, we are witnessing the birth of a whole new future ‘pause’ scenario.
They keep on coming, don’t they?
The pauses have been real you dummy but the next El-Nino phase erases it to a new step-up warming level then after the inevitable short cool down a pause then forms ….
You can’t have a ‘pause’ if you don’t have a spike, right, Tommy?
UAH is basically ALL pause, apart from the occasional El Nino spike/step.
Even with this slight spike…
… there is a zero non-positive trend back to June 2015.
red thumb.. do you DARE check the data 😉
True because of the STEP UP warming of El-Nino phases then flat till the next El-Nino comes along which erases the short term cooling run.
CO2 warming effect is negligible at best.
Can you describe the physical mechanism by which El Niño causes the step up warming you reference? As far as I’m aware, ENSO is a redistribution of heat around the ocean surface, it is not adding energy to the system.
I think that we can eliminate anthropogenic CO2 emissions since they are increasing essentially monotonically, not as a step function.
One doesn’t need to have an explanation for the sun ‘rising’ every day for it to be a reality.
Isn’t your “step function” exactly what we’d expect for a steady warming trend overlain by some kind of quasi-cyclic variability (El Niño)? How would you distinguish between those two scenarios by simply peering at the data?
We can attribute the “steady warming trend” to an accumulation of heat since the end of the Maunder Minimum, plus a small but inconsequential amount of warming from green house gases, land use changes, and albedo and specific heat changes from Urban Heat Islands.
The unknown factor(s) seem to be related to ocean currents that periodically dump heat into the atmosphere, periodic increases in energy from the sun during sunspot maxima, and episodic heat from mid-ocean spreading centers and undersea volcanoes.
I don’t know that “peering at the data” is sufficient. However, I am impressed with the causation work of Christofides et al., initially published over at Climate etc.
Here is a 1D model I developed that is similar to Dr. Spencer’s that might help you understand how the monotonic increase in CO2 and its expectation as an agent of long term modulation is not inconsistent with the observations. The epiphany here is not understand that CO2 is not the only thing modulating the TLT temperature. The TLT temperature responds to the net effect of all agents working in tandem. And with only 4 free parameters (CO2, ENSO, TSI, and volcanic AOD) we can explain most of the 13m temperature behavior including peaks, troughs, and pauses.
A FAKE model with CO2 built in as an assumption
NOT SCIENCE. !
It is zettajoules, man!
Hiroshima’s of Zettajoules!
It all leaks out when the water sloshes back and forth!
Well, some of it does, except when it doesn’t
It’s complicafamated.
OK, so the big story from Alarmastaville is the Colorado River reservoirs will never fill up again.
Therefore, they are going to overflow within about, oh, 18 months, maybe sooner.
Hurricane drought, anyone?
Each one of them bad boys transports massive energy poleward and spaceward.
Then we have an annular eclipse, hours of no Sun at all over two continents.
But seriously, warmest Earf in >40 years, and Arctic Sea Ice?
No year over year decrease.
Zero.
Lowest forest fire season in the US in many decades.
One of the least number of hot days over 95 in the lower 48 in over 120 years of records.
Snowing in the mountains out west right now.
But highest Canadian forest fire season in decades, how about checking out the whole N American continent? Smokey over NYC over the last few days. https://www.nbcnewyork.com/weather/nyc-air-quality-impacted-again-by-canadian-wildfires-for-days-what-to-know/4731260/
While the 2023 sea ice volume is slightly outside the 95% envelope, it is well below the 2012 excursion of about 3 sigma, which is obscured by averaging the 2012 readings with all those between 2004 and 2013.
“Hurricane drought, anyone?
Each one of them bad boys transports massive energy poleward and spaceward.”
There’s a thought!
Where does that energy go when there are no hurricanes?
Wasn’t human-caused climate change supposed to cause more hurricanes and more powerful hurricanes? What happened? Did CO2 disappear? Or maybe the climate alarmists were wrong.
El Ninos have been going on for thousands (maybe millions) of years. Why aren’t we boiling?
According to climate calamity enthusiasts, we already are 🙂
We are boiling. Don’t you believe what the UN says?
Because the Maunder Minimum cooled Earth after the warming that ended the last major glaciation.
Seriously? Temperatures just keep going up every time there’s an El Niño, and the only thing that stops the Earth evaporating is the sun occasionally shuts down (or whatever caused the Maunder Minimum), and that’s just enough to reset all the warming from all those El Niños?
“and the only thing that stops the Earth evaporating is the sun occasionally shuts down”
WELL DONE !!
You have FINALLY figured out it is the SUN.
Wonders will never cease. !!
Sarcasm detection failure. Did you not see the question marks?
So, it’s not CO2 causing warming, it’s oceans warmed 800 years ago?
With a couple of ºC temperature rise, restricted to the NH, in winter and mostly at night according to the IPCC.
Try reading your own propaganda, Bellend.
As a reminder, we are in an Interglacial driven by the Milankovitch Cycles. We apparently have not yet reached the peak of the current interglacial.
Really? I thought we were supposed to be on a long term downward trend since 6000 years ago, based on Milankovitch Cycles.
And how is any of this meant to explain how El Niños cause permanent warming?
https://www.usgs.gov/faqs/how-long-can-we-expect-present-interglacial-period-last
It may be that El Ninos are a method of expunging heat from the oceans — heat that is derived from the Milankovitch Cycles. We appear to be only about half-way through the current interglacial. As shown by the Vostok ice cores, the warming phase is steeper than the cooling phase.
None of that says anything about when the peak of the current interglacial is.
It’s difficult to be sure about temperatures thousands of years ago, but it is generally claimed that temperatures have been falling for the last few millennia. (At least until the current warming)
https://en.wikipedia.org/wiki/Holocene_climatic_optimum
There were El Ninos in the period between the decade of the 1930’s and the 1970’s, yet the temperatures cooled by about 2.0C during that time.
Which would just prove my point. El Niños do not warm the planet over the long term.
You are wrong about the 2°C of cooling, but the point’s still the same.
I’m not wrong about the cooling. Do you want me to show you the US chart again that clearly shows a cooling of 2.0C?
Here it is, Hansen 1999. It should be obvious from this chart that you are wrong.
Once again, that’s the US not global. Here’s the graph you want if you are going to claim 2°C of cooling.
http://wattsupwiththat.files.wordpress.com/2009/12/hansen_temp_fig2.png
The global temperatures at most drop about 0.5°C, and that’s from the 1940’s, not the 1930’s.
Even in the US graph, you still refuse to explain what you mean by a 2.0°C cooling. Are you just looking at the warmest year and comparing it to the coldest year? You actually talked about the 30’s compared to the 70’s, and you only have to look at the 5-year means to see that the difference is a lot less that 1°C between those two decades.
Clyde Spencer:
Nonsense!
The Maunder minimum had NO effect on LIA temperatures. It was just a coincidence.
https://doi.org/10.30574/wjarr.2022.13.2.0170
There are so many potential influences that it is hard to keep them all in mind. However, I don’t give much credence to any ‘coincidence’ that persists for decades. Terrestrial vulcanism is something that happens all the time. We only know of one episode of cessation of sunspots.
Which was a continuous underlying COOLING trend of the LIA which changed around 1700 to an overall warming trend.
Even during and prior to ice ages Nick?? And aren’t El Nino steps after an ice age just part of the natural warming process? After all El Nino’s have been around for thousands (maybe millions) of years.
LOL, early in the interglacial period there little to no El-Nino’s at all and that was DURING some of the warmest part of the interglacial how did it get so warm……
Once again have to drag out the OBVIOUS that STEP UP warming occurs during El-Nino phases as 1986-1988, 1998, 2016, and so on from Bob Tisdale:
LINK
Javier Vinos also brough this up several time with research yet you seem have poor memory of them…..
There have been 30 El Ninos since 1900:
If each raised the temperature by 0.2C, that would be 6C of warming.
If they averaged only 0.1C, that is still 3C.
Didn’t happen.
What a meaningless post.
Yeah, since he left out the La-Nina cooling effects (Reduced energy release rate) while the ocean waters were recharging for the next El-Nino phase.
LINK
Earlier you said “With La-Nina there is nothing…….”
Which is it? Is there nothing or is there cooling?
LOL, it is the absence of El-Nino is why there is some cooling especially right after the step up peak drops rapidly back down.
La-Nina isn’t causing any cooling it is the absence of El-Nino’s is why it cools.
We have DAY and NIGHT, but only DAY has sunshine and warmth added to the surface, Night is the absence of the Sun it which is why it is dark and cooler.
You are struggling here……
Let ask it another way. If the ONI is 0.0 over an extended period of time with several El Nino and La Nino phases what is the net contribution to the atmospheric temperature in degrees C (or C/decade) you are expecting if the net energy flux is balanced at the top of the atmosphere?
This is what has happened in the satellite record.
Plateau after each super El Nino. What one doesn’t see in the graph is that bulk of the warming put into the global averages has happened at the polar zones or in the temperate regions of the temperate zones adjacent to the polar zones.
Still no persistent hot spots in the troposphere over the tropics as the physics the models DEMAND is necessary for the feedback due to CO2 they claim is happening.
Thus the culprit for atmospheric warming most likely WV and not CO2. That is why at the Arctic there is a pattern of positive temperature anomalies occurring in the colder months and not during the summer months.
This one shows an animated chart that makes clear large El-Nino’s are generating the STEP UP warming then flat to a cooling trend ensues until the next large El-Nino comes along…..
SkepticalScience Needs to Update their Escalator
LINK
It is based in the 202 Trenberth paper.
The GAT does not represent “the climate”, Stokes.
A misleading presentation since you didn’t address several decades of COOLING that so excited scientists in the 1960’s and 1970’s.
Not only that only the bigger El-Nino’s generated the step warmings.
Alarmists never mention the cooling that took place from the 1940’s to the 1970’s.
In the 1970’s, some people claimed we might be headed towards another ice age because the temperatures had been cooling for decades.
Alarmists deny this happened. They create Hockey Stick charts to erase this truth.
It looks like there were 16 El Ninos between 1930 and 1980, when temperatures cooled by about 2.0C, and since 1980, there have been 15 El Ninos.
So it cooled during 16 El Ninos, and it warmed during 15 El Ninos.
I guess I better put the US temperature chart here so people will know what I’m talking about when I say the temperautures cooled by 2.0C from the 1940’s to the 1980’s.
US Temperature chart (Hansen 1999)
A down vote for th US chart? What did the US chart ever do to you?
Oh, I know, it might burst your human-caused climate change bubble. Run away from reality as fast as you can.
The trendologists derive pleasure by mindlessly downvoting names they don’t like (i.e. anyone who calls them out on their stark BS).
Because El Nino is charged by the SUN. There is no other source of energy, except maybe some seismic activity in the oceans.
And the SUN has been at a strong series of solar maxima for most of the latter half of last century.
Even SC 24 and 25 haven’t been particularly low.
What happens if you have been heating a large tank of water at 9 on the heater dial, then turn it down to 8?
Broiling Nick, we are in fact broiling.
Oh yea!
absolutely brutal out there:
Real-time Global Temperature
(updated every 1-2 minutes)
57.36°F / 14.09°C
Obviously, something different happens when we are in one of the multidecadal cooling trends.
What about La Nina?
It is just a name for the ABSENCE of El-Nino’s the ones that generated the outflow of energy from the surface pool of warm water is generated.
With La-Nina there is nothing…….
Please tell me you’re joking.
that’s a new one lmao. “With La-Nina there is nothing …….”
The people on this website are contrarians just to be contrarians.
Contrarians to what?
As best I can tell…anything. But perhaps something that might resonate better with you would be any challenge to the fact that the planet continues to warm.
Who says the planet isn’t warming?
The really dumb thing to believe is that a trace gas that’s entirely beneficial to everything on the planet causes warming when all evidence says otherwise.
The other really dumb thing to believe is that a warmer planet isn’t a better planet.
Anyone who predicted no additional warming and said 1998 or 2016 was the top.
Name them.
I think it would be better if Mike told you himself. Mike, who was it that said the 2016 peak will not be topped?
No, he isn’t. This is the mindset.
Ok muppet brigade… show us the effect of La Nina.
With actual data.
We can wait.
Looks to me, and anyone else looking at any actual data.
That basically NOTHING is happening.
Notice you and Bellman didn’t address it while I posted the LINK to Bob Tisdale’s presentation on this that isn’t being addressed either.
Thus, you two add NOTHING here.
You need to make your mind up. Here you say La Niñas are just the absence of El Niños, but elsewhere you are saying they are causing cooling which counteracts the warming caused by El Niños.
And, now you are quoting Bob Tisdale as an expert. And in that post he seems to be seriously misunderstanding what Trenberth was saying.
https://theconversation.com/global-warming-is-here-to-stay-whichever-way-you-look-at-it-14532
…
…
I never said La-Nina was causing cooling It is named that way because El-Nino isn’t there while during the La-Nina phases the ocean is warming up towards another outflow of energy which is when the El-Nino come along again…
Here are my words you dishonestly claimed differently.
It was because of the REDUCED ENERGY RELEASE OUTFLOW RATE!
The article is dated 2013 which has NOTHING to do with his 2002 paper that was describing the El-Nino step warming.
El-Nino is the Discharge Phase with actual energy transport while La-Nina is called the Recharge phase, but it is just a name for the time frame as it is a period of less cloudiness and increased solar warming and doesn’t transport anything.
Every phase has a name but not all of them is the cause of it.
Back radiation into the ocean waters is negligible while the SUN is the dominant cause of warm ocean waters as it penetrates deeply into the depths which warmist/alarmists lies about all the time.
“I never said La-Nina was causing cooling It is named that way because El-Nino isn’t there while during the La-Nina phases the ocean is warming up towards another outflow of energy which is when the El-Nino come along again…”
It’s called a La Niña because it’s a counterpart to an El Niño. It could have been called an anti-Niño but as that means Anti Christ it was. Thought better to just call it a girl rather than a boy.
Sorry, but La Nina’s are more than just the lack of El Ninos. During La Nina, cool waters are brought to the surface on the eastern side of the Pacific.
Correct. Cool and rich in nutrients. See SST graph at bottom of thread.
Exactly. Now you just have to explain it to Sunsettommy.
“Focusing on the wiggles and ignoring the bigger picture of unabated warming is foolhardy, but an approach promoted by climate change deniers.”
You are referring to the bogus Hockey Stick temperature profile.
The real temperature profile shows that the temperatures cooled from the 1940’s to the 1970’s, by about 2.0C, and all the while CO2 was increasing in the Earth’s atmosphere. So CO2 is increasing during this time, yet it cools for decades, a substantial cooling, so where is the CO2 heating. Why didn’t it apply to this period of time?
Your current “unabated warming” started in about 1980. You need to increase your horizon.
There was “unabated warming” in the 1930’s, too, but then the cold weather set in and it cooled for decades. Alarmists don’t think this pattern will repeat today. In fact, they deny the magnitude of the cooling that ended in the 1970’s.
Alarmists have no clue as to why it is warming or cooling. Their CO2 obsession has led them astray in their thinking.
Oh, yeah. Here’s a real temperature chart for you to bitch about:
Hansen 1999:
Tom, do you seriously not understand that the graph is contaminated by the time-of-observation change bias, instrument package change bias, station relocation bias, etc?
And all those biases were on the warming side, causing a reduction in the temps to correct them, right?
It also ends in the 90s, missing the last 2+ decades of change. Here’s what the latest version looks like overlain:
Well, Hansen says 1934 was 0.5C warmer than 1998. And, going by the UAH satellite chart, that makes it about 0.4C warmer than 2016 and the same for the recent spike in warming.
The year 1934 was hotter than all subsequent years in the United States.
Extend Hansen 1999, with this UAH chart.
As you see on the UAH chart, 1998 and 2016 and the current warming are all on the same horizontal line, give or take a tenth of a degree, and that makes them all cooler than 1934.
You’re saying Hansen is a failure at recording accurate tempratures?
No. I’m saying the graph you posted contains several known biases. And I know you know this because we’ve discussed it before. Why not post the graph from Hansen that has these biases addressed?
“You are referring to the bogus Hockey Stick temperature profile.”
I’m not refering to anything. I’m quoting Trenberth, the expert who people are claiming says all warming us caused by El Niños.
“The real temperature profile …”
You’ve yet to produce any data, real or imaginary, that shows what you claim. Just 20 year data for the USA which still doesn’t show 2°C cooling.
So you can’t see 2.0C cooling in the Hansen 1999 chart? I guess your mind is made up and I can’t help you then. Does anyone else not see a 2.0C cooling in this Hansen chart?
If you don’t see a 2.0C temperature decline in this chart, then please write down your name.
No since La-Nina doesn’t release the energy from the ocean which El-Nino’s does at the East Pacific end while there is ALWAYS a warm pool at the Philippine end it needs an El-Nino phase to move it East to spread it out for accelerated release of energy into the atmosphere which all originally came from the sun.
La-Nina is simply the Recharge phase for the next El-Nino phase to release it more rapidly than what the ocean waters normally releases.
And when the EEI is zero the La Nina “recharges” are roughly matched with the El Nino “discharges” so there is no longer warming [*].
Remember, ENSO has been occurring for thousands if not millions of years. If you think El Nino causes say 0.1 C of warming without La Nina causing cooling equal in magnitude then you’re going to need to reconcile the fact that the global average temperature has been relatively stable for so long.
[*] To be pedantic the ENSO heat exchanges are rather complex. I’m not sure it makes since to refer to it in terms of recharging and discharging primarily because we do sometimes observe net uptake in the ocean during the El Nino phase. I wouldn’t eliminate the possibly that both 2023 and 2024 could have a net positive gain in OHC.
Which is it? Thousands or millions?
Good question. The longer ENSO has been occurring the more absurd the hypothesis that El Nino causes warming while La Nina does nothing. Which do you think it is?
You didn’t answer my question, instead, an inelegant body swerve.
I don’t know the answer to the question on how long ENSO has been occurring except that it can likely be constrained within a few thousand and a few million years. Do you know if it is closer to a few thousand or a few million?
HA HA HA now you are being dishonest since the charges and recharges events are NOT the same, they are irregular due to frequency and duration of the phases.
There are periods of time La-Nina phases dominates as it was from the 1940’s to the 1970’s then it became El-Nino dominance since 1980 which might be coming to an end as La-Nina is going to be more common and longer lasting which means less and lower amounts of energy discharges.
Look at the chart at top right you can see the obvious dominance of La Nina times during “global cooling” period and the Dominance of El-Nino’s “global warming” period since 1980 but only El-Nino’s produce the large increase in outflow of energy from the waters that so effect the temperature changes which are rapid as we are seeing this year as the latest El-Nino comes on……
Southern Oscillation Index timeseries 1876–2017.
LINK
No offense. But duh. I have countless posts trying to explain to everyone here including you how the irregularity of ENSO (and other oscillations) contributes significantly to the irregularity of the global average temperature. I even have a model similar to that developed by Dr. Spencer and Dr. Christy demonstrating how it works.
Why don’t you ever respond to Gorman?
There are two of them. I used to and I may occasionally still if I am aware one of their posts is even remotely related to something I’ve actually said or advocated for. But, past experience tells me they either start challenging fundamental laws of physics (like the 1st law of thermodynamics), make up absurd arguments that they want me to defend, or make algebra mistakes some so trivial even elementary student could identify. And I don’t say this with any malice. It’s just that I have neither the time nor the motivation to address the continual onslaught of posts challenging physical laws, creating strawman arguments, and/or littered with numerous algebra mistakes so unless I’m made aware of something relevant I usually just ignore their posts now.
Nice dance dude. You sound like a high school kid coming up with excuses for why their homework isn’t done.
Be an adult, if you don’t want to answer, just say so.
“It is better to offer no excuse than a bad one.” George Washington
“””””But, past experience tells me they either start challenging fundamental laws of physics (like the 1st law of thermodynamics), “”””
Tell everyone where you studied thermodynamics and how many hours you have had or are you sel-taught?
I recall his bizarre ideas about heat transfer.
Nope it has been well established that La-Nino does NOT cool waters down, it is the RECHARGE phase for the next El-Nino event to excite the mass of ignorant warmist/alarmists into another holly rolling on the floor orgasm over a natural warming event.
From Bob Tisdale who did the work of pointing it out:
….. HOW A LA NIÑA IS NOT THE OPPOSITE OF AN EL NIÑO
As a reminder: During normal times the trade-wind driven North and South Equatorial Currents in the tropical Pacific carry waters almost halfway around the globe, and that water warms as it goes halfway around the world under the tropical sun. After that one pass along the tropical Pacific, some of that sunlight-warmed water is stored in a large, deep pool called the West Pacific Warm Pool, without having made a complete circuit of the North or South Pacific gyres where they can more readily release heat to the atmosphere at mid-to-higher latitudes, primarily through evaporation. The volume of warm water in the West Pacific Warm pool increases with time and is often dramatically increased during La Niña events, when a reduction in cloud cover allows sunlight to reach into the tropical Pacific and warm it to depth.
With a strong East Pacific El Niño, a huge volume of warm water from the West Pacific Warm Pool is driven eastward to the Eastern Tropical Pacific, as far as the coast of South America, where the surfaces are normally cooler than in the West Pacific Warm Pool. At the end of the El Niño, when the trade winds resume their normal east-to-west operation, all of the warmer-than-normal water in the eastern tropical Pacific—that’s left over from the El Niño—is driven west to be warmed a second time under the tropical sun as it travels halfway around the globe before it then is driven toward the poles so that it can release heat to the atmosphere, primarily through evaporation. Phrased another way, after the El Niño, the surface waters are warmer than normal in the Eastern Tropical Pacific before they begin their trip across the tropical Pacific under the warm tropical sun. There’s no way that a strong East Pacific El Niño cannot contribute to long-term global warming.
Does the opposite happen during a La Niña? Here’s the real clincher. At the end of the La Nina, when the trade winds weaken to their normal east-to-west strengths, is all of the cooler-than-normal water in the eastern tropical Pacific—that’s left over from the La Niña—driven west to be cooled a second time under the tropical sun as it travels halfway around the globe before it then is driven toward the poles so that it can absorb heat from the atmosphere? Of course not. Anyone who says a La Niña is the opposite of an El Niño is announcing their ignorance of El Niño and La Niña processes for the world to see—or—they are willfully misrepresenting those processes.
THE CHARGE [RECHARGE] OF OCEAN HEAT CONTENT IN THE TROPICAL PACIFIC BEFORE [AFTER] AN EL NIÑO
A tremendous amount of heat is released from the Tropical Pacific during an El Niño. Where does the ocean heat come from and how is it recharged? Part of that heat loss, or all of it (plus some more on occasion) can be created immediately before the El Niño (as was the case before the 1997/98 Super El Niño during the thought-to-be-weak 1995/96 La Niña) or restored afterwards by the coupled-ocean atmosphere processes that take place in the tropical Pacific during La Niña events, as happened during the 1998/99/00/01 La Niña. (You can confirm the timing and length of those La Niña events with the Oceanic Niño Index here.) Colder-than-normal sea surface temperatures in the tropical Pacific during a La Niña lead to less evaporation than normal there, which results in less cloud cover than normal there, which allows more sunlight (downward shortwave radiation) than normal to enter into the Tropical Pacific thus charging (recharging) the ocean heat.
Thus, El Niño and La Niña events act together as a chaotic, naturally occurring, sunlight-fueled, recharge-discharge oscillator, with El Niño events acting as the discharge phase and La Niña events acting as the recharge phase. Simple.
LINK for a lot more
“Nope it has been well established that La-Nino does NOT cool waters down”
Your claim was that La Niñas were just the absence of El Niños. Now you are admitting that they involve “recharging” the oceans. That requires the surface temperatures to cool.
“From Bob Tisdale…”
OK, I think that explains a lot.
Really this doesn’t seem complicated to me. An El Niño releases heat from the ocean – resulting in a temporary surface warming. A La Niña takes surface temperature and put’s it in the ocean. The conservation of energy means that this cycle cannot cause warming, all it does is produce wiggles in the underlying trend.
It is a name for the absence of El-Nino phase which is what drives the planets temperature upward during its DISCHARGE phase. La Nina doesn’t change temperature changes at all as it doesn’t discharge anything it was named for the RECHARGE phase nothing more.
The temperature surfaces cooled because the pool of warm water is dissipating as El-Nino fades away and the inflow of cooler waters along the South American coast once again increasingly come back to bring it back to the usual cooler range it normally has.
““From Bob Tisdale…”
OK, I think that explains a lot.”
A pathetic, unwarranted comment.
“With La-Nina there is nothing…….”
Yep. It is the period where the tropical oceans are charging with solar energy.
Very little warming from 1980-1997
No warming from 2001-2015
Cooling from 2016-2023 (before El Nino.)
So Sunsettommy is absolutely correct.
Nothing happens during El Ninos.
That data proves that.
“Nothing happens during El Ninos.
That data proves that.”
You don’t notice all those dips in the data whenever there is a La Niña?
La Nina doesn’t discharge anything which is why the atmosphere with its small energy capacity cools down after El-Nino’s fades away.
La Nina doesn’t cause cooling or warming at all while El-Nino clearly cause step up atmospheric warming because of the increased outflow of energy from the surface waters for a time.
The small cooling is because of El-Nino’s dissipation from the region which means the atmosphere is getting less and less energy from the waters and from the incoming cooler waters from the south near the coastline as the warm pool thins out.
Sunsettommy:
You, and most others, are clueless about the cause of La Ninas and El Ninos.
I have an article that you need to read “The definitive cause of La Nina and El Nino Events”
https://10.30574/wjarr.2023.17.1.0124
The abstract reads: “Rather than being strictly random events, it has been proven that all La Ninas and El Ninos are caused by the increase or decrease of reflective SO2 aerosols in Earth’s atmosphere from both volcanic eruptions and industrial activity”
El Ninos and La Ninas do not determine the Earth’s climate.
The Earth cooled for 40 years by about 2.0C from the 1940’s to the 1970’s, all the while, El Ninos and La Ninas were doing their thing.
Something else, other than El Ninos, La Ninas and CO2 caused the 2.0C cooling during this period of time.
Should we assume this unknown cooling mechanism is no longer active today? I don’t think so.
Can you post a link to the global average temperature dataset that shows 2.0 C of cooling from the 40s to the 70s?
I have boldened the word global to drive home the point that I’m expecting a global value. And by global I mean the entire Earth and all 510e12 m2 of it so that we can compare it to other global average temperature datasets like that from UAH or GISTEMP or whatever.
Silly question.
You make a claim about the global average temperature. I ask for the data you used to make the claim. You say my question is silly. Make that sound rational.
“El Ninos and La Ninas do not determine the Earth’s climate.”
Which is what we keep saying. So why don’t you point this out to Sunsettommy and others who claim they do?
I pointed it out. You quoted me on it.
“The Earth cooled for 40 years by about 2.0C from the 1940’s to the 1970’s,”
I think you got the decimal point in the wrong place there.
I make the anomaly a cooling of 0.3C max.
Bogus, bastardized Hockey Stick charts are all you have. Do you realize that?
What would you have to say without that bogus Hockey Stick chart? Anwer; You wouldn’t have anything. Keep trying to sell it, but I’m not buying it.
“but I’m not buying it.”
That’s your problem and not sciences. Nor anyone with a rational non-conspiratorial mind set.
Show be a legit one (IYO) so I can have a laugh.
Wow. Just…wow.
Great to see you finally figured it out.
Do you DENY what the UAH data shows ?
Seems that you do DENY..
It is all the alarmist stooges have… DENIAL of real data.
Each adjusted pause is 0.2-0.3C warmer than the last one.
Are you accusing Spencer and Christy of fiddling the data?
Yes, it is a step function rather than actually a linear trend.
Which is expected.
And step functions no doubt happened during the warming that occurred during the period from 1910 to the 1930’s.
But after the 1930’s, the temperatures cooled for four decades.
Something else besides step functions and CO2 caused the warming and the cooling, then and now.
CO2 is not the only thing modulates the global average temperature.
I would agree.
Good. Can you help me explain that to other WUWT participants?
Wait, what pause?
Multiple pauses?
How many have there been, for the record?
Well , from 1980-1997
From 2001-2015
From June 2015 to now (zero trend)
So nearly ALL the satellite record.
[ Enter “answer questions literally” mode … ]
Four.
The start- and end-dates are in the “Legend” of the attached graph, in “Month / Last 2 digits of the Year” format.
The September 2023 value of +0.9°C has shortened the “latest / current” one, not (on its own) eliminated it.
Still a non-positive trend back to June 2015
“answer questions literally”
And the successive levels of the pauses were -0.3, -0.18, 0.0 and 0.28C.
Where’s the pause in CO2 emissions?
In the Deeeep oceans!!!
Trenberth said so, so it shall be written and laughed at as there is no credible transport capable of pushing negligible warmed Back radiation surface water into rapidly deeper colder waters with known enormous heat capacity and where heated waters are by nature always moving upward towards the surface it is why the waters deeper are very cold, no shit sherlock!
LINK
Warmer water is naturally more buoyant than cooler water which sinks long known in science circles except climate scammers who suddenly doesn’t know.
The surface back radiation warming stupidity never fades away.
Yep. I don’t know where Monckton has gone the last couple of months, but there’s no reason he needs to stop posting. Afterall, and like you say, we are already in the midst of a new a pause that he could be advertising.
Hopefully it’s not health issues, but I suspect he’s smart enough to see that the writing is on the wall and has been for the last 6-months.
Given ENSO, etc, his ‘pause’ was always going to reduce, month by month, so he just stopped posting his nonsense.
Until next time.
Explain why ever increasing CO2 goes on frequent back radiation vacations will you? Until you can do that, all pauses in global warming expose nonsense.
No one says CO2 is the only factor influencing global weather. Short-term pauses and rises in global warming are to be expected. Overall, it will warm.
LOL the lying from warmist/alarmists never cease to amuse me.
“Overall, it will warm”
I wonder if some people were saying that in the 1930’s?
Some people probably thought the extreme heat would go on and on.
But what happened next was four decades of cooling to the point that by the 1970’s, fears were being expressed that the Earth was entering a new ice age.
And this cycle happened before that, too, with the highpoint being in the 1880’s. So two cycles of warming and cooling, all of equal magnitude, and now we have decades of warming that has brought the temperatures back up to the level of the 1880’s and 1930’s, and it looks to me like we should expect that in the not-too-distant future, the temperatures will cool like they did after the last two high-temperature periods in the past
The Earth’s climate is a cycle: It warms for a few decades and then it cools for a few decades, and then it repeats, and the difference between the warmest periods and the coolest periods is about 2.0C
Here’s the US temperature chart to help you visualize this cycle:
Hansen 1999
Followed swiftly by:
🙄
Are the two statements incompatible?
You can be smart and wrong at the same time.
“You can be smart and wrong at the same time.”
Yet you manage to be DUMB and WRONG with every post you make.
Is it just bad luck ????
Or do you try very hard at it.
If he’s publishing nonsense your implication is that he’s not smart.
Like you.
When all you have is a hammer, everything looks like TheFinalNail.
“nonsense” suggest’s you don’t believe it’s a mistake.
“Given ENSO”
Yep.. the only time there is warming is at El Ninos.
Glad you finally figured it out. 🙂
Even with this month’s natural El Nino spike… (in the absence of any proven human causation)
There is still a negative trend back to June 2015.
Check the facts.. or ignore them. 🙂
This current El Nino is not typical and is forecasted to be short lived, and end in the Spring. Then a La Nina for next summer and fall.
Joe Bastardi says that if the conditions shown in the image above come to pass it will be “the hurricane season from hell” with the Gulf being ground zero.
Red marks for showing a long range SST forecast. What a bunch of maroons.
JB also said back in 2011 the planet would cool to the same temperature it was in the late 70s.
Since then the 13m average has increased by 0.45 C and two new record highs have occurred.
Very hard to find a better hurricane forecaster than Joe Bastardi. And he has forgotten more about the weather and forecasting than you will ever learn.
No forecaster has a perfect record and Joe admits his mistakes instead of the likes of you alarmists.
Joe Bastardi knows weather history. Maybe better than anyone. His forecasts are based partly on weather patterns repeating themselves.
So, what is the significance of wrong predictions?
Is it worse to make a bunch than just one or a few?
Does it mean a person has no idea what they are talking about and no one should listen to what they say?
Or maybe just not put any faith in their predictions?
And also, did JB give a timetable for his prediction?
You know, Joe makes a good living as a long range forecaster on the open market. His livelihood depends on Weatherbell’s performance.
Anyone that is not an idiot would not argue about his capability in his field.
No forecaster is ever right all the time. Joe says it is God’s way of humbling him. But Joe is good enough to make good living doing it in the COMMERCIAL sector where performance and being correct more often than not is the key to success. Unlike academia and the government.
No one is correct all the time, and if we do not know the timetable of the prediction from JB that is referred to, we cannot even evaluate if he has even been wrong yet.
Earlier this year, their was a monthly average that was about the same as a month from all the way back in 1980.
I doubt that that value was last time we will see months as low as that, and doubt we will not see any more months that are much lower than January 2023 was. If this spike follows the pattern of 1998 for example, in about two years we will see the lowest month in over a decade.
And then there is the fact that this is one prediction, but out of how many?
If someone makes a large number of predictions, and one or a few turn out incorrect, but the rest verify, that is not the same as being 0 for 1, or 0 for 50, or 0 for 100.
Warmistas are batting a perfect zero regarding predictions.
Based on that, we should expect that by a couple of years from now, lakes Mead and Powell will be full or overflowing, and the UAH will be way below the zero line and falling.
Warmistas make a good living too, and they do not have to worry about ever being correct.
In fact they never have been, but they sure do act as if they have been getting all of their predictions right all along.
They get everything wrong, and I mean EVERY THING, and then put on this smug act as if they not only know what they are talking about, but are really good at what they do.
They have a perfect record of failure, never acknowledge that fact, and just keep doubling down on stupid while pretending to possess received wisdom.
“JB also said back in 2011 the planet would cool to the same temperature it was in the late 70s.”
That would be logical. It would certainly follow the cyclical weather patterns of the past.
I don’t think Joe claimed the cooling would begin in 2011. He just said that when the cooling phase kicks in, it will get as cold as it did in the 1970’s, when people thought a new ice age was upon us.
But don’t fear, I lived through the “cold” 1970’s and it wasn’t that bad. It was hard to tell it from previous decades when it was warmer. Maybe a little more snow. Nothing to freak out about.
“Hopefully it’s not health issues”
I hope so too, but it would be a possibility. There’s no reason why he wouldn’t be posting just because the pause is receding. Last time he kept it going right up to the end.
No, the pause is fading away and likely gone next month or two which is why he will not talk about it anymore for a few years ahead.
He doesn’t have to be silent though. If reality behaves inline with expectations then the 2023/09 value will be part of a new and very long pause.
still a non-positive trend back to June 2015
You will always find intervals with flat or falling trends in a highly stochastic time series with an increasing long term trend.
Moncktons excersise is like reading the daily temperatures outside his living room each spring and when he see a few days with falling temperatures, he to predict that the summer is cancelled.
That sums it up pretty well. And his prediction in August 2013 of 0.5 C of cooling has failed spectaculary.
He does it to show how CO2 which is always going up every year doesn’t continue warming trend between El-Nino phases at all.
8 years pause is a long time had one even longer a few years earlier Monckton pointed out.
The obvious question, Does CO2 take long vacations from its postulated warm forcing activities?
we went out to get donuts this morning and had a nice walk along the river.
Let me guess – you got ThFinalNail and Nick Stokes.
Yawn. Month-to-month or short term spikes are relatively meaningless, as are short term troughs. Not climate, just natural variability. Since we don’t know the long term effect on the running average trend, only alarmists, politicians and the media will be excited over this spike. (Then likely disappointed later)
It’s just that the troughs tend to be around where the spikes where at the start of the UAH record. Confirmed by the all- important trend.
So long pauses followed by sharp El Nino spikes is caused by humans.
Would love to see the scientific explanation behind that. 😉
What? That is rich coming from “Mayor of Looney Town.” You are yet to come up with any “scientific evidence” for your theory that Enso is the cause of the warming, despite being called on it numerous times. Care to try now?
So, the simple one still yaps mindlessly.
Here is every one of his fellow AGW stooges saying “the El Nino warming”
… and praying desperately for some more El Nino warming.
And the poor little mite still hasn’t figured it out.
Hilarious. 🙂 🙂
Care to produce scientific evidence of any human causation for El Nino warming spikes ???
Once again nothing. All jibber jabber. What a monumental mouth you have with nothing behind it.
“Once again nothing.”
The sum total of your posts.
Why continue to draw attention to that fact ?
Care to produce scientific evidence of any human causation for El Nino warming spikes ???
Simon can’t answer it but Bob Tisdale did many times showing that it is El-Nino’s that is driving the warming trend.
Bob Tisdale blog,
Does The Climate-Science Industry Purposely Ignore A Simple Aspect of Strong El Niño Events That Causes Long-Term Global Warming?
LINK
“Simon can’t answer it but Bob Tisdale did many times showing that it is El-Nino’s that is driving the warming trend.”
Well come on the Einstein….Explain to me why the earth is not perpetually warming, because El Nino’s have been around for ever. Sorry that is another fail.
Oh dear, the brainless simpleton yaps again. Always a FAILURE.
The SUN hasn’t always been in a grand solar maximum period like most of the last 70 years.
Even SC24 and 25 have been quite strong.
You do realise that it is THE SUN that provides most of Earth’s energy, don’t you.
And that CO2 PROVIDES NONE
You are wrong. GHG theory has an infinite series of increases. Back radiation heats the surface causing more radiation to CO2, back radiation increase in turn, the surface warms more causing even more radiation, back radiation increases and in turn, the surface warms more and more, ad infinitum! No end in sight. Night is all we have to keep us from boiling tomorrow.
bnice2000:
Both the 1997-98 and 2014-16 El Ninos were caused by human activity.
1997-98 El Nino was caused by the Clean Air Act reduction of ~6 million tons of industrial SO2 aerosol emissions. With less pollution in the air, temps. warmed up.
The 2014-16 El Nino was caused by a Chinese 2014 edict to reduce industrial SO2 aerosol pollution. A decrease of 23 million tons occurred. Again, warming for the same reason.
It is too soon to determine with certainty whether there is any additional human augmentation of the 2023 El Nino, but it appears that there may be.
You’d have to resort to reading books. Is that OK with you?
So you admit you are totally incapable of providing a rational explanation.
We already knew that !!
No need to highlight the fact.
TFN was thought to be a reasonably well informed individual up until he made this comment. https://wattsupwiththat.com/2023/09/16/climate-fact-check-august-2023-edition/#comment-3785388
I was never under any delusion that Rusty was anything but a mindless AGW stooge, incapable of presenting anything remotely resembling scientific evidence.
I find no fault with TFN’s post there. What are thinking is wrong there?
Because bdgwx, TFN is claiming that the spike is caused by ocean’s releasing built up heat from CO2. It’s the fact that he says this with great certainty. That’s my main criticism of the other side: they give over-simplistic answers and as a result, we don’t get to learn anything new about the climate.
Actually TFN said it is from excess heat stored from GHG and other human forcings. CO2 is but one among many of these forcings. And there is nothing wrong with that statement. GHGs and aerosol reductions result in a positive EEI. The ocean takes up the imbalance. ENSO modulates the ebb and flow of the transfer of heat/energy to/from the atmosphere. The consilience of evidence backs this up.
Don’t hear what isn’t being said. No one is saying that the Sun isn’t also a modulating factor. It is. No one is saying that ENSO isn’t also a modulating factor. It is at least on short time scales. There are a lot of factors that influence the flux of energy in and out of the TLT layer. It’s just that human modulated GHG and aerosol changes are the dominating factor in the long term trend.
I’ve asked you over and over again as to what reasoning comes to this conclusion and you provide me with some model. The same model that says we wouldn’t be warming if not for CO2. That is over simplistic thinking.
My model doesn’t say we wouldn’t be warming if not for CO2. It only says that the inclusion of CO2 is not inconsistent with the observed warming.
For a very brief summary of the consilience of evidence see IPCC AR6 WGI Physical Science Basis. It is only about 2400 pages so you get through it in a reasonable amount of time. For the details drill down the 10,000+ first order citations and the hundreds or even millions of secondary and tertiary citations. Obviously you have be selective with the details since the body of evidence is so expansive.
If you have specific questions I can try to answer them or point you to specific publications that can answer them.
Thanks for the link.
I will admit I am uninformed. Do you think I’ll be an ‘expert’ after all of this laborious reading?
I don’t think anyone can ever be an expert in all of the facets of science involved. There’s just too much there.
It is a model using the UNPROVEN ASSUMPTION that CO2 causes warming
It is FAKE, MEANINGLESS model.
“said it is from excess heat stored from GHG and other human forcings.”
Presenting absolutely ZERO evidence.
So he is living in his own little non-science la-la-land..
OK !
Thanks for the confirmation.
I am sorry but just how does CO2 warm the oceans? It’s radiation can’t penetrate but um before evaporation occurs. What is the attribution of H2O to warming the atmosphere? H2O from ENSO evaporates with latent heat that doesn’t raise temperature or radiates which might warm CO2 slightly.
I have read a lot about ENSO lately. ENSO obviously raises the SST, but how much warming of the atmosphere it does is limited from my research. Averaging SST and land temperatures gives a false impression of what is happening. SST increases are just not attributable to CO2.
“It’s just that human modulated GHG and aerosol changes are the dominating factor in the long term trend.”
How does that apply to the warming of the 1880’s and the 1930’s? Both previos periods warmed to the same magnitude as the magnitude of the warming today.
There was no Clean Air Act in the 1880’s or the 1930’s, and CO2 was a smaller percentage of the atmosphere, yet they had no apparent effect when the temperatures warmed and then cooled during these periods of time by about 2.0C
Your assumptions about CO2 warming do not apply to past periods of history, so why should it be assumed that it applies today?
We are in a period of warming, from unknown casuses. Next up: A period of cooling, if climate history is our guide.
Here’s a chart showing the cyclical nature of the Earth’s climate:
I’m not intricate in the differences between the temp data sets, but why didn’t you use hadcrut4 and include all of the data? If you had, then your 1860-1880 data would have trended up at ~1.1 degC/century, with a standard error of~0.2 degC/century. Your 1910-1940 data would have trended up at ~1.27 degC/century, with a standard error of ~0.08 degC/century. But the 1975-present data would have trended up by ~1.78 degC/century, with a standard error of ~0.04 degC/century.
Channels the kids song:
“One of these is not like the other….”
Just because humans can modulate agents that effect the global average temperature does not preclude nature from doing so as well. It’s the same in the other direction as well. Just because nature can modulate agents that effect the global average temperature does not preclude humans from doing so as well.
Averaging SST and land temps should be a questionable practice. The GHG’s may warm the land, but not the oceans. Therefore the causes are different and should not be conflated via averaging. Averaging in climate science is becoming abhorrent.
TFN has provided absolutely ZERO evidence
He is totally incapable of doing so.
What trend?
Can you identify the period of human civilisation on that chart please?
It’s sort of important to the story.
Yep, it is the coldest part at the right-hand end, with the least atmospheric CO2.
Doesn’t that chart suggest it isn’t?
Suddenly humanity defies all of known geological history?
Is that seriously what you are saying?
Well they certainly seem to believe that humanity drives the weather and climate!
This graph, along with the famous Vostok and Law Dome temperature records, pretty much puncture the CAGW myth.
It’s 10 percent warming in the desert southwest this summer compared to last year as measured by cooling degree days. Does that mean next year will be as warm or warmer? The adapted flora and fauna are not waiting for the answer.
….warmer in the desert southwest
Firing off all those directed energy weapons at food processing facilities, forests, prime real estate in Hawaii and anywhere else they need a tragedy is bound to show up in the data sometime.
Directed energy weapons? That’s a new one for me.
I want to know who “they” is.
The September global LT temp is 0.7C above the latest 13-month average. This also happened in 1998 (you have to look at the average 6 months earlier to exactly match the situation), and it suggests that we have seen another short-term spike.
If that was a stock market chart, it would definitely be time to sell! Or even go short.
That short term spike from El Nino is what really gets the alarmistas going like chattering monkeys. 🙂
They absolutely rely on it for their “CO2 warming”… yet cannot explain how it is caused by CO2.
It is very funny to watch. 🙂
Obviously someone thinks they can explain how CO2 causes sudden warming spikes only at strong El Nino events.
We await the explanation. 🙂
Do try to include some actual science. 🙂
It will not happen since CO2 doesn’t drive El-Nino’s at all.
You know that,
I know that.
But they are still vainly trying to come to grips with anything remotely related to reality…
… and probably never will.
Not so much chattering monkeys as chimpanzees flinging ‘stuff’
And the beat goes on:
This graph indicates seismic activity might be the driver to increased ocean temps. When water gets heated at depth by a volcano, the ocean doesn’t lose it very fast. The temperatures in the polar global and farther north regions of North America are up which says it is increased water vapor as the cause, not CO2.
Remember air that is 3 degrees (C or F) above average when it is very cold contains a whole lot less heat than tropical air at .5 degrees higher. So the real measure should be atmospheric heat content, not absolute temperate. And with winter coming on in the NH, Arctic temperatures can drop like a rock pretty quickly. Let the air sit in a high pressure dome with out any winds and see how fast the heat radiates out into space.
iirc, the ocean current near Tonga goes straight down to the Antarctic, then circulates back up passed Peru.
Of course, a massive underwater eruption doesn’t add any energy to the water at all. 😉
Only a tiny feeble back-radiation from CO2 can do that. 😉
Show said that graph is just about volcanoes? There is a lot more to abyssal geothermal activity than volcanoes. But I wouldn’t expect any alarmist to look into it, any more than I would expect the IPCC or the various western governments to do so.
Yep, well aware how well the Ocean seismic activity charts with temperatures… 🙂
Have posted this chart many times.
Just saying that a massive underwater volcano like HT must have caused some warming of the oceans.
If volcanic activity is increasing, it follows that submarine volcanic activity is increasing.
Yes, but there is more to it than that!
The_Relationship_Between_Mid-Ocean_Spreading_Zone_.pdf
rah.. unfortunately, the link doesn’t work.
Pretty sure I have seen this work elsewhere, though.
try again. This time I will just provide a link to where Dr. Viterito’s papers are located.
Arthur Viterito’s research works (researchgate.net)
Thanks, far better correlation than CO2
But you won’t see that fact of the alarmist blogs. 🙂
Also has a strong causation factor (which has never existed with CO2)
oh look, someone doesn’t like actual data.
Must be an AGW stooge ! 😉
Strange looking XY.
I distrust any of these so-called Ocean Heat Content graphs. The oceans are simply too vast and heterogeneous, and the temperature differences far too small, for changes to be detectable.
So you deny that there or deep ocean heat waves?
Anyone that has done some swimming in a lake knows that they will hit cold spots much cooler than the ambient that dominates.
You make my point for me. The temperature of the oceans vary dramatically over distances and depths of a few metres to hundreds of kilometres. Without knowing the temperature of every cubic metre of the ocean there is simply no way to calculate the overall heat content with any accuracy or precision.
Dr. Spencer and Dr. Christy believe it is possible to calculate the overall heat content with sufficient accuracy and precision to estimate the climate sensitivity.
[Spencer & Christy 2023]
Their opinion is based on computer models.
I was struck by this admission in the paper:
The diagnosis of EffCS from climate models is hindered by the tendency of ESMs to not conserve energy, either in the ocean or top-of-atmosphere, a feature which has persisted from CMIP3 (Spencer and Braswell 2014), CMIP5 (Hobbs et al. 2016), to CMIP6 (Irving et al. 2021). This is a fundamental concern since global warming is first and foremost an issue of energy conservation.
Do you still trust models?
They didn’t say that in the publication.
I trust them no more or less than supported by evidence. They are useful despite being imperfect. I also don’t form my position around any one particular model or even model type. I use the consilience of evidence approach.
Still no trees growing under glaciers in the NH !
Right. What?
Poor petal, you never did explain how trees grow under glaciers…
or figure out just how much warmer it must have been when they grew 1000 years or so ago..
Want to have a try now?
No way in hell Rusty will touch that. He just clings to there being a warming trend therefore the world is ending.
Here’s the photo Rusty hates so much.
Climate alarmists think trends will go on forever.
It cooled significantly in the 1970’s and climate alamists thought this trend would go on forever. Then it warmed up.
Now it has warmed significantly, and climate alarmists think this trend will go on forever.
The historical trend is our friend. It shows moderate temperature changes over a period of decades, sometimes warmer, sometimes cooler.
The CO2 obsessed have seized upon the current warming trend as being evidence that CO2 is causing the temperatures to rise. But CO2 does not explained past similar temperature rises. This time it’s different, say the climate alarmists.
We shall see.
Unless one BELEIVES that a trend is going to continue, and in the climate case forever, you are left guessing as to when it will change. Alarmists insist it will continue until the earth boils away it’s atmosphere and oceans.
We are in the U.S. and elsewhere, building electricity infrastructure to supply people living on the Atlantic, Gulf, and Pacific. Based on the trend, this will be stranded investment when sea levels rise due to continued CO2 warming. Why are the alarmists not complaining that no mitigation expense is being offered to leave these areas? If they truly believe the trend is irreversible we should be starting this soon.
Maybe people will revolt if they are inconvenienced enough, especially without real evidence. Like sea level rise from current warming.
However, there was no “trend” for almost 9 years, and there has not been a recent spike in CO2 emissions. There will most likely be an abrupt drop, as with other El Ninos, after the peak. The temperature changes are plateaus interspersed spikes like this. That is, while a trend can be fitted to the data, it is best described as a step function. Some thought should be given to what else is driving the temperature increase.
Exactly Clyde…the short term spikes must be caused by cloud cover and weather front variation…additional CO2 might explain the longer term trend of .19 C per decade, but that is about double the line-by-line calculated effect of CO2… but we clearly see the el Nino effect in the USH graph…. It is most likely that we are seeing at least half of the planetary warming as a result of changes in currents in the Pacific Ocean, possibly variations over 100 years or less, not yet revealed to us by stats. The Pacific side of the planet is an awfully big place with a big percentage of the water on the entire planet. The sea breeze that causes el Nino being pretty minor, yet the overall effect of el Nino being pretty clear. Overhead view of Pacific follows….
Germany reports a big spike in “sunshine days” this year.
Would be interesting to see the cloud cover index over the NH.
Could something in the stratosphere be affecting the amount of troposphere cloud formation?
Hunga-Tonga seafloor volcanic explosion in January. NASA predicted the possibility of a warming event later in the year. Read my post below with the reasoning for it.
“Hunga-Tonga seafloor volcanic explosion in January. NASA predicted the possibility of a warming event later in the year.”
“The year” was 2022. Not much happened.
Wrong, the end of 2022 was when the Antarctic sea ice started not to form as usual..
“The year” was 2022. Not much happened.
Incorrect, 2022 did see much anomalous weather events associated with the HT eruption.
2022 Antarctic Sea Ice sets record low
Warmest June in Texas ever recorded.
Record setting West Coast Blizzards.
I could go on and on.
We are still seeing it, and the effects will still persist next year.
It would be very unscientific to dismiss the many highly anomalous readings in the various global climate metrics that have been observed since the eruption, clearly the eruption is the only plausible cause, unless someone has a better one.
Oh man I liked those warm sunshiny days in Bavaria. The Frauleins would break out their sheer sundresses and others would be nude bathing down by the Isar.
You would have loved 1540 then – 11 months of drought in Europe and very warm everywhere 🙂
I don’t think they were wearing sun dresses or sunbathing nude back then though.
I also believe a large drop is likely.
A careful look at previous spikes, shows that the largest and steepest spikes up are followed by a downward spike that undoes all of the warming during the spike, and that post spike minimum typically occurs about two years after the initial peak.
The faster and farther the spike up is, the faster and farther the spike down is, and mostly, it winds up colder than it started out prior to the spike.
IOW, it is what one expects to see when a burst of thermal energy is released from the ocean, makes it’s way around the planet, and ultimately winds up being radiated away to space, with zero net warming. IOW, no accumulation of “trapped” heat remaining in the atmosphere.
So, how does this reconcile with the step up pattern that we all can see when we look for it?
Personally, I can see all sort of patterns the more I look.
Our brain can conjure no end of patterns from what we see.
I saw devils in the smoke of the Twin Towers fires.
Last January, only 9 months ago, was about the same as a month in early 1980.
So while it has mostly been trending warmer since 1980, it is impossible to argue that heat has been trapped and is accumulating in the atmosphere.
If that was happening, there could not possibly be an entire month where the entire atmosphere averaged no warmer than it was 43 years ago.
Meanwhile, there are zero specific locations on the ground that show anything like steady and relentless warming, with all recent years getting ever warmer.
I would very much like to see the up-to-date balloon data sets.
I can tell you for certain that a value lower than 0.9 C will occur in the future. That’s the inevitability of variation.
And yet the trend is +0.14 C/decade. So despite the ONI averaging 0.0 over the period of record the TLT layer still warmed.
If no heat/energy was “trapped” then how did the TLT layer warm?
And why is CERES reporting a positive net flux?
It matches expectations reasonably well so what’s there to reconcile?
I get it, logic is not your strong suit.
Can you provide details about what you feel is illogical?
Yikes!
Why aren’t the alarmists all moving to Alaska/Canada/Finland/Sweden/Iceland/Scotland/Norway before it’s too late?
Why are the warmest areas in the world experiencing the largest population growth?
Maybe (shudder) WARM is GOOD (shudder) for us humans that evolved in East Africa?
You can bet there will be an even larger number of private jets flying to the next COP-out meeting ! 😉
I am pretty sure every last one of them is already over their lifetime limit of four airplane flights!
The reptiles and desert plants aren’t complaining either, except for all the traffic congestion from people moving south. At least the extra weight of EVs will end the suffering on roadway strikes with quick kills.
Interesting that it is 65th warmest Arctic Ocean (i.e it’s cold) and Antarctic land and ocean are 15th warmest. This violates normal “Polar Enhancement” which is double or more increased warming rate above the global warming increase (due to the regions – particularly the Arctic- being the heat exhaust end of the planetary heat engine). This flags something abnormal having caused the abrupt warming elsewhere.
The fact tropical oceans are the 8th warmest reinforces the fact that the highs globally weren’t caused by the usual heating in the Intertropical zone. The monstrous Hung-Tonga seafloor volcanic explosion and injection of water vapour into the stratosphere in January comes to mind again. NASA thought this could happen .
https://www.nasa.gov/centers-and-facilities/goddard/tonga-eruption-blasted-unprecedented-amount-of-water-into-stratosphere/
I recently read a press release where the researcher was claiming 4X amplification.
Record September ocean surface temperature in the NH guarantees record snowfalls across NH land again in the next couple of months.
https://scrippsnews.com/stories/forget-fall-early-snow-hits-us-states-bringing-winter-advisories/
Big snowfalls at Mt Rainier
(2) Facebook
Snow in Italy, Argentina, .. forecast of bumper snow season in USA
La Leñas, Argentina Hit With 8 Feet Of Spring Snow; Winter Arrives Early In Madesimo, Italy; + NCAR Predicting Bumper Snow Season For Much Of The U.S. – Electroverse
Hunga Tonga. The gift that keeps on giving. It will be interesting to see how long the extra water vapour lasts.
There were estimates of several years.
If I recall the e-fold time was on the order of 10 years; maybe a bit less.
Here is a good lecture with the latest information. The e-fold time is actually closer to 3 years.
https://youtu.be/G9jwA-jv4DI
There may well be a linear trend number that can be calculated for the satellite age, but it doesn’t mean anything if the temperature doesn’t have an underlying linear nature – and we know that temperature tends to go in cycles with pseudo-random variations. IOW, the linear trend number is meaningless.
There is a visible cycle of about 1,000 years in the longer term global temperature record, ie, over the last few thousand years. (It doesn’t go for ever, climate isn’t like that). If that cycle continues – and we don’t know if it will because we don’t know its mechanisms – then we can expect another century of warming. That would give us another temperature peak in the sequence Minoan, Roman, Medieval, …
That doesn’t mean that there won’t be significant periods of cooling within the next century. And it doesn’t mean that the wonderfully productive Holocene inter-glacial period won’t end in a few thousand years time.
Let’s all enjoy the nice warm friendly Holocene while we can.
Wow I must say a massive rise from -0.04C in January to 0.90C September, this totals 0.94C over just 8 months.
The question is what has cause it.
Firstly it cannot be CO2 because the concentration in January 2023 was 419ppm and now in September 24th 2023 it is 418.29, a tiny tiny decrease. But allowing for a long term smoothing of the annual cycle it has increased (based on an annual increase of about 3ppm) has gone up by 2ppm. These increases are way too tiny to explain this massive rise in temperature and we can all agree upon that!!!
Secondly we have transitioned from a relatively weak La Niña to a developing which looks like to be a strong El Niño. This as we can all agree on this will cause some warming. But it can’t explain all of the 0.94C warming as the El Niño warmth does not appear until it starts to decay. This can been seen in the past Very Strong El Ninos (82/83, 97/98 & 15/16) and other smaller ones. El Niños tend to peak around November and December and the temperature usually spikes in the January and peaks anywhere between the January and April. Looking at the readings readings from September 1997 and September 2015, while at the time a massive El Niño was developing the temperatures did rise a little but nothing in comparison to what we have just observed. The timing of this warming is not completely consistent with El Niño as the warming is appearing about 6 months too soon. This is telling me that while transitioning from a weak La Niña to a developing El Niño cannot explain all of this warming.
The Tonga eruption while increased the stratosphere water vapour and therefore has a tendency to cause warming it also produced SO2 aerosols which cool so I suspect the two forcing cancelled each other out. In the August 2023 global temperature report from UAH did concede that Tonga eruption effect was only a few hundredth of a degree and can therefore be neglected.
I have therefore come to a logical conclusion that this massive 0.93C warming is not due to CO2, it can only be partially explained be transitioning from a weak La Niña to a developing El Nino (judging by the past it can maybe explain 0.3C) and finally the Tonga Eruption appears to be negligible.
I am open to other peoples theories.
“Part of the exceptional warming during the last two months was likely due to the loss of heat content from the tropical Pacific Ocean between mid-June and late-July. A portion of that heat- loss was likely fluxed into the atmosphere, causing the substantial warming in these two months, leading to their warmest values in the 45 years of record. Despite this heat loss, there is still a significant El Niño affecting the Tropical Pacific waters”
Source
I would agree with your analysis. That’s a lot of warming in a little less than a year. Any effect from CO2 is probably lost in the noise.
Do we have cloud data for these areas for that period ?
Germany has reported a large jump in the number of cloudless days.
I’m really not sure. Joe Bastardi has hypothesized that this is ‘decades worth of heat’ being pumped into the atmosphere.
I bet Germany’s lack of cloudiness is in some way tied to the very warm North Atlantic temperature anomaly recently.
Judith Curry has an excellent post on her blog. https://judithcurry.com/2023/08/14/state-of-the-climate-summer-2023/
perhaps the fact disliker would like to comment how CO2 causes extra sunshine. 😉
Also take note of Christy’s take on HT.
Don’t have full access at the moment.
Is the current El Nino “tongue” developing in the same area as usual.. or is it further south ?
That’s a good question …
… but unfortunately I, personally, do not have an actual “theory” that answers your original question.
I do, however, have a graphic that made me ask myself “What are the questions that need to be answered before ‘other people’ can come up with an explanatory ‘theory’ ?”.
Points for any “theory” to cover
1) CO2 can be used to “explain” the (small amplitude) underlying “long-term” trend, but not the (very large) short-term “natural variability” swings.
2) There is a clear correlation between ENSO (I used the ONI proxy, YMMV …) Pacific Ocean SSTs and the UAH dataset for lower troposphere temperatures … but there are many “minor to medium” size differences as well.
3) The last “Volcanos” red star is the Hunga Tonga-Hunga eruption in January 2022. While not obvious at this level of zoom, there is a long delay between the volcano going “Bang !” and tropospheric temperatures going “Whoosh !” …
4) ONI (/ ENSO / SOI) has had similar ramp-ups in the past without UAH “exploding upwards” like it has just done. Any “theory” that “other people” may want to advance will have to “explain” not just why the latest reaction was so “violent”, but also why all previous ONI “forcings” failed to produce such a reaction …
_ _ _ _ _
Me ?!?
Not the foggiest idea (yet), I’m still trying to get my head around all of the data …
Great post, a good little graph at the bottom showing how ENSO ONI changes correlates well with global tropospheric temperatures. The correlation does deviate during the periods of El Chichon 1982 and Pinatubo 1991, where the volcanic cooling overwhelms the ENSO effect. Tropospheric temperatures takes about 3-6 months to react to ENSO conditions. This takes me to the point of my comment one cannot blame ENSO entirely on the large natural warming we just observed because ENSO 3-6 months ago was only neutral.
There is a small gradual warming that appears to be going in fits and starts which is consistent with increasing GHG gases but it does not mean that it is the underlying cause.
There is a lot about the climate that surprises us such as this massive warming since January and a lot we don’t know!!
Its Hunga Tonga, clearly…
There was almost no SO2 from the eruption, but massive water injection all the way in to the Mesosphere. It does not matter what Christy or anyone says, Stratospheric effects are poorly understood. It would be impossible to increase stratospheric humidity by 15% without the effects. At least according to the emissivity and absorptivity of water vapor.
HT is the most obvious cause, until someone has a better explanation.
Thats science.
People chanting, Christy said it is not the cause, that is not science.
Tonga, may or may not be the cause. Someone needs to do a theoretical line by line calculation of how the radiation budget will change with at 15% increase in stratospheric H2O. Whether this is significant or not is a good scientific question.
But as I pointed out there is some other natural fixing happening aside from the current developing El Niño.
Open to some sound ideas 💡
I agree that the current El Niño does not seem to be strong enough (at least for now) to be the sole cause. See also my comment and SST graph at the bottom of this thread.
In a topic as complicated as “The Earth’s climate system” it is (very) rarely the case that one factor is “clearly” the sole “cause” of any individual (extreme) weather event.
Anybody loftily declaring “It’s clearly all due to X …” has an agenda, either planned or sub-conscious.
In science just because something is “obvious” doesn’t make it true “until” that better explanation comes along.
See : Quantum mechanics, both Special and General relativity, ….
_ _ _ _ _
Attached below is a “zoomed in” version of my previous graphic (scroll up 3 or 4 posts …), starting in 2015.
I’ve removed the CO2 and long-term trend lines for clarity … and added grid-lines and individual (monthly average) data-points to make it more complicated again !
Notes
1) The “obvious” correlation between ENSO (ONI) and UAH in my original graph (from 1979) isn’t so “obvious” here.
2) When trying to work out the “ONI peak / trough to UAH peak / trough” delays, it varies from 3 to 6 months. This complicates any “direct relationship / causal mechanism” conjectures.
3) It is unclear just how much of the “noise” in the UAH line (compared to the “smoothness” of the ONI line) comes from the different methodologies and how much from the multiple “unknown unknowns” (Rumsfeld, 1982) that modulate the heat energy transfer from the equatorial Pacific ocean surface to the (global) lower-troposphere.
4) Something, or more likely some combination of several things, is amplifying the UAH response to the most recent (since December 2022 / January 2023) “ramp up” in ENSO / ONI values, when compared to previous similar (in amplitude and/or rate of rise) “ramps”.
Nobody “knows”, with 100% guaranteed certainty, what all of those factors even are, let alone what “weights” should be assigned to each one.
OMG!!! Time to buy an EV. Sell the house and move to Fairbanks. Panic, fret, start protesting and holding signs on the downtown street corners. Join the just Stop oil campaign. Lastly, vote for Biden, because he knows climate change is an existential threat and “can” do something about it. <sarc>
Super El Niño on its way
https://www.cpc.ncep.noaa.gov/products/analysis_monitoring/enso_advisory/
If El Nino is a cooling event for the planet (temporarily warming for us) what is more important is to see where it lands when it’s over – just before the next one. However, that is still no answer to the cause of any background warming until all the other warm periods in history are explained away. All the temperature data can ever do is tell us what is happening, not why and not what will happen. None of that has changed since the birth of the co2 hypothesis.
I suspect they have jumped the gun. The anomaly is already down on last month when they made that prediction. Fundamentally, they have no clue and hoping to get a clue from their useless models is is just delusional.
They didn’t predict a super El Nino. Here is what they said.
As you can see they aren’t even certain that a strong El Nino will occur never mind a super El Nino.
And we’ve reached the stage where even a mild/moderate El Nino will bring new monthly warm records. It’s on the back of the long-term warming.
I agree. See my comment and graph at the bottom of the thread.
Just so I’m clear…are you saying you agree with Hans Erren and RickWill that the CPC predicted a super El Nino?
No. My comment was more general about such early predictions, as also seen in the widespread general panic in the MSM about a possible “super El Niño” this winter, and was based on (for example) the statement from:
US National Center for Atmospheric Research (NCAR) which is predicting El Niño strength of “+2.4 degrees C average over December, January, and February”; and which referenced two other predictions:
European Centre for Medium-Range Weather Forecasts (ECMWF) model, which predicted +2.35 degrees C; and,
Meteo France Seasonal Forecast, which predicted +2.41 degrees C.
My main point was to highlight the SST graph that I show near the bottom of this thread, illustrating a distinct difference between the current SST anomaly pattern in the Niño-3.4 region and the development of the very strong El Niño events in 1997-1998 and 2015-2016.
Wow!