By the CERES Team
In the last month, we have co-authored three papers in scientific peer-reviewed journals collectively dealing with the twin problems of (1) urbanization bias and (2) the ongoing debates over Total Solar Irradiance (TSI) datasets:
- Soon et al. (2023). Climate. https://doi.org/10.3390/cli11090179. (Open access)
- Connolly et al. (2023). Research in Astronomy and Astrophysics. https://doi.org/10.1088/1674-4527/acf18e. (Still in press, but pre-print available here)
- Katata, Connolly and O’Neill (2023). Journal of Applied Meteorology and Climatology. https://doi.org/10.1175/JAMC-D-22-0122.1. (Open access)
All three papers have implications for the scientifically challenging problem of the detection and attribution (D&A) of climate change. Many of our insights were overlooked by the UN’s Intergovernmental Panel on Climate Change (IPCC) in their last three Assessment Reports (AR), i.e., IPCC AR4 (2007), IPCC AR5 (2013) and IPCC AR6 (2021). This means that the IPCC’s highly influential claims in those reports that the long-term global warming since the 19th century was “mostly human-caused” and predominantly due to greenhouse gas emissions were scientifically premature and the scientific community will need to revisit them.
So far, the feedback on these papers has been very encouraging. In particular, Soon et al. (2023) seems to be generating considerable interest, with the article being viewed more than 20,000 times on the journal website in the first 10 days since it was published.
However, some scientists who have been actively promoting the IPCC’s attribution statements over the years appear to be quite upset by the interest in our new scientific papers.
This week (September 6th, 2023), a website called RealClimate.org published a blog post by one of their contributors, Dr. Gavin Schmidt, the director of the NASA Goddard Institute for Space Studies (NASA GISS). In this post, Dr. Schmidt is trying to discredit our analysis in Soon et al. (2023), one of our three new papers, using “straw-man” arguments and demonstrably false claims.
As we summarize in Connolly et al. (2023),
“A “straw man” argument is a logical fallacy where someone sets up and then disputes a position that was not actually made by the group being criticised. Instead, the group’s arguments or points are either exaggerated, misrepresented, or completely fabricated by the critics.”
In our opinion, while this rhetorical technique might be good for marketing, political campaigning, “hit pieces”, etc., it is not helpful for either science or developing informed opinions. Instead, we strive in our communications to take a “steel-manning” approach. As we point out in Connolly et al. (2023),
“Essentially, this involves addressing the best and most constructive form of someone’s argument – even if it is not the form they originally presented.”
With that in mind, we will first steel-man Dr. Schmidt’s apparent criticisms of Soon et al. (2023).
Steel-manning Dr. Schmidt’s criticisms of Soon et al. (2023)
In his latest RealClimate post, Dr. Schmidt claims the following:
- He asserts that one of the two Total Solar Irradiance (TSI) time series that we considered in Soon et al. (2023) is flawed, out-dated and unreliable. (As an aside, this was also one of the 27 TSI series we considered in Connolly et al. (2023) but he does not discuss this paper here)
- He claims that a 2005 paper by Dr. Willie Soon looking at the relationship between TSI and Arctic temperatures has been disproven by the passage of time.
- He argues that the “rural-only” Northern Hemisphere land surface temperature record that was one of the two temperature records we analysed in Soon et al. (2023) is not representative of rural global temperature trends or even rural Northern Hemisphere temperature trends.
Later in this post, we will respond to each of Dr. Schmidt’s claims and show how they are incorrect. But, first it may be useful to provide some background information on RealClimate.org.
How reliable is RealClimate.org?
RealClimate.org was created in 2004 as a blog to promote the scientific opinions of the website owners. It is currently run by five scientists: Dr. Gavin Schmidt, Prof. Michael Mann, Dr. Rasmus Benestad, Prof. Stefan Rahmstorf and Prof. Eric Steig.
Anybody with scientific training (or even just a careful reader) who actually reads our paper will be able to see that each of the claims in Dr. Schmidt’s recent blog-post are either false, misleading or already clearly addressed by our paper. Therefore, scientifically speaking, his post doesn’t contribute in any productive or meaningful way.
Instead, unfortunately, the goal of his post seems to be to try and stop inquiring minds from reading our paper.
If people were only to read his blog-post then they might be discouraged from even looking at our paper – and therefore wouldn’t find out that Dr. Schmidt’s alleged “criticisms” are without merit.
This type of pseudoscientific “take-down” of any studies that disagree with the RealClimate team’s scientific opinions seems to be a common pattern. For example, in November, they posted a similar “take-down” of our 2021 study that they disdainfully titled “Serious mistakes found in recent paper by Connolly et al.” That post summarized their attempted “rebuttal” of our Connolly et al. (2021) paper by Richardson & Benestad (2022).
Anybody who reads both Connolly et al. (2021) and Richardson & Benestad (2022) will quickly realize that their attempted “rebuttal” was also easily disproven. Indeed, two of our three recent papers explicitly demonstrate that Richardson & Benestad (2022)’s claims were flawed and erroneous.
Again, it seems that the goal of Richardson & Benestad (2022) and RealClimate’s accompanying post in November was NOT to further the science, but rather to discourage people from actually reading Connolly et al. (2021)!
Connolly et al. (2023) is our formal reply to Richardson & Benestad (2022)’s attempted rebuttal of our earlier Connolly et al. (2021) paper.
For anybody who is wondering what our response to Richardson & Benestad’s November 2022 RealClimate post is, we recommend reading the full papers themselves.
All three articles were published in the peer-reviewed journal, Research in Astronomy and Astrophysics (RAA for short).
- Connolly et al. (2021): here
- Richardson & Benestad (2022): here
- Our reply, Connolly et al. (2023): abstract; preprint here (final version is still being typeset)
Addressing claim 1: What is the most reliable TSI time series available?
A key challenge that is the subject of considerable ongoing scientific debate and controversy is the question of how Total Solar Irradiance (TSI) has changed since the 19th century and earlier.
It was only in late 1978, during the satellite era, that it became possible to directly measure the TSI from above the Earth’s atmosphere using TSI-measuring instruments onboard satellites.
Even during the satellite era, it is still unclear exactly how TSI has changed because:
- Each satellite mission typically only remains active for 10-15 years.
- Each satellite instrument gives a different average TSI value.
- Each satellite implies subtly different, but significant differences in the trends between each sunspot cycle.
These problems can be seen below:

We can see from the above that, even though the data from each satellite mission are different, all of the instruments record the increases and decreases in solar activity over the roughly 11 year “solar cycle” which is observed in many solar activity indicators.
However, because the individual instruments typically only cover 10-15 years and they show different underlying trends relative to each other, it is unclear what other trends in TSI have occurred over the satellite era.
Several different research teams have developed their own satellite composites by combining the above satellite data in different ways and using different assumptions and methodologies. See this CERES-Science post for a summary.
Some of the main recent composites are:
- “ACRIM” – The ACRIM group finds that in addition to the 11 year solar cycle, there are important trends between each cycle. They find there was a significant increase in TSI between each solar minimum and maximum in the 1980s and 1990s, followed by a slight decrease in the early 2000s. See e.g., Scafetta et al. (2019).
- “PMOD” – The PMOD group applies several adjustments to the data of some of the early satellite missions and uses different methodological choices and assumptions. They find there has been a slight decrease in TSI between each of the cycles, but that it has been quite modest. See e.g., Montillet et al. (2022).
- “RMIB/ROB” – The ROB group (previously called RMIB) argues that there has been almost no change in TSI over the satellite era other than the 11 year solar cycle. See e.g., Dewitte & Nevens (2016).
- “The Community Composites” – Dudok de Wit et al. (2017) offer two different TSI composites. One using the original satellite data implies a reconstruction intermediate between the RMIB and ACRIM composites. The other using the PMOD-adjusted satellite data implies a reconstruction similar to the PMOD composite.
For the pre-satellite era, we don’t have direct measurements. Instead, researchers have to rely on “solar proxies” that they hope are accurately capturing important aspects of changing solar activity.
Some of the proxies include: sunspot numbers, group sunspot numbers, solar cycle lengths, the ratios of penumbra and umbra features of sunspots, bright spots in the sun’s photosphere (called solar faculae), cosmogenic isotope measurements, etc.
Typically, the solar proxies are calibrated against the satellite measurements during the satellite era. The calibrated solar proxies are then used to estimate the changes in TSI during the pre-satellite era.
Already you are probably thinking this is a complex and challenging problem. You are correct! Although, some scientists act as if these problems have all been fully resolved, those of us who have been actively researching these problems for many years can tell you that it is a thorny and contentious subject.
Depending on (a) which satellite composite is used; (b) which solar proxies are used; and (c) what methodologies are used, different research teams can develop very different long-term TSI reconstructions.
For example,
- Matthes et al. (2017) is the one IPCC AR6 used – based on the average of two other TSI reconstructions – Krivova et al. (2007)’s “SATIRE” and Coddington et al. (2016)’s “NRLTSI2”. All three match well to the PMOD composite.
- Dewitte et al. (2022) is a simple reconstruction based on simply rescaling the sunspot number record to match the RMIB composite.
- Egorova et al. (2018) developed 4 different estimates. Each shows far more variability over the last few centuries than the IPCC estimates.
- In a 2019 NASA study, Scafetta et al. (2019) updated the original Hoyt and Schatten (1993) TSI reconstruction using the ACRIM composite. This is a somewhat unique reconstruction because unlike most of the other reconstructions that only use one or two solar proxies, Hoyt and Schatten used five solar proxies in order to capture multiple aspects of solar variability.
- Penza et al. (2022) implies that TSI has changed significantly over the past century or so, but not as much as the Egorova et al. (2018) or the updated Hoyt and Schatten (1993) reconstruction.
In Connolly et al. (2023), we analysed a total of 27 TSI reconstructions, including all of the above. However, in Soon et al. (2023), for simplicity, we focused on just two of the above reconstructions – Matthes et al. (2017) and the ACRIM-updated Hoyt & Schatten reconstruction.
Dr. Schmidt clearly does not like either the ACRIM composite or Hoyt & Schatten’s original TSI composite. We can understand why! It implies a much larger role for the Sun in the climate changes since the 19th century than the RealClimate team claims exist.
However, it is worth noting that Hoyt and Schatten (1993) was used as one of the 6 TSI series considered by the CMIP3 modelling project that the IPCC used for their detection and attribution analysis in their 4th Assessment Report (2007). This can be confirmed by checking the list of “SOL” (i.e., TSI) time series on pages 11-12 of the Supplementary Material for Chapter 9 of IPCC AR4 Working Group 1.
The CMIP5 and CMIP6 modelling projects that contributed to the 2013 and 2021 AR5 and AR6 reports did not consider Hoyt and Schatten (1993) as a potential TSI series. However, this seems to partly be due the influence of Dr. Schmidt. He was the lead author of Schmidt et al. (2011), i.e., the paper recommending the climate modelling forcings to be used for the PMIP3 and CMIP5 projects.
At any rate, as we mentioned above, in Connolly et al. (2023) we considered a total of 27 different TSI reconstructions and we still reached similar conclusions to Soon et al. (2023). So, the specific choice of Hoyt and Schatten is just one way to demonstrate that the IPCC was premature in their AR6 attribution.
Addressing claim 2: Was Soon (2005) wrong?
In Soon (2005), Dr. Soon noticed a remarkable correlation between the Hoyt and Schatten (1993) TSI series and Arctic temperatures from 1875 to 2000.
In a follow-up paper, Soon (2009) repeated his analysis using (a) a newer version of the Hoyt and Schatten TSI series that had been updated to 2007 and (b) NASA GISS’ Arctic temperature record from 1880-2007.
The comparison is shown below adapted from Figure A.1 of Soon (2009):

In this week’s blog post, Dr. Schmidt conceded that the fit looked ok in 2005, but he claims it no longer holds:
“But time marches on, and what might have looked ok in 2005 (using data that only went to 2000) wasn’t looking so great in 2015.”
Dr. Schmidt then showed a plot he did in 2015 using a different TSI record from that used by Soon. His reanalysis failed to identify a compelling correlation when applied to the updated NASA GISS Arctic temperature record.
On the other hand, also in 2015, as part of our analysis of Northern Hemisphere rural temperature trends, in Soon et al. (2015) we included our own update to the original Soon (2005; 2009) analysis.
Below is Figure 27(d) of Soon et al. (2015). The blue line represents Arctic temperatures, while the dashed red line represents TSI:

Dr. Schmidt’s attempt to update Soon (2005)’s analysis to 2015, by using a different TSI record, failed.
In contrast, Soon et al. (2015)’s update’s that used the updated version of the TSI used by Soon (2005) and Soon (2009) confirmed the original findings of the earlier studies.
Addressing claim 3: Is our rural-only Northern Hemisphere temperature record representative of genuine climate change?
Dr. Schmidt appears to be confused about the rural-only Northern Hemisphere temperature record that we used as one of two comparative temperature records in Soon et al. (2023) and also as one of five comparative temperature records in Connolly et al. (2023).
We are surprised that he does not seem to have understood how these temperature records were constructed, since the construction of all five temperature records was described in detail in Connolly et al. (2021), along with a detailed discussion of the rationale for each temperature record. Details were also provided in the Soon et al. (2023) paper he was criticizing.
However, perhaps he hasn’t actually taken the time to read Connolly et al. (2021) yet. When Connolly et al. (2021) was published, Dr. Schmidt was asked to comment on the paper by a journalist for The Epoch Times. According to The Epoch Times:
“When contacted about the new paper, Gavin Schmidt, who serves as acting senior advisor on climate at NASA and the director of the Goddard Institute for Space Studies, was also blunt.
“This is total nonsense that no one sensible should waste any time on,” he told The Epoch Times.
He did not respond to a follow-up request for specific errors of fact or reasoning in the new RAA paper.”
– The Epoch Times, August 16th, 2021
One of the key problems we were highlighting in Soon et al. (2023) was the so-called “urbanization bias problem”. It is well-known that urban areas are warmer than the surrounding countryside. This is known as the “Urban Heat Island (UHI)” effect.
Because urban areas still only represent 3-4% of the global land surface, this should not substantially influence global temperatures.
However, most of the weather stations used for calculating the land component of global temperatures are located in urban or semi-urban areas. This is especially so for the stations with the longest temperature records. One reason why is because it is harder to staff and maintain a weather station in an isolated, rural location for a century or longer.
As a result, many of the longest station records used for calculating global temperature changes have probably also experienced localized urban warming over the course of their records. This urban warming is not representative of the climate changes experienced by the non-urban world.
Urban warming that gets mistakenly incorporated into the “global temperature” data is referred to as “urbanization bias”.
It is still unclear exactly how much the current global warming estimates are contaminated by urbanization bias. In their most recent report, the IPCC stated optimistically that urbanization bias probably accounted for less than 10% of the land warming. However, they did not offer a robust explanation for why they felt this was so.
Indeed, as described in Connolly et al. (2021), Soon et al. (2023) and Connolly et al. (2023), several scientific studies have suggested that urban biases accounted for more than 10% of the land warming – and possibly much more.
Brief detour: background to how and why we developed our rural-only Northern Hemisphere temperature record
In Connolly et al. (2021), we attempted to resolve the urbanization bias problem by developing a rural-only temperature record that only used temperature records from rural stations or stations that had been explicitly corrected for urbanization bias. However, we faced two major problems that we had been trying to resolve for nearly a decade:
- There was a severe shortage of rural stations with temperature records of a century or longer.
- Many weather stations with long temperature records are contaminated by other non-climatic biases, such as station moves, changes in instrumentation, etc.
When we looked at how other international groups (including Dr. Schmidt’s group at NASA GISS) were accounting for the non-climatic biases in the data, we discovered that they were not making any effort to contact the station owners for “station history metadata”, i.e., information on any changes associated with the station over its record.
Instead, most groups (including NASA GISS), were relying on automated computer programs that tried to guess when station changes might have introduced a bias. These programs used statistical algorithms that compared each station record to those of neighboring stations and applying “homogenization adjustments” to the data.
In a series of three “working papers”, two of us (Dr. Ronan Connolly and Dr. Michael Connolly) had published in 2014, we described how:
- There were serious flaws in the homogenization algorithms used by NOAA, the group whose homogenized data NASA GISS used for their global temperature estimates. (https://oprj.net/articles/climate-science/34)
- There were also serious problems with the additional “urbanization bias” adjustment computer program that NASA GISS applied to NOAA’s homogenized data (see https://oprj.net/articles/climate-science/31)
- All of the published studies up until at least 2013 that purported to have ruled out urbanization bias as a substantial problem had methodological flaws that meant their conclusions were invalid (see http://oprj.net/articles/climate-science/28)
In April 2015, while we were visiting New York City (along with Dr. Imelda Connolly), we offered to discuss these problems with Dr. Schmidt at the NASA GISS offices and see if possible solutions could be found. Dr. Schmidt declined the invitation explaining that he was not very familiar with how NASA GISS’ global temperature dataset was constructed. But, he kindly arranged for us to discuss the working papers with Dr. Reto Ruedy who was the lead scientist in charge of NASA GISS’ temperature dataset (called “GISTEMP”) at the time. All four of us (Dr. Reto Ruedy, Dr. Imelda Connolly, Dr. Michael Connolly and Dr. Ronan Connolly) met in the iconic “Tom’s Restaurant” right beside the NASA GISS office building.

Dr. Ronan Connolly outside the iconic Tom’s Restaurant, New York City, after our three hour amicable and detailed technical discussion with Dr. Ruedy arranged by Dr. Schmidt. (April 2015).
Dr. Ruedy admitted that none of their research team had considered the various problems we had raised in our working papers. We asked him if he could see any problems with our analysis. He said that he couldn’t immediately, but he promised to e-mail us if he could see any mistakes in our analysis. Since he never e-mailed us, we assume that he couldn’t find any errors.
During our meeting with Dr. Ruedy, we warned him of a problem with NOAA’s homogenization algorithm which we call the “urban blending” problem, but others have called the “statistical aliasing problem”. Recently we have confirmed the severity of this problem in Katata et al. (2023).
We warned him that because of this problem, the urban warming biases in the data would become more deeply embedded in his global temperature estimates if he used NOAA’s homogenized version of the data.
He admitted that this was a problem, but he explained that the NASA GISS team in charge of the GISTEMP dataset were only allocated a limited number of hours per week to work on the data. So, he said that they had to trust that NOAA’s homogenization efforts were better than nothing.
We left our meeting with Dr. Ruedy quite disappointed to discover that even NASA GISS’ well-resourced research team didn’t know how to resolve these key scientific problems and were effectively just hoping that someone else was looking after the data.
We decided, if nobody else was going to try and properly resolve these problems, we would try.
At the time, NOAA provided two types of urban ratings associated with each of their Global Historical Climatology Network (GHCN) dataset – one based on local populations and the other based on the intensity of night-lights in the area. This was version 3 of the GHCN and NOAA kept it updated until late 2019. The current version of GHCN (version 4) does not include any urbanization metrics. So, for now our main analysis has focused on version 3. However, we are working on expanding our analysis in the future using version 4 – see Soon et al. (2018); O’Neill et al. (2022) and Katata et al. (2023) for more details on this later work.
We decided to sort all 7200 of the GHCN stations into three categories – “rural” stations are those rural in terms of both GHCN urban metrics; “urban” stations are those urban in terms of both metrics. All other stations we classify as “semi-urban”.
Immediately, we found several problems:
- Less than 25% of the GHCN stations are “rural”.
- Most of the rural stations had very short station records – often only covering 40-50 years or so.
- The few rural stations that had long records reaching back to the late-19th century or early-20th century were almost entirely in the Northern Hemisphere – and confined to a few regions: North America, Europe, East Asia and several Arctic locations.
- Many of the rural stations with nominally long station records often contained large data gaps and sudden shifts in the average temperature that could potentially be due to non-climatic station changes.
Most of the groups generating global temperature records from the weather station data rely on the temperature homogenization computer programs mentioned above to automatically adjust the original temperature records to remove “non-climatic biases” from the data.
If these homogenization computer programs were as reliable as many scientists have assumed, then these “automatically homogenized” temperature records should no longer be contaminated by non-climatic biases.
However, as we had discovered (and discussed with Dr. Ruedy in our 2015 meeting), these homogenization algorithms have serious statistical problems that introduce new non-climatic biases into the homogenized data.
In subsequent years, we have demonstrated the severity of these biases and statistical problems in several peer-reviewed scientific articles: Soon et al. (2018); O’Neill et al. (2022) and the recent Katata et al. (2023).
Therefore, we realised that the other groups analysing the weather station data were inadvertently making a major scientific blunder by relying uncritically on this automatically “homogenized” data.
Instead, to correct for non-climatic biases in the data, we need to start making more realistic experimentally-based corrections.
We decided to begin our analysis by identifying the areas with the longest rural records and the most information on the non-climatic biases associated with the data. We found that just four regions accounted for more than 80% of all the rural stations with data for the late-19th century/early-20th century. All four regions are in the Northern Hemisphere.
In our opinion, there was simply not enough Southern Hemisphere rural data to construct a global rural-only temperature series that would reach back to the late-19th century.
Therefore, we confined our analysis to the more data-rich Northern Hemisphere.
One region where we think we can expand our analysis in the future is for Europe (as we discuss in the papers). Currently, our European rural temperature analysis is confined to Ireland because we were able to obtain the key station history metadata for the Irish stations from the national meteorological organization (Met Éireann). However, in a recent paper, O’Neill et al. (2022), we carried out a large collaborative effort with scientists across Europe to compile the station history metadata for more than 800 weather stations in 24 European countries – see here for a summary. Most of these European stations are urbanized, but our preliminary analysis suggests that we should be able to use this metadata in the future to develop a more data-rich “rural Europe” temperature record.
How does our rural-only series compare to the standard “urban and rural” record?

The top panel shows the standard Northern Hemisphere land temperature estimates using all stations – urban as well as rural. The bottom panel shows our rural-only temperature estimate.
In Soon et al. (2023) – the paper Dr. Schmidt was complaining about – we consider both temperature estimates. We also consider two different TSI records – the Matthes et al. (2017) TSI series used for the attribution experiments in IPCC AR6 and the updated Hoyt and Schatten TSI series that we discussed earlier.
See below for a summary of some of our key findings:

Dr. Schmidt complains that our Northern Hemisphere rural-only temperature record is not reliable because,
“It’s not a good areal sample of the northern hemisphere, it’s not a good sample of rural stations – many of which exist in the rest of Europe, Australia, Southern Africa, South America etc., it’s not a good sample of long stations (again many of which exist elsewhere).”
This is a rather clever, but deceptive, misrepresentation of the data. Notice how he splits up his statement into two parts.
For the first part, he correctly says that there is “a good sample of rural stations” in other regions from those we analysed, but he neglects to explain that they are mostly stations with short records.
Indeed, if we look at the number of stations available in the year 2000, there are indeed many rural stations around the globe:

Then in the second part of his statement, he correctly says that there are many long station records outside of the regions we analysed, but he neglects to explain that they are not rural!
Below are the stations with data available in 1880. We have highlighted the three Southern Hemisphere regions he implied we should have also incorporated, i.e., Australia, Southern Africa and South America:

Do you see why Dr. Schmidt’s characterization of the available data was disingenuous?
But, what about other estimates of Northern Hemisphere temperatures?
In Soon et al. (2023), we were assessing the Northern Hemisphere land surface warming (1850-2018) based on the weather station data. However, in Connolly et al. (2023), we also considered an additional three Northern Hemisphere temperature series. One was generated from the Sea Surface Temperature (SST) data. The other two were based on temperature proxy data: (a) tree-ring temperature proxies or (b) glacier-length temperature proxies.
Dr. Schmidt claimed that our rural-only temperature series was not representative of Northern Hemisphere temperature trends. If he is correct, then presumably these other temperature estimates would show very different trends. Let’s see!

What do you think?
Obviously, they are not exactly identical. However, in our opinion, all three of these alternative temperature estimates are broadly similar to our rural-only temperature record.
Therefore, we disagree with Dr. Schmidt’s claim.
Finally, if you recall from the beginning, Dr. Schmidt didn’t like the second TSI series we analysed in Soon et al. (2023). However, in Connolly et al. (2023), we analysed a total of 27 TSI series.
For each temperature record, we carried out statistical analysis in terms of the “natural” and “anthropogenic” (i.e., human-caused) climate drivers that the IPCC used for their attribution experiments. The IPCC only considered two natural drivers – TSI and volcanic eruptions. We used all of the IPCC’s climate driver records, but we repeated our analysis using each of the 27 TSI series in turn.
In both Connolly et al. (2023) and Soon et al. (2023), we adopt a similar approach to the IPCC’s attribution analysis. That is, we compare the results you get by considering:
- “Only natural factors” (which the IPCC defines as TSI and volcanic)
- “Only anthropogenic factors”.
- “Natural and anthropogenic factors”
If you want to see the results from all of these combinations, we recommend reading the full papers. But, for simplicity, let us just compare the first two combinations.
In Figure 6 of Connolly et al. (2023), we compared the “natural factors only” fittings using three of the best-fitting TSI series to the “anthropogenic factors only” fits. See below:

The TSI record that Dr. Schmidt was complaining about is labelled here as “H1993”. But, notice how for each temperature record, we can obtain similarly good fits using other TSI estimates.
Conclusions
In Soon et al. (2023), we reached the following key conclusions:
“(1) urbanization bias remains a substantial problem for the global land temperature data; (2) it is still unclear which (if any) of the many TSI time series in the literature are accurate estimates of past TSI; (3) the scientific community is not yet in a position to confidently establish whether the warming since 1850 is mostly human-caused, mostly natural, or some combination.”
These conclusions are consistent with our findings in another two of our papers that were also published in the last few weeks – in separate peer-reviewed scientific journals and using different independent analyses.
That is, in Katata et al. (2023), we confirmed that the IPCC’s estimate of the extent of urbanization bias in the global temperature data was much too low. Meanwhile, in Connolly et al. (2023), we concluded that it is “unclear whether the observed warming is mostly human-caused, mostly natural or some combination of both”.
Dr. Schmidt and the RealClimate team apparently do not want you to read our papers. They seem to be afraid that if you did, their claims on climate change would no longer seem so convincing.
In contrast, we are not afraid of people reading papers that disagree with us. In fact, we encourage people to read multiple scientific perspectives and form their own opinions. We agree with J.S. Mill’s quote below:

Below are links to the papers we mentioned above. Feel free to read any of the ones that are of interest to you!
References mentioned
- W. Soon, R. Connolly, M. Connolly, S.-I. Akasofu, S. Baliunas, J. Berglund, A. Bianchini, W.M. Briggs, C.J. Butler, R.G. Cionco, M. Crok, A.G. Elias, V.M. Fedorov, F. Gervais, H. Harde, G.W. Henry, D.V. Hoyt, O. Humlum, D.R. Legates, A.R. Lupo, S. Maruyama, P. Moore, M. Ogurtsov, C. ÓhAiseadha, M.J. Oliveira, S.-S. Park, S. Qiu, G. Quinn, N. Scafetta, J.-E. Solheim, J. Steele, L. Szarka, H.L. Tanaka, M.K. Taylor, F. Vahrenholt, V.M. Velasco Herrera and W. Zhang (2023). “The Detection and Attribution of Northern Hemisphere Land Surface Warming (1850–2018) in Terms of Human and Natural Factors: Challenges of Inadequate Data”, Climate, 11(9), 179; https://doi.org/10.3390/cli11090179. (Open access)
- R. Connolly, W. Soon, M. Connolly, S. Baliunas, J. Berglund, C.J. Butler, R.G. Cionco, A.G. Elias, V. Fedorov, H. Harde, G.W. Henry, D.V. Hoyt, O. Humlum, D.R. Legates, N. Scafetta, J.-E. Solheim, L. Szarka, V.M. Velasco Herrera, H. Yan and W.J. Zhang (2023). “Challenges in the detection and attribution of Northern Hemisphere surface temperature trends since 1850”. Research in Astronomy and Astrophysics. https://doi.org/10.1088/1674-4527/acf18e. (Still in press, but pre-print available here)
- G. Katata, R. Connolly and P. O’Neill (2023). “Evidence of urban blending in homogenized temperature records in Japan and in the United States: implications for the reliability of global land surface air temperature data”. Journal of Applied Meteorology and Climatology. 62(8), 1095-1114. https://doi.org/10.1175/JAMC-D-22-0122.1. (Open access)
- R. Connolly, W. Soon, M. Connolly, S. Baliunas, J. Berglund, C. J. Butler, R. G. Cionco, A. G. Elias, V. M. Fedorov, H. Harde, G. W. Henry, D. V. Hoyt, O. Humlum, D. R. Legates, S. Lüning, N. Scafetta, J.-E. Solheim, L. Szarka, H. van Loon, V. M. Velasco Herrera, R. C. Willson, H. Yan and W. Zhang (2021). “How much has the Sun influenced Northern Hemisphere temperature trends? An ongoing debate”. Research in Astronomy and Astrophysics, 21, 131. https://doi.org/10.1088/1674-4527/21/6/131. (Open access)
- M.T. Richardson and R.E. Benestad (2022). “Erroneous use of Statistics behind Claims of a Major Solar Role in Recent Warming”. Research in Astronomy and Astrophysics, 22, 125008. http://dx.doi.org/10.1088/1674-4527/ac981c. (pdf available here).
- N. Scafetta, R.C. Willson, J.N. Lee and D.L. Wu (2019). “Modeling Quiet Solar Luminosity Variability from TSI Satellite Measurements and Proxy Models during 1980–2018”. Remote Sensing. 11(21), 2569. https://doi.org/10.3390/rs11212569. (Open access)
- Montillet, J.-P., Finsterle, W., Kermarrec, G., Sikonja, R., Haberreiter, M., Schmutz, W., & Dudok de Wit, T. (2022). “Data fusion of total solar irradiance composite time series using 41 years of satellite measurements”. Journal of Geophysical Research: Atmospheres, 127, e2021JD036146. https://doi.org/10.1029/2021JD036146. (Preprint here)
- S. Dewitte and S. Nevens (2016). “The Total Solar Irradiance Climate Data Record”. The Astrophysical Journal, 830 25. https://doi.org/10.3847/0004-637X/830/1/25 (Open access).
- T. Dudok de Wit, G. Kopp, C. Fröhlich and M. Schöll (2017). “Methodology to create a new total solar irradiance record: Making a composite out of multiple data records”. Geophysical Research Letters, 44(3), 1196-1203. https://doi.org/10.1002/2016GL071866. (Open access)
- K. Matthes, B. Funke, M.E. Andersson, L. Barnard, J. Beer, P. Charbonneau, M.A. Clilverd, T. Dudok de Wit, M. Haberreiter, A. Hendry, C.H. Jackman, M. Kretzschmar, T. Kruschke, M. Kunze, U. Langematz, D.R. Marsh, A.C. Maycock, S. Misios, C.J. Rodger, A.A. Scaife, A. Seppälä, M. Shangguan, M. Sinnhuber, K. Tourpali, I. Usoskin, M. van de Kamp, P.T. Verronen and S. Versick (2017) “Solar forcing for CMIP6 (v3.2)”. Geoscientific Model Development, 10, 2247–2302. https://doi.org/10.5194/gmd-10-2247-2017 . (Open access).
- N. A. Krivova, L. Balmaceda and S. K. Solanki (2007). “Reconstruction of solar total irradiance since 1700 from the surface magnetic flux”. Astronomy and Astrophysics, 467, 335-346. https://doi.org/10.1051/0004-6361:20066725 . (Open access).
- O. Coddington, J.L. Lean, P. Pilewskie, M. Snow and D. Lindholm (2016). “A Solar Irradiance Climate Data Record”. Bulletin of the American Meteorological Society, 97(7), 1265-1282. https://doi.org/10.1175/BAMS-D-14-00265.1 . (Open access)
- S. Dewitte, J. Cornelis and M. Meftah (2022). “Centennial Total Solar Irradiance Variation”, Remote Sensing, 14(5), 1072. https://doi.org/10.3390/rs14051072 . (Open access)
- T. Egorova, W. Schmutz, E. Rozanov, A.I. Shapiro, I. Usoskin, J. Beer, R.V. Tagirov and T. Peter (2018). “Revised historical solar irradiance forcing”. Astronomy and Astrophysics, 615, A85. https://doi.org/10.1051/0004-6361/201731199 (Open access)
- D.V. Hoyt and K.H. Schatten (1993). “A discussion of plausible solar irradiance variations, 1700-1992”. Journal of Geophysical Research Space Physics, 98(A11), 18895-18906. https://doi.org/10.1029/93JA01944 . (pdf available here)
- V. Penza, F. Berrilli, L. Bertello, M. Cantoresi, S. Criscuoli and P. Giobbi (2022). “Total Solar Irradiance during the Last Five Centuries”. The Astrophysical Journal, 937(2), 84. https://doi.org/10.3847/1538-4357/ac8a4b . (Open access).
- W. W.-H. Soon (2005). “Variable solar irradiance as a plausible agent for multidecadal variations in the Arctic-wide surface air temperature record of the past 130 years”. Geophysical Research Letters. 32, 16. https://doi.org/10.1029/2005GL023429 (Open access)
- W. W.-H. Soon (2009). “Solar Arctic-Mediated Climate Variation on Multidecadal to Centennial Timescales: Empirical Evidence, Mechanistic Explanation, and Testable Consequences”. Physical Geography. 30, 144-184. https://doi.org/10.2747/0272-3646.30.2.144 (pdf available here).
- W. Soon, Ronan Connolly and M. Connolly (2015). “Re-evaluating the role of solar variability on Northern Hemisphere temperature trends since the 19th century”. Earth-Science Reviews, 150, 409-452. https://doi.org/10.1016/j.earscirev.2015.08.010. (Preprint version)
- P. O’Neill, R. Connolly, M. Connolly, W. Soon, B. Chimani, M. Crok, R. de Vos, H. Harde, P. Kajaba, P. Nojarov, R. Przybylak, D. Rasol, Oleg Skrynyk, Olesya Skrynyk, P. Štěpánek, A. Wypych and P. Zahradníček (2022). “Evaluation of the homogenization adjustments applied to European temperature records in the Global Historical Climatology Network dataset”. Atmosphere, 13(2), 285. https://doi.org/10.3390/atmos13020285. (Open access)
- W.W-H. Soon, R. Connolly, M. Connolly, P. O’Neill, J. Zheng, Q. Ge, Z. Hao and H. Yan (2018). Comparing the current and early 20th century warm periods in China. Earth-Science Reviews, 185, 80-101. https://doi.org/10.1016/j.earscirev.2018.05.013. (Preprint version)
- G.A. Schmidt, J.H. Jungclaus, C.M. Ammann, E. Bard, P. Braconnot, T.J. Crowley, G. Delaygue, F. Joos, N.A. Krivova, R. Muscheler, B.L. Otto-Bliesner, J. Pongratz, D.T. Shindell, S.K. Solanki, F. Steinhilber, and L.E.A. Vieira (2011). “Climate forcing reconstructions for use in PMIP simulations of the last millennium (v1.0)”. Geoscientific Model Development, 4, 33–45, https://doi.org/10.5194/gmd-4-33-2011. (Open access).
Gavin Schmidt has demonstrated on numerous occasions that he is a liar willing to commit fraud. There is no rational reason to heed anything he says or writes..
Schmidt is the very last person to be complaining about “is flawed, out-dated and unreliable.”
Everything he has worked on is totally flawed and totally unreliable.
Shoki,
Those are extremely serious allegations. It seems to me that if one makes such a statement, strong evidence should also be provided. I don’t suggest that anything you wrote is false, but Gavin Schmidt is not a household name and many readers new to WUWT likely have not heard of him.
Go ahead and down-vote my comment, but please consider that if you would summarize some specific occasions when Gavin Schmidt lied and committed fraud, you would do us all a service and it is more likely that a casual visitor to this blog would take your opinion seriously.
Why should someone visiting WUWT take your claim seriously?
You have two big problems: Gavin Shit and Mikey Make it up Mann (spelling errors are delibrate).
I firmly believe that these two fraudsters will get their comeuppance sooner rather than later.
I need to bring attention the spelling of “Shit”, more correctly …. Schidt. 🙂
“spelling errors are delibrate”
So clever!
or juvenile.
Agreed, not a good look. But neither are data tampering or touting meaningless GCMs.
Meanwhile you overlook their poor science based positions over the years a big hit to your credibility.
Dr. Mannerless is a poor scientist who is a bad loser of court decision made against him and makes a bucket of money fully employed in State Penn for many years and able to publish a lot of books while he whines people libel him which he never seems to actually suffer from.
The Mann has an abrasive personality who insults qualified meteorologists and lies about weather events that gets a lot of publicity, he has been wrong so many times, yet people still kiss the ground he walks in.
Stokes demonstrates once again he has nothing worthwhile to contribute.
Doing homogenization programs in a non-blind manner has a vast possibility for bias. As the programmer has expectations as to what a “good” outcome is, the likelyhood of that bias being found is fairly high.
When Gavin said they “cherry picked” stations on his Twitter thread, it immediately resonated with me that he is deliberately misleading people by not disclosing that the majority of weather stations have been subject to inhomogeneous errors. Which is why people claim that urban heat island / sitting placement issues have only a small warming bias. Soon finding only handful of well sited weather stations showing cyclical trends with lots of natural variability just confirms that.
Gavin Schmidt believes that “carbon dioxide is responsible for 80 percent of the radiative forcing that sustains the Earth’s greenhouse effect” (https://www.nasa.gov/topics/earth/features/co2-temperature.html).
If the science is settled why does he bother to debate TSI with a denier?
Probably because he knows in his head that’s it not settled.
That is a strange and confusing claim he makes. I’m not sure that I follow the logic, but I think it may mean that non-condensing greenhouse gases (GHGs) are critical to sustaining a greenhouse effect (GHE).
If the non-condensing GHGs were missing, then the condensing GHGs (essentially water) would precipitate out eventually as snow. The much colder air would only support a much lower absolute humidity and the overall GHE would drop to 20% of its current heat retention.
Even if that may be true it’s a counterfactual impossible scenario with no practical implication to reality.
It doesn’t mean that 80% of the heat retained by the GHE is due to CO2 or that 80% of any observed warming trend is due to CO2. It doesn’t mean that doubling CO2 would nearly double the GHE. It may however be the propaganda goal that he has in mind.
My two cents. Remove CO2 back to 200 ppm, methane to a lower value, etc. what occurs? Not much.
Say temperatures fall 2 degrees. All we’ll see is more people moving south.
Not quite. Probably after the global famine and the nuclear wars, the 500 million survivors would need to live in the tropics, I’ll give you that.
Fortunately you can’t get CO2 down much below 290ppm no matter how much energy you waste on that pointless insane goal.
What Gavin is pushing is the ridiculous claim that CO2 concentration oscillates between 190 and 280 ppm and that drives varying GHEs. It is obvious that near clockwork “oscillations” have to be driven by astronomical factors.
CO2 concentration is an effect of varying insolation patterns. Colder conditions cause more CO2 to dissolve in the oceans. He has the direction of causation willfully wrong because of his political agenda.
Adjustments also included wrong way values
From the Climategate emails # – 2328
date: Wed, 3 Jun 2009 15:07:25 +010 ???
from: “Parker, David”
subject: RE: Tom’s thoughts on urban errors …
Everybody wants to add an estimate of what UHI bias might be into their error bars, but it seems to me that rather than trust folk lore that there is a uhi bias, they first need to find one systematically in the network. Until they do that, the former is just hand waving to appease the know-littles. Jim Hansen adjusts his urban stations (based on night-lights) to nearby rural stations, but if I recall correctly (I’ll send that paper shortly), he warms the trend in 42 percent of the urban stations indicating that nearly half have an urban cold bias. Yet error analyzers want to add a one sided extra error bar for uhi…..
Regards,
Tom
I hope Schmidt writes his blog posts NOT while on duty for NASA Goddard Institute for Space Studies!
Probably he does… But that is not the main problem. The main problem is that GISS is a small, obscure organization with an office in New York that abuses the good name of NASA.
GISS has nothing to do with the main organization of NASA that launches satellites in space and provides the best possible data to anyone who want them for analyses and interpretation. GISS is a different part of NASA that interprets NOAA (temperature) and NASA data in its own way.
The main starter of the warming panic, James Hansen, was the first director, Gavin Schmidt is his successor…
There is no problem with GIStemp, as Fig 2 of Soon et al shows:

Soon et al catcluated the temperature by an unrefined but basically correct method, and got about the same result as GISS and everyone else. I do this for global, every month and in advance of GISS, and also get essentially the same result.
Now I’m sure there will be a howl that station data is corrupted etc. It isn’t, of course. But anyway, GISS isn’t responsible for that. They just use the GHCN collection, like everyone else (including Soon et al).
Again the total DELIBERATE lack of understanding what the paper is all about
Yes, they had to find a way of recreating the farcical GISS data, first.
That required numerous fudges and mal-adjustments, just like GISS uses to create its farcical fabrication.
They then remove as many of the really bad URBAN sites as they can, and end up with something which is more in line with reality, but still has a significant amount of urban bias.
What is it, that you are so stupid you can’t understand?
Nick,
Why do you think that is relevant exactly? It seems that you believe that if global average surface temperature anomaly is rising by any non-zero amount, that substantiates all claims of climate catastrophe. Why do you persist in slamming down that straw man? Whether the data is tainted or not, the rise doesn’t constitute a climate emergency.
“Dr. Schmidt appears to be confused about the rural-only Northern Hemisphere temperature record”
I very much doubt that any reader could say what the record was, and how it was constructed, after that huge torrent of words. Gavin managed to dispose of it much more concisely:
“the supposed ‘rural’ NH land temperature record they put together with Soon is something beyond my imagining. Indeed, I have a very hard time understanding why anyone would put together an index consisting of Irish and US rural weather stations, together with Arctic weather stations and a smattering of Chinese stations (Soon et al., 2015;Connolly et al, 2021). It’s not a good areal sample of the northern hemisphere, it’s not a good sample of rural stations – many of which exist in the rest of Europe, Australia, Southern Africa, South America etc., it’s not a good sample of long stations (again many of which exist elsewhere). Rather it seems to simply be an index of opportunity – something that keeps the multidecadal aspects of the Arctic, greatly over emphasizes the rural Irish data (which would otherwise be too areally small to matter much), includes the US rural data because it happens to have an independent database just for CONUS (?), and includes a few (non-rural) stations from China, for no obvious reason at all (AFAICT).”
He’s right. The comparison made was between all NH land stations, and “rural only”, which was actually, as he said, just a collection of US and Arctic stations, with an odd smattering of Chinese and Irish stations. This is not representative, but more seriously is not a proper comparison. I don’t know why sceptics can’t comprehend the notion that if you want to infer something from a comparison, you have to compare like with like. That rural set represents a different region, and differences are probably due to that rather than the rural/urban split.
A particular thing is that their rural set had a marked peak in the 1930’s, whereas then all stations did not. But if you look at all stations in the regions they selected, they would also have a marked peak in the 1930’s, since that was a property of the US and Arctic regions. Conversely an all-NH collection of rural stations would have a much reduced peak. The difference is due to regional behaviour, not UHI.
Incidentally, why GHCN V3, which became obsolete 5 years ago? It makes all their data terminate in 2018.
What part of every NH rural station with a long history they could find is hard to understand?
Yes there are other rural stations.
Yes there are other stations with long histories.
But this was the biggest, most complete set of rural stations with long histories they could compile. Is it properly areally weighted? Perhaps not, but there was a specific goal when they compiled it, clearly stated and adhered to.
Maybe properly areally weighted indexes might be better, or if contaminated as the paper states, they might not.
What is completely disingenuous and unacceptable is for that slimey piece of s%%* Gavin to throw up misdirection and strawmen.
“What part of every NH rural station with a long history they could find is hard to understand?”
And they just happened to be in Ireland. Or maybe US. They couldn’t find a single rural station with long history in all of Europe? What about CET? Why China, of all places?
They give two maps of al stations. But why no map of their slanted selection of rural stations, so we could see where they in fact are.
But it all comes back to this basic issue of like with like. It doesn’t matter how excellent your stations are; if they don’t represent the same area, the comparison is worthless.
Gavin was spot on.
Not to be picky, but Ireland is not only in Europe but part of the EU,—causing UK Northern Ireland Brexit problems.
Think before responding with obvious nonsense.
“Think before responding with obvious nonsense.”
I don’t think Nick is capable of that.
Either of thinking… or typing of something that isn’t obvious nonsense.
So do you know what rural stations they found in Ireland?
Or anywhere?
So. that is a NO from Nick.
He refuses to identify any rural sites in Europe.
You have just ADMITTED that the 40% urban UHI contamination of surface data estimation is almost certainly way too low. !
What do you reckon , Nick, around 80%… especially if you include airports.
Making it totally unfit for use as a “climate” indicator.
Finally you are getting the picture.
Ireland temps….
Even with some urban contamination show a large warm period in the early/mid 1900s
WARMER than around 2000
Valentia would be one of the “not-so-urban-contaminated” sites.
Nick has totally FAILED to produce one bit of evidence to counter Soon et al.
Why is that ?
Why no indication of sites from elsewhere in the NH that they could have use?
“They couldn’t find a single rural station with long history in all of Europe? “
Any suggestions , Nick-pick?
Your comment is just a worthless gripe, pertaining to nothing..
Gavin was just complaining because he didn’t like the result.. Poor little Gavin. !
Why China of all places?
NH, Rural, long history??
Did the station meet those ONLY 3 requirements?
I know, Nick, you support of the “gang” and their extensive the use of “ex post facto” cherry picking. You have no problem with their unscientific processes and failure to provide ALL data.
Asking why China is really rich.
Well, Gavin says the stations aren’t rural. I don’t know how he knows, because Soon et al won’t tell us which they are.
Chine has a 20th century history of war and upheval, not of accurate temperature measurements.
Other disagree with you.
That is because your comments are based on ignorance
From that graph, it appears it was just as warm in the Early Twentieth Century in China as it is today.
No unprecedented warming in China. CO2 increases greatly over the time period, but no unprecedented warming in China.
There is no evidence that CO2 is anything other than a minor player in determining the Earth’s temperatures going by historical, written temperature charts like the one above.
The written, unbastardized temperatue record looks nothing like a “hotter and hotter and hotter” bogus, bastardized Hockey Stick chart profile. The one all the “experts” go by. Instead, the written record shows it was just as warm in the recent past as it is today, and that applies to every part of the world that keeps records.
We have two opposed temperature profiles. One is the bogus, bastardized Hockey Stick chart that makes it appear that temperatures have been getting hotter and hotter and hotter for decade after decade and today is the hottest time in human history.
The other temperature profile is the one represented by the chart above where it shows it was just as warm in the recent past as it is today.
There is much more CO2 in the atmosphere today than in the Early Twentieth Century, yet the temperatures are no warmer now than they were back then with less CO2 in the atmosphere. Logic should tell you that CO2 has had very little to do with regulating the temperatures over that period of time, being unable to raise current temperatures higher than in the past. At least up to this point. The alarmists have great faith that the temperatures will continue to climb. Time will tell. I’m skeptical.
“Yes there are other rural stations.”
Actually, I think you might find it difficult to get a long-term site in Europe that still meets the rural classification..
Perhaps Nick would like to suggest a few. 😉
You can’t really make a fair comparison if most stations either don’t have long records or are not rural. Connolly’s composites from all of these regions (China, Ireland, the U.S., and the Arctic) exhibited a cyclical trend even if there wasn’t a “peak” in the other two regions. You did not the read paper Nick.
“You can’t really make a fair comparison”
But they did make a comparison. Of all stations in the NH with essentially CONUS rural stations. And deduced, well, something. But worthless in the face of the known different behaviour of the regions.
A meaningless worthless gripe is the best you can come up with? (as usual)
The early/mid spike exists in a lot of data from all over the NH. Get over it,
I have a list of some 40-50 example, but one from India will do…
There is very little spike in Soon et al’s very own NH land average
Again choosing to use fabrications that YOU KNOW are massive corrupted by urban heat effects and rancid agenda-driven mal-adjustments
Soon et all were showing that they could also “adjust” the URBAN tainted data to get the fakery of the surface data.
But when you removed all that fakery you get a mid 1900s spike.
You still haven’t comprehended the gist of their paper have you.
You must have the brain equivalent of a low-IQ 15-year-old.
How can the stations be corrupt. After all they are the ones that most closely match the models. /sarc
So Soon et al is based om fakery?
Again, you refuse to comprehend.
Yes, Soon had to use “adjustments” to match the GISS etc fabrications.
It is the only way they exist.
They then just used rural sites, and the same process showed that a lot of the warming was from urban heat.
Thanks for again agreeing that GISS et all are not remotely representative of global temperatures.
bnice2000 has shown you station after station that has little to no growth in temperature or ΔT’s. We have seen other station records on WUWT from Japan and elsewhere that are remarkably similar.
If you wish to continue attempting to disprove these records, then you should start to post station records that show increase of 2 – 3 degrees or more to create an average as high as the combined station ΔT averages.
The very use of averages of ΔT implies that all stations from all over the globe experience similar changes in temperature. Unless you can provide individual stations that can offset the low growth stations, your protestations are simply so much hot air!
As I have been posting lately, ΔT averages are a perfect method to overweight UHI. Many stations have seen urbanization with high growth in ΔT over and above the usual baseline years. Rural stations not so much. That tips the ΔT average heavily toward the UHI locations.
The only way to analyze stations properly is based on each locality. It looks like that will remove the adage that CO2 growth drives temperatures up everywhere at the same rate.
A bogus, bastardized Hockey Stick is all you have, Nick.
It’s kind of pathetic, putting all your faith in an obviously bogus temperature chart.
But, it’s all you have, so what else could you do? Right?
If temperatures start cooling, like it did after the Early Twentieth Century temperature highpoint in the 1930’s, you and all the other alarmists are going to look pretty silly.
You hung your hat on a bogus, bastadized temperature chart, and it may just blow up in your face.
What’s really pathetic is you know how drastically the temperature charts have been bastardized by the Temperature Data Mannipulators, yet you accept them as representing the truth, and you want the rest of us to buy into the hoax, too.
No, me. I know history. And I know the Temperature Data Manniplators are lying about it.
What about the “blip”?
It’s fraud all the way down.
Nick
I’m in such a benevolent mood today that I’m struggling to give you the benefit of the doubt. (And apparently the only reader not hitting the down-vote button upon sight of “Stokes”)
Your premise is that Willie shouldn’t compare the rural long-term NH stations against all NH stations because the areas are not comparable and any difference observed may just be due to regional variation, is that right?
Fair enough, but he is NOT comparing the temperature anomalies between those two sets. He is comparing temperature anomalies to TSI reconstructions for two different sets of stations. He could have compared each individual station’s temperature anomaly against TSI. Each such comparison would be valid would it not?
The salient point is that the temperature anomaly correlates better with TSI for the set of rural stations than it does for the set of all stations. (It correlates with TSI better for rural stations than for urban stations which are contaminating the all-stations record).
“This is not representative”
Well the mess that makes up the GISS (and others) data fabrication is certainly NOT “representative” of global temperatures.
Why are you not complaining about that ?
“Incidentally, why GHCN V3, which became obsolete 5 years ago? It makes all their data terminate in 2018.
Well, we know it has been cooling since 2016, so that shouldn’t be a problem.
They use V3 to avoid the corrupt mal-adjustments in later versions.
And there is evidence of that early/mid temperature peak all over the NH and other parts of the world…
Here is another one….
Nick writes “This is not representative, but more seriously is not a proper comparison. I don’t know why sceptics can’t comprehend the notion that if you want to infer something from a comparison, you have to compare like with like. That rural set represents a different region, and differences are probably due to that rather than the rural/urban split.”
This happens all the time with proxy measurements. If its not good enough to use temperature measurements from a few locations then its certainly not good enough to use proxy measurements from a few locations. But they do and somehow they manage to do it with low enough error to be compared to modern readings.
Nick writes “This is not representative, but more seriously is not a proper comparison. I don’t know why sceptics can’t comprehend the notion that if you want to infer something from a comparison, you have to compare like with like. That rural set represents a different region, and differences are probably due to that rather than the rural/urban split.”
Funny that. Stokes also claims one can average temperatures recorded with different thermometers at different times and at different places.
You have hit the nail.
You can’t legitimately argue that averages from disparate locations with different climate profiles give an accurate Global Average ΔT. Then turn around and argue that a ΔT average from disparate locations with different climate profiles is incorrect.
The only argument available is that QUANTITY of stations somehow makes a difference in accuracy and uncertainty. Yet that belies the belief that CO2 back radiation warms all land surfaces equally.
As always, let’s see individual stations that have unusual warming that drives the average so high.
I haven’t seen any of these stations. Have you?
“Funny that. Stokes also claims one can average temperatures recorded with different thermometers at different times and at different places.”
Well, anomalies. But, as I wearily point out, that is the basis of this paper authored by a who’swho of scepticdom. WUWT has graphs of such averages permanently on the front page. You’re not going to get far with that one.
Perhaps you could actually explain the contradiction between that quote and what you have written about averaging in the past rather than trying to deflect and obscure.
Nick, You want to convince people, show us individual stations with 2 – 3 -4 degrees of warming that offset those individual stations with little or no warming at all.
Validation is a worthwhile pursuit. After years of global ΔT showing tremendous growth there are surely individual stations with absolute temperature growth in the very high range. An average is supposed to be in the middle, if there is one station with no growth, there must be one with 3 degrees of growth to have an average of 1.5 degrees. Show us some.
The attribution problem is BIG. Discussed in several essays in ebook Blowing Smoke like ‘Northwest Passage and ‘When data isn’t’.
Attribution is a huge issue. I argued on another thread that pauses in CO2 caused temperature rise can only occur if natural variation completely offsets what CO2 growth adds. One should recognize that this requires larger and larger natural variation temperatures. Basically,
Total ΔT = natural ΔT + CO2 ΔT
This by itself can reduce the CO2 warming trend.
The only other argument is that natural cooling effects cease to exist!
There is a reason why Gavin Schmidt appears on news programs unopposed (e.g. his 5th appearance on the PBS NewsHour 9/6/23), and that reason was explained by the late Dr Stephen Schneider way back in 1989, in a passage within his “Global warming: are we entering the greenhouse century?” book:
Unmistakable science-based debate displaying huge differences of opinion among scientists would kill the CAGW issue in the eyes of the public, in other words. Thus for enviro-activists to keep the issue alive, their opposition must be eliminated by any means possible – disinformation, censorship, character assassination, whatever it takes.
Spot on Russell. Unfortunately the”eyes of the public” are on their personal concerns, and until the true cost of “energy transition” becomes a personal concern, they will remain otherwise occupied. Very few people will listen.
They will listen when the elctricity goes off.
getting editors of journals they don’t like fired?
I admire this group. They continue to do very high quality, important work while maintaining a dignified approach to science. This is a very good article. Thanks.
The first graph in the above article is fascinating in its own right: it shows that for satellite measurements of TSI since 1995, we really don’t know the mean value of TSI to a 2σ precision of better than ± 4 W/m^2 (i.e., almost all the TSI measurements since 1995 fall in the range of 1360–1368 W/m^2). If we wanted to include things like instrument error and analytical conversion uncertainties, the inaccuracy of knowing TSI would have an even greater range.
Against this fact, we find numerous articles (some even bearing the adjective “scientific”) as well as peer-reviewed publications arguing over Earth having a “energy imbalance” of about +1 W/m^2 (and a typical claimed precision for that value of 0.1 W/m^2, sometimes even to the nearest 0.01 W/m^2), which of course is used to explain “global warming”.
As examples:
“Earth’s climate is largely determined by the planet’s energy budget, i.e., the balance of incoming and outgoing radiation. It is measured by satellites and shown in W/m2. The imbalance (or rate of global heating; shown in figure as the “net absorbed” amount) grew from +0.6 W/m2 (2009 est.) to above +1.0 W/m2 in 2019.”
— https://en.wikipedia.org/wiki/Earth%27s_energy_budget
(my bold emphasis added)
“The Earth has accumulated nearly 0.5 watts (0.48 ± 0.1) over every square meter of Earth’s surface over the past 50 years (since 1971);
More recently (2006 to 2020), heating increased to more than 0.75 watts (0.76 ± 0.2) per square meter.“
— https://public.wmo.int/en/media/news/new-study-shows-earth-energy-imbalance
(my bold emphasis added)
“The global energy inventory increased by 282 [177 to
387] Zettajoules (ZJ; 1021 Joules) for the period 1971–2006 and
152 [100 to 205] ZJ for the period 2006–2018. This corresponds
to an Earth energy imbalance of 0.50 [0.32 to 0.69] W m–2 for the
period 1971–2006, increasing to 0.79 [0.52 to 1.06] W m–2 for
the period 2006–2018, expressed per unit area of Earth’s surface.”
—page 295, https://www.ipcc.ch/report/ar6/wg1/downloads/report/IPCC_AR6_WGI_Chapter07.pdf
(my bold emphasis added)
“The observed trend in Earth’s energy imbalance (TEEI), a measure of the acceleration of heat uptake by the planet, is a fundamental indicator of perturbations to climate. Satellite observations (2001–2020) reveal a significant positive globally-averaged TEEI of 0.38 ± 0.24 Wm−2decade−1, but the contributing drivers have yet to be understood.”
— https://www.nature.com/articles/s41467-021-24544-4 (abstract)
(my bold emphasis added)
Just ROTFLMAO.
Bingo.
The common counter to your point is that you can measure the growth of a child by markings on a wall even if you can’t accurately measure the absolute height.
But this analogy falls apart when you realize that: no you can’t when you don’t know where the floor is or if it’s moving.
“ If we wanted to include things like instrument error and analytical conversion uncertainties, the inaccuracy of knowing TSI would have an even greater range.”
That’s how these WUWT discussions go. Someone, like Soon et al, produce data and reasoning (however bad) to try to prove something. A chorus goes up that all data is crap. But apparently it turns to gold in the hands of Soon et al.
I personally don’t believe we have the slightest idea if the total enthalpy of the ocean/atmosphere system is increasing or decreasing.
I’m not a great fan of this paper. I merely logically defend against the dishonest criticism from the scum named Gavin.
Well said!
To add a finer point, from the above article:
“RealClimate.org was created in 2004 as a blog to promote the scientific opinions of the website owners. It is currently run by five scientists: Dr. Gavin Schmidt, Prof. Michael Mann, Dr. Rasmus Benestad, Prof. Stefan Rahmstorf and Prof. Eric Steig.”
That’s a real witch’s brew if I ever saw one.
“scientific opinion” – isn’t that an oxymoron?
Witches brew? No, more like incompetence jelly.
A collection of climate change liars.
We don’t know by how much, but there is no doubt that it is increasing. The ocean contains 94% of the system’s energy, and it is warming. The system is gaining energy and satellites say it is because the increase in solar radiation absorbed is bigger than the increase in IR emitted. Not exactly what the greenhouse effect theory says for an increase in GHGs, but whatever.
What is the total enthalpy of the Ocean within 5 %?
I see Javier has downvoted me.
If you can’t tell me where the floor is within 5% you sure as hell can’t be sure of a 1/1000th or 1/100th of a percent, or is it even less than that, of change. The Ocean is in contact with the Ocean floor which is a far greater conductor of heat than the surface.
Not me. I never downvote anybody, and only very rarely upvote somebody. I don’t like that. It is a silly thing.
Geothermal heat flow is negligible. Just 47 TW. The Sun delivers over a thousand times that to the ocean.
With Argo we sample the ocean enough to know that it is warming.
Perhaps a better question is where do we find a history of ocean temperatures back to the 1800s? Or of genuinely accurate data? Or to the Medieval warm period so that we can get a sense of a whole cycle?
see: https://wattsupwiththat.com/2023/06/29/the-verdict-of-instrumental-methods/
JV, I agree. Wrote about the vast uncertainties in essay ‘Missing Heat’ in ebook Blowing Smoke. But no doubt some enthalpy increase above 2000 meter depth per ARGO. Not below.
An interesting ‘Gore’ conundrum. How much of the recent atmospheric CO2 increase is because of slight ocean warming per Henry’s Law of physical chemistry?
I seem to remember Ferdinand Engelbeen said something like 16 ppm are due to the modern warming.
I respectfully disagree. To determine whether the oceans are warming by taking the difference in energy fluxes means subtracting one huge number with a big error margin from another huge number, very close in size to the first, also with a big error margin.
Ok Javier, you can’t do 5%.
How about 10%?
20%?
30%?
In fact you cannot give an estimate of the total Ocean Enthalpy whose error range is so great that to say we can measure the change is laughable beyond belief.
Because we can measure the flux at the surface does not mean we know if the Ocean in total is warming or cooling. It has a bottom.
You don’t need to know a total to measure a change. The same you don’t need to know how much ice there is in a glacier to know how much it is melting.
You need to know the volume of the entire glacier to know if it’s growing or shrinking. The runoff at one point tells you nothing.
No, you don’t. If you know precipitation and runoff you know if it is growing or shrinking regardless of volume. Same you know if a bank account is growing or shrinking by knowing the balance of its movements without knowing its total.
Also the article’s conclusion is it is unclear if warming is natural, anthropogenic, or a combination of both. A pretty weak conclusion but the point being we can’t say the science is settled and needs more investigation. The authors seem pretty upfront the data isn’t great and open to interpretation, hence why they looked at 27 reconstructions of tsi.
Even though I know full well that this is a rhetorical question that I’m putting to you:
“Are you now or have you ever been a flaming idiot?”
Yes Nick, we need data and reasoning, before we destroy our civilization.
Please provide data showing that all our efforts at decarbonizng are affecting the CO2 levels and weather.
And there goes Nick with his strawmen again.
Nobody ever said that all data is bad. There are complaints about certain data sets. The fact that you have to resort to such pathetic diversions just shows that even you know how unsupportable your position is.
The only data used in this post are the solar and the GHCN V3 land sets. Both are said to be crap, but no alternative is offered.
Far less crappy that the gross fabrications that you worship. !
I suspect you are well aware of that fact, and are fighting a petty rear-guard action in a pitiful attempt to stop your cult-like religion from collapsing around you.
You are failing !
The longer it lasts, the longer his paychecks do.
And when caught, Nick changes the subject.
Pointing out issues with a data set is not claiming that all data is crap.
Interesting how Nick seems to feel that before a person can point out problems with someone’s data, they are somehow obligated to provide better data.
I have read your misbegotten whinings you embarrassingly own as posts for a while now and one glaringly obvious, but common, mistake you keep making is to assume that every paper that comes out has THE ANSWER. That is, that when a new paper comes out, it is the final word on the subject, settled science, the end of the debate, the answer to all possible questions; probably fuelled by ignorant and misguided claims from such as IPCC, Schmidt, Mann, Hansen etc. What you fail to realise is that this never, ever happens – one paper may add something to the argument, but not everything in it, but this may fuel further papers that add a little more here and there and so the answers are built up a little bit at a time. By building a straw man argument that, because Soon et al released a paper, if 1 thing isn’t THE ANSWER to everything, then the entire paper must be scrapped, you prove once again that you know nothing of science and very little of anything else. Do scuttle away now, there’s a good chap.
karlomonte put me onto a journal of metrology located at https://phys.org/journals/metrologia/
The very first article I saw was measuring solar irradiance.
Bilateral comparison of irradiance scales between PMOD/WRC and PTB for longwave downward radiation measurements – IOPscience
It discusses a new measurement system. Guess what the uncertainty is in laboratory environment – ±0.5 W/m^2.
When I say lab environment, you should read the controls implemented to ensure the uncertainty was from the instrument alone. These conditions are not going to be available in the field. The uncertainty is only what the instrument is capable of, not what the field measurements will generate.
TSI is difficult to measure because instruments die rather quickly when pointing toward the Sun. TSI data is not to be trusted much. It drifts even from the same instrument in the same satellite, and corrections are guesswork. I rather trust solar radio emissions in the 10.7 cm band (2800 MHz). We have been making radios work for over a century.
There is a lot of uncertainty in TOA measurements of the Earth Energy Imbalance, but there is an independent way of measuring it from ocean heat content changes and both measurements more or less agree that it is something like 0.6-0.9 W/m2.
Javier Vinós posted:
Those statements do not appear to be valid based on the first graph of the above article. It shows data from multiple and different spacecraft/instruments, each of which is relatively steady in its TSI measurement (allowing for the ~0.1% variations in TSI over the ~11 year solar cycles), albeit that instrument drift corrections may have been applied:
— ERBS/ERBE: steady reading 1985-2004, mean TSI value 1365.5 W/m^2
— UARS/ACRIM2: steady reading 1981-2001, mean TSI value 1364.5 W/m^2
— DIARAD/VIRGO: steady reading 1996-2020, mean TSI value 1366.5 W/m^2
— SOHO/VIRGO: steady reading 1996-2022, mean TSI value 1361.5 W/m^2
— ACRIMSAT/ACRIM3: steady reading 2000-2014, mean TSI value 1361.5 W/m^2
— SORCE/TIM: steady reading 2003-2020, mean TSI value 1361.0 W/m^2
The list above represents six different data sources with an average observational lifetime of 20 years yielding a combined data group with a mean of 1363.4 W/m^2, all tightly constrained (± 3σ) within a span of 1360–1368 W/m^2 or ± 0.3%.
This mean value for TSI would be consistent with a TOA solar irradiance forcing of 341 W/m^2 averaged over Earth’s surface with the Sun at a distance of 1 AU. Updated Kiehl & Trenberth-type diagrams of energy flows (“energy balance”) for Earth’s surface-atmosphere-space coupled system predominately use the value of 341.3 W/m^2 for “incoming solar radiation” . . . however, such diagrams consistently fail to carry over the area-adjusted uncertainty of (±4 W/m^2)/4 = ± 1 W/m^2 in this irradiance value, which as I previously posted is about twice the value of the “imbalance” in power fluxes they are seeking to explain “global warming” for the last XXXX years!
In addition, shorter-term data from an additional three spacecraft/instruments are shown indicating an average TSI value of about 1362 W/m^2 when smoothed for the 11 year sunspot cycle effect on TSI.
With such a data collection from separate instruments and separate orbits and separate times, I trust such determination of TSI much more than many other climate “forcing” parameters that are most certainly not empirically established to better than ± 5%.
Don’t forget this little chestnut, courtesy of bigoilbob:
https://agupubs.onlinelibrary.wiley.com/doi/10.1029/2021GL093047
I would argue, based on the following statement by the authors, that they can’t reliably say anything about the magnitude (or even the sign) of EEI, but have been informed otherwise by the usual subjects.
‘As noted in detail in Loeb, Doelling, et al. (2018), EEI is a small (∼0.15%) residual of much larger radiative fluxes that are on the order of 340 W m−2. Satellite incoming and outgoing radiative fluxes are presently not at the level of accuracy required to resolve such a small difference in an absolute sense.‘
Not only TSI, but the components of solar energy that actually end up providing heat energy to the tropical ocean are unknown over time.
Different frequencies penetrate the oceans to different depths. UV, quite a lot… infra-red, very little.
Even the turbidity, algae content, salinity etc etc make a difference to the energy penetration.
Cloud cover also effects the penetration of those more energetic short wave frequencies as well.
All these things effect the energy going into the great big heat sink that is the planetary oceans.
All true . . . and let’s not forget to mention (as most do) the continuous heat loss from Earth’s oceans.
The predominant mechanism for such is, of course, evaporation of liquid water into the atmosphere and the enthalpy required for the phase change. This is a very complex process that is governed by many varying parameters such as air and water temperatures, relative humidity of the air, wind velocities across the sea surface, wave amplitude (aka “sea state”), water turbulence below the sea surface, and the possible presence of natural oil or organic biofilms that can otherwise reduce the rate of sea water evaporation.
Another, less-significant-but-still-important process for Earth’s oceans to lose heat is at ocean contact with (floating) sea ice or ice shelves resting on land but extending out into ocean waters. Ocean waters have to supply the enthalpy for this phase change, just as they do for evaporation.
And to reinforce the point, ocean water evaporation and ice melting occur at night (absent any solar energy input) as well as during the day.
I remain unconvinced about the influence of TSI.
First, as this post shows, it is hard enough to splice together the various satellite records that actually measured TSI
Second, the pre satellite TSI proxy data is sketchy.
Third, if TSI had a significant impact, then we should likely see some slight ~11 year cycle. But we don’t. Not GAST, not Arctic ice, not rainfall, not snow…
I think there are bigger, simpler things to use to rebut RealClimate.org:
The money fueled AGW momentum is slowing as the money dries up. The newly failed UK offshore wind leases auction is just the most recent example. Unsold EVs piling up on US dealer lots is another. Biden’s misnamed IRA threw hundred of $billions at Green stuff and caused inflation. Eventually people notice and come to their senses.
NOT possible at scale
Rud, have you seen Paul Homewood’s recent post about storing H2 in caves? The Brits are sillier than the Americans.
There are in the US exactly and only two compressed air energy storage systems (think pumped hydro using compressed air instead of water). Both are in old solution mined salt caverns for a reason. The solution mining sealed any cracks that would let the air escape.
Now consider that hydrogen is a lot smaller and lighter molecule than air, and that cave walls have cracks (that is how the water got in to dissolve the cave). The UK cave hydrogen storage thing was obviously bonkers from the beginning. Paul did well not piling on deserved ridicule.
In addition to the problem of gas escaping, there is also the loss of energy as the heat generated by compressing the gas is quickly lost to the sides of the cavern, which also lowers the pressure of the gas in the cavern.
I think there has been some misunderstanding by the Daily Telegraph which reported that ‘caves’ were going to be used to store hydrogen. The Royal Society report talked about 900 caverns needed to store hydrogen.
The company Storengy is developing a site at Stoblach where they already store natural gas equivalent to 4,400 GWh. . They have 20 underground caverns located in salt rock below 500m, have developed the technology to store hydrogen and are debrining their first cavern. Takes ” typically 3.5 years but may vary between 2 and 6.5 years.”
Still take a long time to build 900 the RS is talking about!
https://www.storengy.co.uk
“The Brits are sillier than the Americans.”
They are desperate for a solution. The whole Net Zero plan is slowly coming apart at the seams.
TSI data is bad during the satellite era, but much worse before, since it is modeled under several very objectable assumptions. It shouldn’t be used for anything, but it is required because models can’t work with sunspots, which are the most reliable proxy for solar activity we have prior to the satellite era. There are several reconstructed solar activity datasets based on sunspots and cosmogenic isotopes that are fit for most purposes.
Any argument based on TSI, unless confirmed by sunspots or proxies, is suspicious. That’s my 2 cents.
Then you should read my forthcoming book. It should convince you.
Read the last one and gave a nice Amazon review. Will read the forthcoming one.
Ditto.
I’m not too sure how to take that comment, but for sure the ~11 year solar sunspot cycle is revealed (and by multiple instruments and over multiple periods) by instruments specifically designed to measure TSI from space . . . see the first graph in the above article.
Since the amplitude of such ~11 year TSI variation is seen to be about 0.1% of the mean value, I’m not at all surprised that a small perturbation disappears when imposed on the dynamics and thermal inertias of Earth’s coupled land-ocean-atmosphere system.
It’s also possible that the thermal response of the climate system is too slow for an 11 year signal to show up.
“Unsold EVs piling up on US dealer lots is another.”
I sense a change in the auto makers sales pitches. They appear to be emphasizing “hybrids” lately, rather than all-electric vehicles, for some reason.
If they started recommending non-plug-in hybrids, then I would attribute the change to common sense and a recognition of reality.
We decided to sort all 7200 of the GHCN stations into three categories – “rural” stations are those rural in terms of both GHCN urban metrics; “urban” stations are those urban in terms of both metrics. All other stations we classify as “semi-urban”.
Immediately, we found several problems:
the problems with your rural analysis are Clear
that is you assume the locations used in GHCN are accurate. They re not.
like most people who write about urban you did not TEST your classification in repeatable
OBJECTIVE fashion.
lets make this simple when a satillite system Classifies part of the earth as water
how many times
does it get a pixel WRONG?
not a small percentage. but i can access their raw data and see what went wrong
when earth locations are classified as farmland is that repeatable and accurate?
nope.
classifying as urban is hard, especially since nobody hAS a definition that is PROVEN to cause artificial warming.
lets examine some examples:
population: in most population datasets, airports have zero population. so airports are classed as rural.
night lights: used by ghcn itself. night lights register electrification not urbanity. so all of north korea is rural.
TLDR: your rural dataset does not pass independent verification.
second problem. your rural data does not pass simple hold one out verification. take your rural data. remove 1/8th of the stations. using 7/8ths, predict the held out stations. You failed to account for structural bias due to incomplete spatial sampling.
OF course, you also didnt post your source data and source code.
no code.
no data.
no reproduceability.
out doing Mann in terms of transparency.
and Scafeffa? give me a break.
hes the worst dat hider/code hider.
you cannot expect responses to your paper if you dont do the basic things.
should these standards apply to all, before acceptance for policy direction, or should these standards apply only to something that changes policy direction?
Thanks moosh.
You have just given a good breakdown of the reason that ALL surface data fabrications should be rejected out of hand
Especially those that use all the WORST data available, and pretend they can adjust for urban bias. eg Berkeley
You have also shown that the classification as “rural” does not mean it is not affected by urban temperatures, …
.. and thus it is highly likely that Soon et al estimates of 40% of surface data warming due to urban heat bias, is a huge underestimation.
You are doing well today.
Your comment structure is still very garbled, contains a lot of gibberish,,.
.. and is still very incoherent, even compared to that of a 12-year-old slow-learner.
Dear Bnice2000,
Attacking the person using sarcasm spoils and undermines what you are trying to communicate.
All the best,
Dr Bill Johnston
http://www.bomwatch.com.au
This stooge is supporting an agenda which has the stated aim of bringing down western civilisation.
I see absolutely zero need to be polite to him.
He should learn to type in English and make coherent, rational comments.
Yes. But sometimes, just sometimes, it is ever so flamin’ satisfying!
I don’t understand all of the technical points.
But it seems clear to me.
One side seeks the truth. The other side seeks to advance an agenda regardless of the truth. And if the truth is not on their side, they lie.
The most telling part of this post is the meeting at Tom’s Restaurant.
”Dr. Ruedy admitted that none of their research team had considered the various problems we had raised in our working papers. We asked him if he could see any problems with our analysis. He said that he couldn’t immediately, but he promised to e-mail us if he could see any mistakes in our analysis. Since he never e-mailed us, we assume that he couldn’t find any errors.”
I keep thinking of the Wizard of Oz movie, except behind this climate curtain there is nothing. There is no there, there.
It’s an absurdity to say we know, in the scientific sense, what the global temperatures were pre 1900. Despite the serial comments of Stokes and Mosher, it should be increasingly obvious, that the increases in temperatures since 1900 have large uncertainties. And the attribution to CO2 has been and will continue to be just a guessing game. Read any hundred papers and there will be a litany of mathematical machinations and contortions to help with the conclusions. Math isn’t reality.
I would have much more confidence in the establishment if they would just admit what is obvious, that there is so much we don’t know. As of now, the SLR tidal gauge system seems to show what is actually happening with global temperatures. And that is not much.
“Dr. Ruedy admitted that none of their research team had considered the various problems we had raised in our working papers.”
Don’t tell Mosher! We need to keep him calm.
The Detection and Attribution of Northern Hemisphere Land Surface Warming (1850–2018) in Terms of Human and Natural Factors: Challenges of Inadequate Data
https://www.mdpi.com/2225-1154/11/9/179
Among the authors (37) from my corner of the world are these:
Johan Berglund, Independent Researcher, Malmö, Sweden
Ole Humlum, Department of Geosciences, University of Oslo, Oslo, Norway
Maxim Ogurtsov, Laboratory of Cosmic Rays, Ioffe Physico-Technical Institute, St. Petersburg, Russia
Jan-Erik Solheim, Department of Physics and Technology, UiT the Arctic University of Norway, Tromsø, Norway
—
Sodankylä, rural station in Finnish Lapland, concurs with the findings.
Dear Javs,
Can you explain this Figure? Did urbanisation start in 1987 and end in 2020? What does the actual data show? Is the calculation of anomalies hiding (or creating) something?
Why can’t I find similar trends or changes in Australian temperature records?
(See numerous examples at http://www.bomwatch.com.au)
All the best,
Dr Bill Johnston
In Sodankylä’s temperature record from 1908 onwards there has not been a marked effect of urbanization.
Temperatures (green dots, moving 30-year average TAVGs) in the graph are not anomalies but averaged from annual absolute TAVGs. Graph shows that from 30-year period (1925-1954), warmest in early 20th century, Sodankylä’s climate cooled 0.82 °C to coldest 30-year period (1958-1987) and has since warmed to latest 30-year period (1993-2022). Warming (1993-2022) with reference to period 1925-1954 has been 0.70 °C.
So, the given values, cooling by 0.82 °C and warming by 0.70 °C, are anomalies with reference to period 1925-1954.
Sodankylä weather station on google.maps:
https://goo.gl/maps/Wxq54qcD4Ku3TU8g7
Thanks Javis,
I undertook a detailed study of Sydney Observatory temperature data (from 1859) which I published at: https://joannenova.com.au/2017/01/sydney-observatory-where-warming-is-created-by-site-moves-buildings-freeways/
While the study is now 6-years out of date, and I have more info about the site now than I had in 2016, and the protocols I used have changed, what I said was:
So, there they are, measuring temperature at a site on the southern approaches to the iconic Harbour Bridge for more than 150 years, but there is no measurable change or trend caused by urbanisation.
I’ve flown into Sydney, probably hundreds of times during my working life in smallish (turbo-prop) planes (evan DC3s in the early days) and the first thing one notices is the turbulence. Heat is convected upwards, not sideways and due to its position the weather station is located at the bottom of the heat chimney.
I have used BomWatch protocols to analyse some 300 of Australia’s medium and long-term datasets. However, I have never observed urban warming per se.
The first thing I did when I skim-read the post was to find and download the papers, which are simply impossible to digest. How and why does a paper (Soon et al) have >20 Authors from 40 institutions? How can one cross-check 188 references? Accepting the conclusions is simply an act of faith in believing Team A at the expense of the the other teams, and getting-off on that.
This massive overreach does not and cannot bring closure to any argument. With its 20 Authors, 21 institutions and I don’t know how many references, the Connolly et al paper ditto. The third paper (Katata et al) I could read, but I could not download. While I understand their arguments I can’t say I agree with them, especially their Figure 2. In a world swimming in actual climate data why do they work with mocked-up or hypothetical data?
Surely Authors can produce some actual case studies to support their conclusions.
All the best,
Dr Bill Johnston
http://www.bomwatch.com.au
“This massive overreach does not and cannot bring closure to any argument.” I don’t think that was ever the intention of the paper – my understanding is that it was intended to open up the debate and bring in some things that alarmists are trying to brush under the carpet. This won’t bring closure, but maybe it’ll push our understanding a little further, shine a brighter light on things?
See also my comment below: https://wattsupwiththat.com/2023/09/09/reply-to-erroneous-claims-by-realclimate-org-on-our-research-into-the-suns-role-in-climate-change/#comment-3781771
All the best,
Bill
“Graph shows that from 30-year period (1925-1954), warmest in early 20th century,”
I see that all the time. All over the world. More confirmation that it was just as warm in the Early Twentieth Century as it is today.
If it is no warmer today than in the recent past, yet CO2 has increased in the atmosphere from then to now, then that must mean that CO2 has little effect on our temperatures. More CO2 now, but it’s not any warmer now.
CO2 is not the control knob of the Earth’s temperatures. We don’t need to bankrupt ourselves trying to reduce it. It doesn’t need to be reduced.
Not sure how one would go about it, but finding how individual surface sites were affected by urban population growth would be more to the point.
Eg a site slightly outside of a constantly growing town in say 1950, might not see a lot of urban warming affect until a certain population/urban spread threshold was reached…
… then a gradual increase until it is totally consumed by urban warming then the warming levels off.
The real problem is.. we just don’t know !
Which is what makes surface sites totally inappropriate for assessing changes in “climate”
Dear All,
Long complicated posts like these, that include three off-post papers by more than 20 contributors, are difficult to navigate and comment on. This especially the case today when I (and possibly others) have pre-committed their time. The problem is that allowing several days to actually peruse the papers, when I get back to it, the post will be well down the list and whatever contribution I could offer will be lost.
While I understand the need to move on to other topics, rather than trying to wrap it all into one package perhaps long posts like these could be broken into several smaller sections that focus on specific issues of concern.
All the best,
Dr Bill Johnston
http://www.bomwatch.com.au
Understand but disagree. Sweep of history is sometimes a necessary perspective.
That’s on purpose. Here at WUWT, as with similar pseudo-science sites, the ‘Gish-gallop‘ is often the preferred method of communication.
If you really thought WUWT was pseudo-science, you wouldn’t be here trying to argue against it.
FN hasn’t put forward any argument of any sort.
Just a sort of plaintive grunt !
Yes, yes, we know. It’s only science when you agree with the results.
Too much information for the fooling little mind to digest…
So sad. !
You have zero clue what actual science is…
You worship in a cult that is based on pseudo or zero science.
It is noted you have absolutely nothing to counter anything in any of the papers.
”Here at WUWT, as with similar pseudo-science sites”
You are a good case study of the ”Pick up your marbles and go home” syndrome, but you never actually go home. You stand on the side lines watching the game and continue to spew bullshit at it. Fascinating.
It is a lot to digest to get the full picture of what they are presenting and how it differs from their opponents who seem too quickly dismissive.
I’m sure the author will read your comments, even if a majority of commenters do not.
Very nice. We need lots more like this, a direct challenge using proper science. Well done.
I forgot the most important thing, it is easy to read and understand.
Your defense against Schmidt’s criticism of your Arctic/TSI correlation is quite poor. In the updated Soon, 2005 graph you can see that the correlation breaks down in around 2000, and is poor across the late 19th and early 20th centuries. It kinda looks ok if you ignore all that and squint really tight, as Gavin says.
Oh and also sometimes TSI changes lag temperature changes in the Arctic. Explain that one please.
It is still better than the IPCC, DR. Mann and Dr. Schmidts versions.
TSI data is all over the place which is why there many versions in existence a fact you failed to realize from the article.
That’s something we can all agree on I think. Regardless of whether it is TSI or not, that is a cyclical trend with little if any signature of carbon dioxide.
Here’s something that could help you. Go to page 28.
“77% of the Arctic stations are fully rural, the long-term trends of the Arctic estimates in Figure 17a are heavily influenced by stations that are currently somewhat urbanized (i.e., “intermediate”, or in the case of Murmansk, “fully urban”). In particular, in Connolly & Connolly (2014c), two of us (RC & MC) noted that only one of the six Arctic stations with data for 75 of the last 80 years was “fully rural”, i.e., Sodankylä, Finland.”
See jav’s picture of the temperature trends at Sodankylä above.
Why are temperature trends at Sodankylä indicative of urban warming? And is that a general response seen at many weather stations, or one-off? I don’t profess to know.
Cheers,
Bill
The trends at Sodankylä are not being affected by urban heat island, or at least what that is what’s implied. It’s the only station of 77 stations in the Arctic that has a long record and is fully rural.
Thanks Walter,
Reviewing the replies, I realise that now. However my original comment still stands.
Google Earth Pro shows the site was not at its present position in May 2007. It seems to have moved in August 2015. So it would be fair to conclude the site was not homogeneous and that the site move contributed to the odd temperature trajectory.
It is the kind of data that deserves explanation. Aside from moving the site and installing a couple of radars, who knows what else they did.
Nevertheless, apologies for misinterpreting jav’s and subsequent comments.
All the best,
Bill Johnston
Your comment is less than poor. !
It contains nothing of any relevance to counter the analysis put forward in the papers in discussion.
“Urban warming that gets mistakenly incorporated…”
hehe
HAHA
HAHAHAHAHAHA!!!
And “mistakenly” homogenised to rural sites for “adjustment” purposes. 😉
Thus spreading that urban warming from maybe 3 or 4% of the land area, to a large proportion of the land area.
I have been looking through the supplementary materials. It has the Python code, which is well written (Ronan, I guess). It does the right things – anomaly base 1961-90, cos weighting etc. It uses 5×5 degree grid, which is or was used by HADCRUT, but is coarse for trying to do land/sea.
It also lists the stations used. The urban/rural is just GHCN V3, with some extra stuff about USHCN, presumably to incorporate TOBS. The rural only, as Gavin said, is weird. It seems to just include stations with an R tag in GHCN in USA, Arctic (>60N) and Ireland (including NI). But with China it is much more liberal. The first name that caught my eye was Beijing. Shanghai, Tianjin, Quingdao, Fuzhou. These are big cities, and are of course rated U by GHCN. But Soon et al treat them as rural. There are 14 such. Then 71 places tagged I, which also includes big cities like Wuzhou and Xiangxian.
Maybe there is some rationale saying that Chinese cities in old days did not have much UHI. But they are used to present.
Another oddity is that they do have a file for all NH rural, and provision in the code for using it. I wonder why we didn’t hear of that?
I found in the files the output for the cases of urban&rural over his special region, and rural over the NH. This completes the picture, and shows the fallacy of comparing one region with a different one to make inferences about some property (UHI). Here is the plot:
The red and the black are the ones that Soon et al compared. The other cases are NH but roral, and region but U&R. The first thing to see is that neither region nor UR vs R makes much difference in the main warming period post 1970. They all track together.
But in the earlier period, R_Region, in red, showed a big peak. But both UR_region and R_NH showed a smaller peak. The peak of UR_region can only be attributed to the region difference, and the peak of the R_NH to the UR vs R effect. The red curve confounds the two.
To be a bit more explanatory about thta graph. What they did was to present the blackand red, which combines the effects of Urban/Rural and NH/region. What they should have presented is the black and blue, both NH. UR/R is having some effect, but not nearly as much, in the 30’s period. Black and green shows the effect of restricting the region.
Of course, again, nothing affects the modern warming.
That was the point Dr. Soon made in Tom Nelson’s video and also one of their sources (link below) explains why that occurs. It increases the recent warming trend by erasing the cooling from the 30’s to the 70’s. The rural composite trend is 0.55C per century.
This also confirms your point about why ClimDiv matches CRN. But the issue isn’t about the temperature after 2005. It’s about to temperatures from 1850 to 1980 or so.
https://journals.ametsoc.org/view/journals/apme/62/8/JAMC-D-22-0122.1.xml
IICC, I have been showing this graph and associated commentary from about 2008.
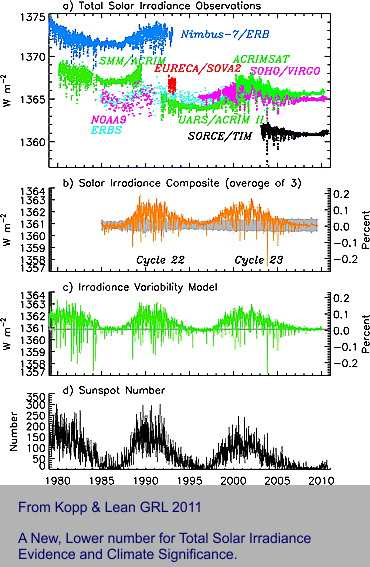
One does not have to nbe a space scientist to see the real problem, which is one of instruments that have a bias relative to each other, with no way to determine which is closest to the “true” value.
The alarmist industry continues to use this data after making adjustments. Those who criticise the adjustments are dismissed by questions like “How would you do better?”
That is not the right question.
The right question is, “Why should we not reject all of these measurements because of irreconcilable errors?”
Geoff S
Oh bother, here is the earlier graph I meant to show.
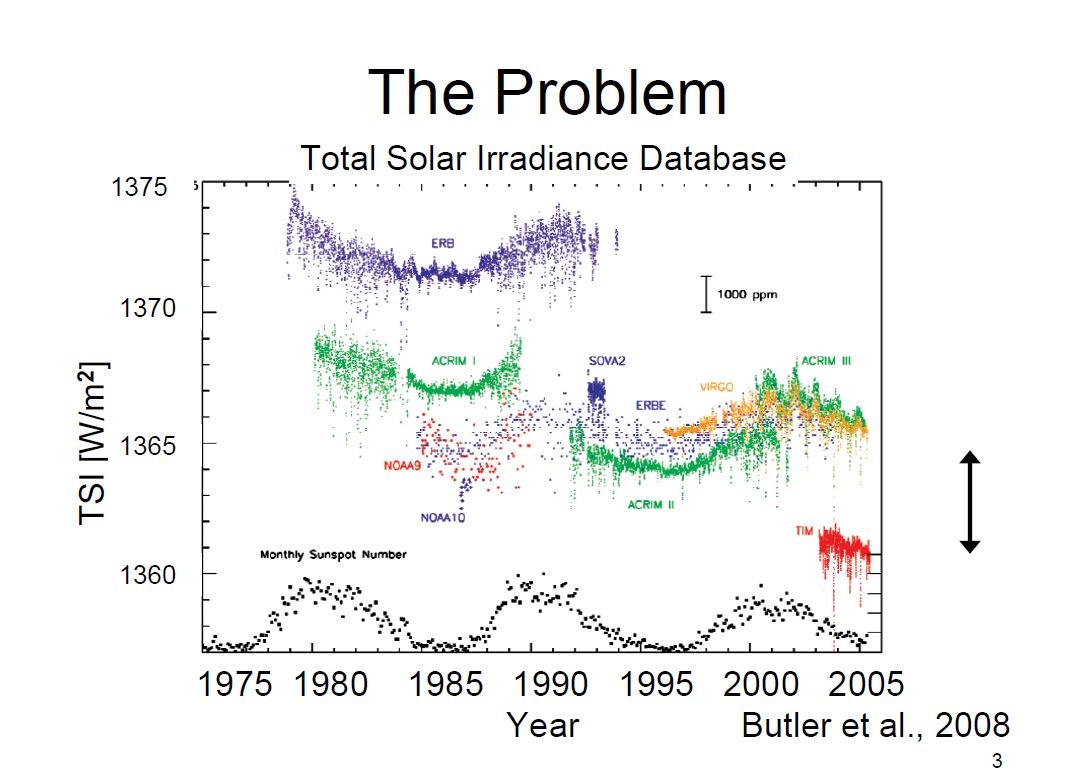
Geoff S
The bi-monthly Multivariate El Niño/Southern Oscillation (ENSO) index (MEI.v2) is the time series of the leading combined Empirical Orthogonal Function (EOF) of five different variables (sea level pressure (SLP), sea surface temperature (SST), zonal and meridional components of the surface wind, and outgoing longwave radiation (OLR)) over the tropical Pacific basin (30°S-30°N and 100°E-70°W).
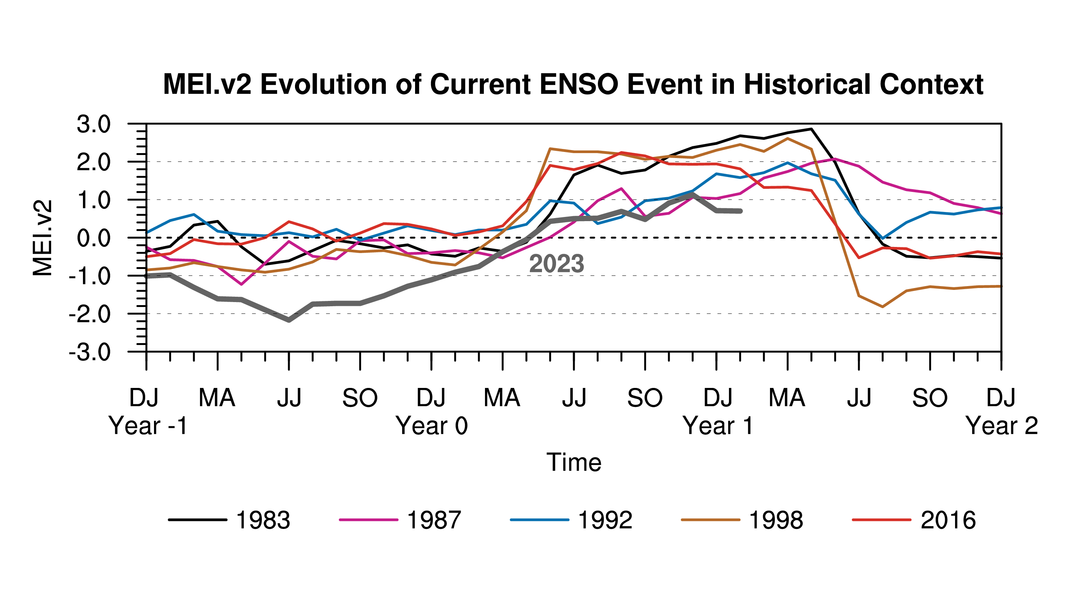
Which is fine, but where does it get the data from? What SST data, off which shelf and how do they know if the data are not biased? Who decides?
Bill Johnston
Check.
https://psl.noaa.gov/enso/mei/
Compare the El Niño diagram with the current air circulation.
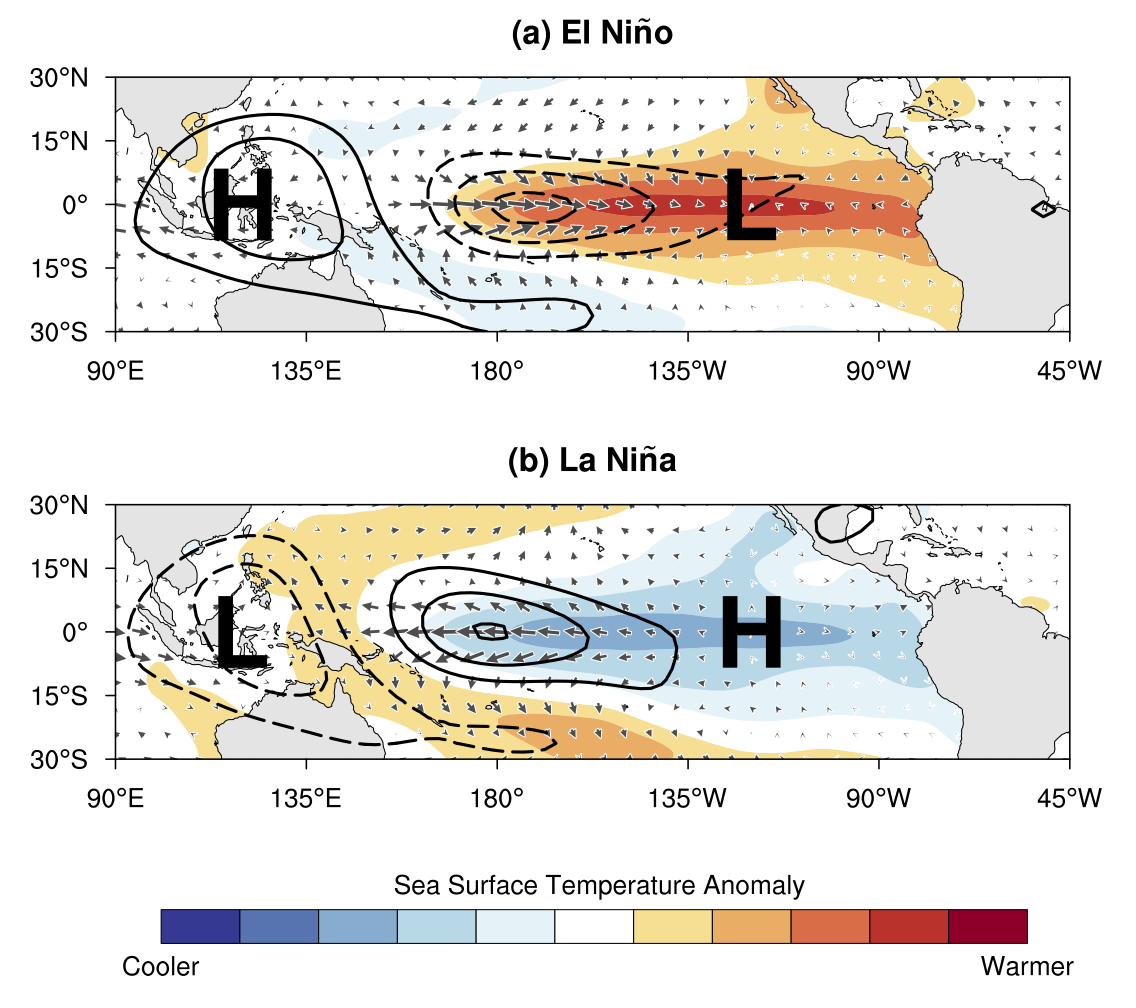

The greatest impact on climate is exerted by solar cycles through the ozone zone. The decrease in ozone production in the upper stratosphere affects not only the winter circulation, but also the increase in UVB radiation at the surface. At the same time, a weak solar wind in high latitudes weakens the speed of the jet stream in the lower stratosphere and tropopause. Stationary highs in mid-latitudes are formed, causing extreme heating of the land surface in summer and increased heat in the oceans. In winter, such highs can mean extreme cold.
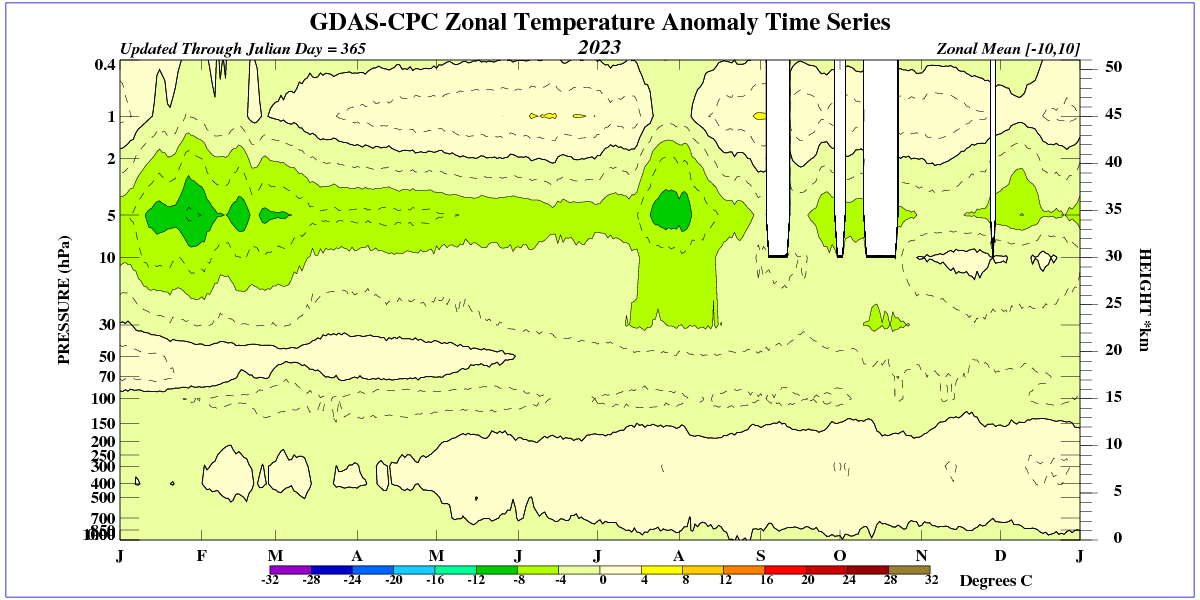

The temperature of the stratosphere rises only due to the dissociation of O2 in the Chapman reaction. That’s why it drops to the tropopause, because UV radiation below 242 nm does not reach there.
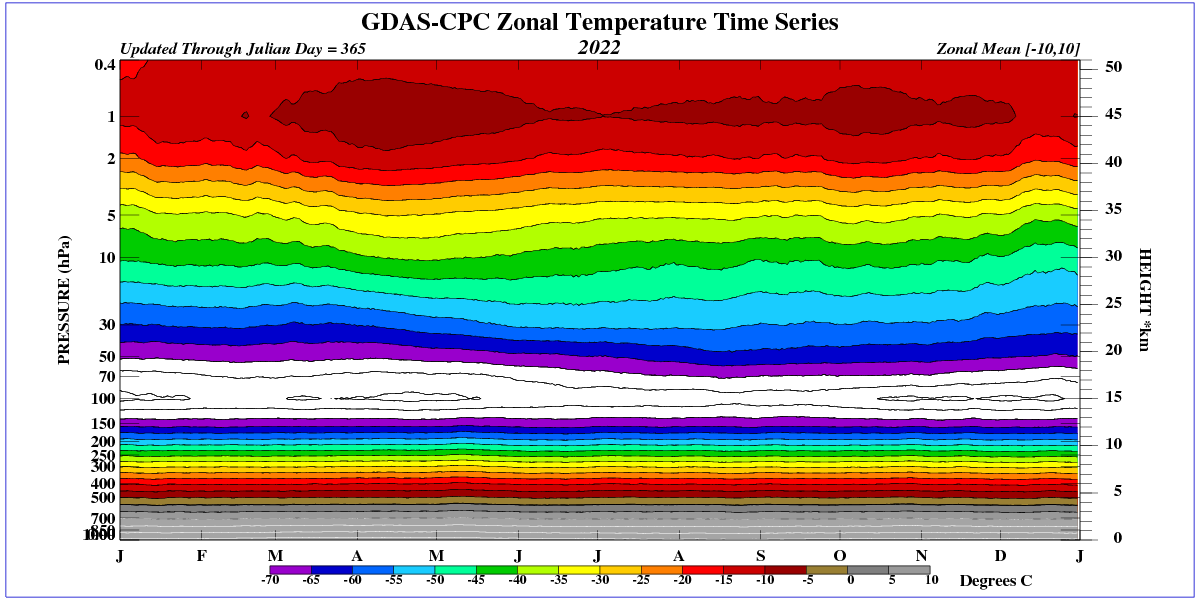
http://www.ccpo.odu.edu/SEES/ozone/class/Chap_5/5_2.htm
The Hoyt/Schatten mean TSI mean range of ~4W is out of bounds, unreal and wrong.
The Soon etal Hoyt/Schatten TSI direct Arctic temperature connection is therefore also wrong.
The TSI history is without a large basal secular trend, as Leif Svalgaard showed 16 years ago.
However, the percentage contribution of the shortest UV radiation varies significantly depending on the sun’s magnetic activity, up to 20%. This has huge implications for ozone production and temperature in the upper stratosphere.
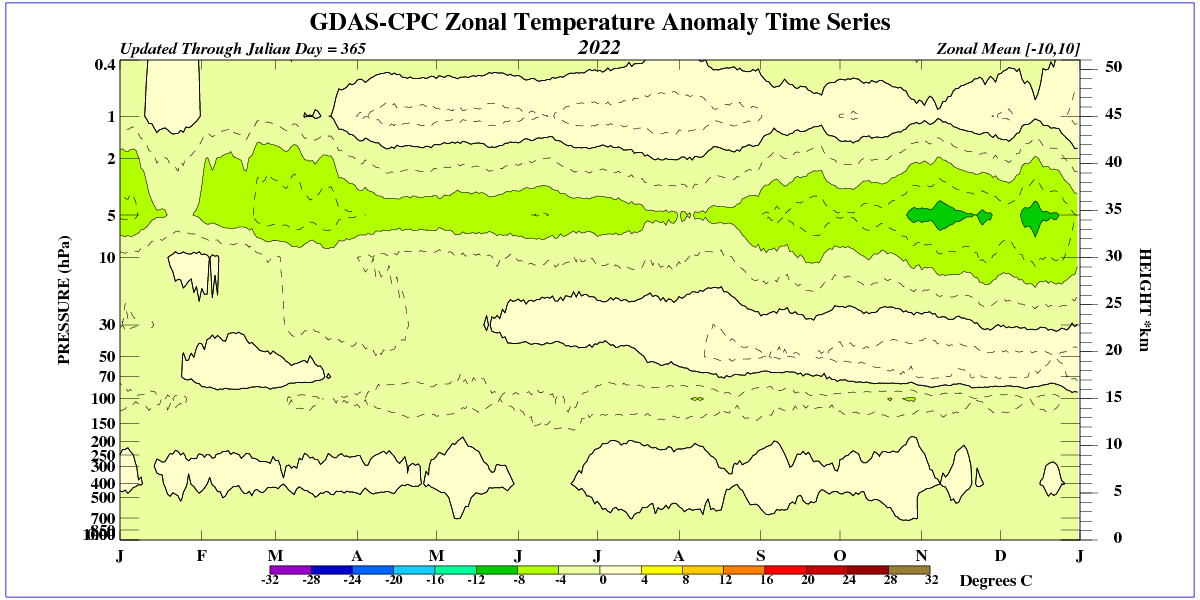
http://wso.stanford.edu/gifs/Polar.gif
But can solar cycle induced UV changes in the upper stratosphere lead to ocean changes? What is the time relationship of the zonal temperature anomaly to the sun’s magnetic field?
We showed that the ozone regulation does not only peak during austral summer but is significant throughout the ENSO lifecycle. Therefore it can be argued that ENSO initiation is primarily a result of a slight central Pacific tropical perturbation in atmospheric physical and chemical properties that determine the lower stratospheric ozone equilibrium and how much of the solar UV-B energy anomalously warms the upper troposphere. This to some extent perturbs the WC which is amplified through ozone regulated process that grows through positive feedback mechanisms until the ENSO peak is reached during austral summer before progressively dying out during autumn. In this way the lower stratosphere could provide an “external” forcing on the tropical Pacific upper troposphere on intra-seasonal timescales that vary interannually and manifesting as ENSO extremes. Feedback mechanisms among the lower stratosphere, upper troposphere and surface may explain why once initiated, the ENSO event mostly completes its normal lifecycle. However it has to be acknowledged that our confidence in the linkages between the ozone regulation and ENSO which we have presented here is not exhaustive, primarily due to the lack of a quantitative and prognostic theory for dynamical coupling between the stratospheric and tropospheric circulations. But if the observations in this work are supported through modeling experiments, then the ozone/UV-B forcing can become the primary driver of solar induced tropical tropospheric climate variability.
https://www.nature.com/articles/s41598-017-05111-8
https://earthobservatory.nasa.gov/images/7122/chilly-temperatures-during-the-maunder-minimum
When UVC radiation decreases ozone production falls and more UVB radiation reaches the upper troposphere.
El Nino intensifies when solar activity decreases after the peak of solar activity.
The ozone layer strongly absorbs UVB radiation, so it has a cooling effect on the surface. Counterintuitively, a decrease in the sun’s magnetic activity and ozone can result in stronger surface heating.
Ozone absorbs 250 nm photons so effectively that we find no 250 nm photons on the Earth’s surface. In fact, we could sit in the same place for millions of years without detecting a single 250 nm photon! At these very short wavelengths, the sky is completely black.
I understand that scope of all this is to explain global warming by other means than CO2 (and other anthropogenic GHGs). And so a) the sun and b) the UHI comes to mind.
But all that is fruit- and useless, unless you consider the main driver of global warming – aviation induced cirrus clouds.
NASA/P. Minnis:
“This result shows the increased cirrus coverage, attributable to air traffic, could account for nearly all of the warming observed over the United States for nearly 20 years starting in 1975.:”
“For a 1% change in absolute cirrus coverage with τ = 0.33, the GCM yielded surface temperature changes (DTs ) of 0.438 and 0.588C over the globe and Northern Hemisphere, respectively”
IPCC (special report on aviation):
“The potential effects of contrails on global climate were simulated with a GCM that introduced additional cirrus cover with the same optical properties as natural cirrus in air traffic regions with large fuel consumption (Ponater et al., 1996). The induced temperature change was more than 1 K at the Earth’s surface in Northern mid-latitudes for 5% additional cirrus cloud cover in the main traffic regions.”
Also recommended Charlos Long (NOAA), who almost could not help but to point out the truth..
https://www.youtube.com/watch?v=GoGZrwzWHJI&t=700s
And for a consistent oversight..
https://greenhousedefect.com/contrails-a-forcing-to-be-reckoned-with