By Kennedy Maize — August 15, 2023
“The historic trends contradict the conventional view that fossil generation has been declining, while renewables are gaining. According to the data, ‘The share of low carbon fuels (nuclear, hydro, wind & solar) peaked at 36% in 1995, coinciding with COP1 [the first UN conference of parties].’”
In the worldwide battle for electric generation, coal isn’t down and out. It isn’t even on the ropes. According to World Energy Data (formerly BP’s data collection report), coal is still the champ.
In 2022, coal accounted for 35.4% of global electric generation, followed by natural gas (22.7%), hydro (14.9%), nuclear (9.2%), wind (7.2%), solar (4.5%), geothermal, biomass, and other renewables (3.6%).
The historic trends contradict the conventional view that fossil generation has been declining, while renewables are gaining. According to the data, “The share of low carbon fuels (nuclear, hydro, wind & solar) peaked at 36% in 1995, coinciding with COP1 [the first UN conference of parties].”
“Over the following 17 years, from 1996 to 2012, fossil fuels gained share, mainly due to the increased share of gas and the declining share of nuclear and hydro. As wind and solar then became significant, this trend reversed.
“Despite this, and the hosting of twenty-seven UN climate conferences, the share of electricity generation by low carbon fuels in 2022 was only roughly equivalent to the peak in 1995.”
According to the International Energy Agency (IEA) in its Coal Market Update, coal demand for power generation and steel making ”reached a new all-time high in 2022.” IEA added, “Coal trade in 2023 is heading back to 2019 volumes.”
IEA noted, “Despite lukewarm economic prospects, global supplies grew by 8% in 2022 to a record 8 634 Mt. The three largest producers – China, India, and Indonesia – each reached all-time highs in 2022. Coal production was mainly boosted by China and India, which rapidly increased domestic production to mitigate exposure to high market prices after a first price spike in October 2021.”
IEA added, “Global coal production is expected to grow further in 2023, driven by an expected strong ramp-up of production in China, India, and Indonesia in the first six months, offsetting declines in the United States and the European Union. Russian coal production is estimated to have recovered somewhat in the first half of 2023.”
In a statement accompanying its report, Paris-based IEA said that “by region, coal demand fell faster than previously expected in the first half of this year in the United States and the European Union — by 24% and 16%, respectively, However, demand from the two largest consumers, China and India, grew by over 5% during the first half, more than offsetting declines elsewhere.”
China is the coal heavyweight. Greenpeace East Asia recently reported from Beijing that China approved “At least 50.4 gigawatts (GW) of new coal power across China in the first six months of 2023.” China is also developing world-leading amounts of wind and solar generation, but Greenpeace East Asia’s Gao Yuhe said he feared the coal focus would detract from building energy storage. “We see a lot of new wind and solar and a lot of new coal. Our major concern now, aside from the obvious emissions problem, is that energy storage remains sidelined despite the key role it needs to play in the near future. Building renewable energy but no energy storage is like building wheels but no axel,” Yuhe said.
OilPrice.com commented, “China is building coal-fired power plants at a record clip as it tries to counter the effects of drought on hydropower production.” China is also the hydro heavyweight, Asia’s largest producer, “accounting for 30% of global capacity.” China “has recorded a worrying 7.2% drop in output so far this year while India, the second largest producer, has seen production decline 5%.”
OilPrice.com adds, “China is not the only country whose hydropower sector has been hit by climate change. Electricity generation from hydro power sources has fallen quite dramatically in Europe, North America and Asia in 2023 compared to the corresponding period in 2022 with overall global hydro generation now 3% below the 2019-21 average. Reduced supplies of non-emitting hydro power in these regions means that utilities are increasingly deploying other sources of dispatchable but more polluting power, such as coal and natural gas, to meet electricity demand.”
U.S. hydro from Nevada, Arizona, Washington, and Colorado has also been drought stricken, leading to a 17% decline in hydropower production.
As Forbes observes, “In the U.S., coal demand has been on a downward trend for about 15 years. There have been three significant drivers behind this decline.” The first is horizontal drilling and hydraulic fracturing (fracking), which, starting in 2008 has revolutionized natural gas production. The second is the rise in solar and wind power, driven largely by lower costs and government incentives at federal and state levels. Contributing has been increased federal regulation of coal-fired power plants, including the Clean Air Act Amendments of 1990, which have driven up the costs of burning coal. But these U.S. developments have little impact on what’s happening in the rest of the world, as the U.S. consumes less than 7% of the world’s coal production.
I think wind and solar were popular with the green blob because they cannot support industrial society. The sort of Arcadian Socialism they want is inconsistent with reliable power (or current population levels).
Arcadian Socialism for you sucker. Private planes and beachfront property for them.
“The historic trends contradict the conventional view that fossil generation has been declining, while renewables are gaining.”
No, the cited ex-BP link shows the contrary. Coal and oil are declining, gas has plateaued. Hydro and nuclear are declining. Wind and solar are rising exponentially.
Someone should tell Stokes that coal is also free, just like wind and solar.
Someone should also tell Stokes that past performance is no guarantee of future performance.
Oh, and to be honest, he should plot coal-oil-hydro-nuclear together on the same graph, like he did with wind-solar.
“past performance is no guarantee of future performance”
The claim was
“The historic trends contradict the conventional view that fossil generation has been declining, while renewables are gaining.”
” like he did with wind-solar.”
The graph is from the World Energy Data link, as cited by the head post.
The IEA link is more relevant to total coal consumption, not just for electricity production.
For example, coal is used to make silicon for solar panels and to provide the energy for mining rare earth metals and cement production for wind mill construction.
And plate glass for PV module cover sheets.
COAL IS STILL KING.
By a long way.
GAS a solid second place
And it will remain that way for many decades into the future.
There will be plenty of CO2 for everyone.
Try not to cry too much, Nick 🙂
Plus CO2 is a life-giving gas to fauna and flora
Coal and CO2 are God’s gift to mankind
No-one will pay Stokes to be honest for once.
Massive subsidies can create supply. Who knew?
But can’t make the wind blow or the sun shine at night
UK this morning
Wind 0.07GW (0.29%)
Solar 0.00GW (0.00%)
Coal 0.36GW (1.48%)
CCGT 14.89GW (61.18%)
https://www.gridwatch.templar.co.uk/
Wednesday the 16th. of August, 2023 at 06:25 BST
Despite investing billions of £. It’s not when they work that’s the problem it’s the day they don’t.
So the simple calculation to replace that horrible 14.89GW + 0.36GW of FF electricity is (14.89GW + 0.36GW) / (0.07GW + 0.0GW) = 217.9 times current W&S build.
Cmon Nick tell us how that will be financed?
Great calculation
More subsidies for batteries will do it, until the UK is bankrupt
Bankrupt and still living with unreliable electricity.
BATTERY SYSTEM CAPITAL COSTS, OPERATING COSTS, ENERGY LOSSES, AND AGING
https://www.windtaskforce.org/profiles/blogs/battery-system-capital-costs-losses-and-aging
Excerpt
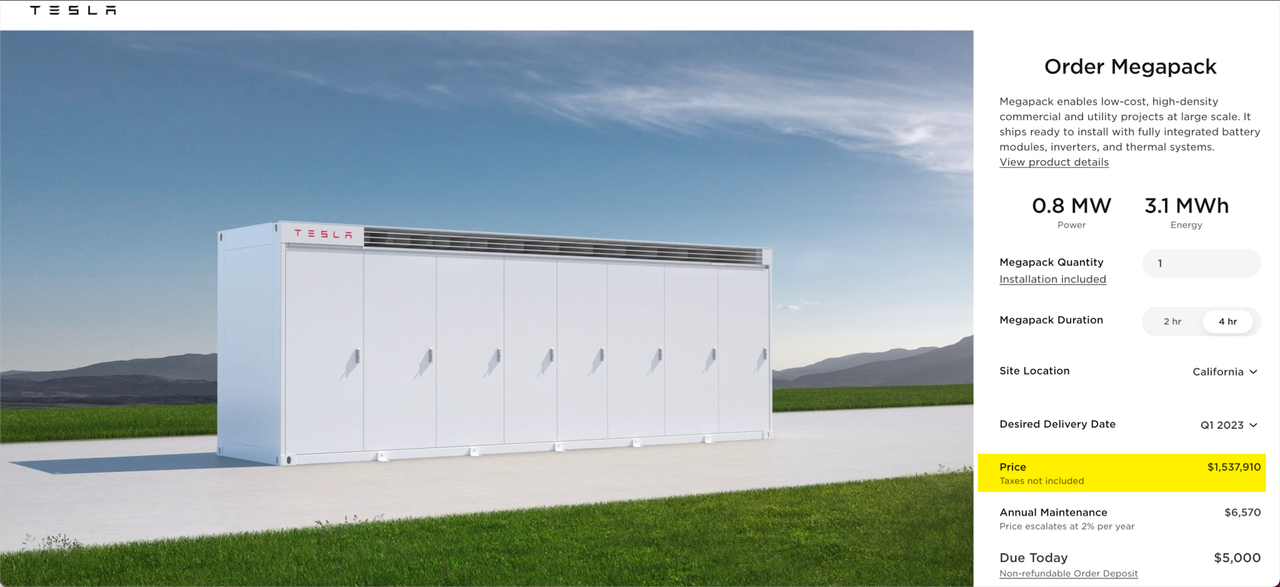
Example of Turnkey Cost of Large-Scale, Megapack-Based, Battery System, based on 2023 pricing
The system consists of 50 Megapack 2, rated capacity 45.3 MW/181.9 MWh, 4-h energy delivery
Power = 50 Megapacks x 0.979 MW x 0.926, Tesla design factor = 45.3 MW
Energy = 50 Megapacks x 3.916 MWh x 0.929, Tesla design factor = 181.9 MWh
Estimate of supply by Tesla is $90 million, or $495/kWh. See URL
Estimate of supply by Others is $14.5 million, or $80/kWh
All-in, turnkey cost about $575/kWh; 2023 pricing
https://www.tesla.com/megapack/design
 ?itok=lxTa2SlF
https://www.zerohedge.com/commodities/tesla-hikes-megapack-prices-commodity-inflation-soars
NOTE 1: Assume a 4-h battery system rated at 45.3 MW/181.9 MWh, and an all-in turnkey cost of $104.5 million
Amortizing a bank loan for 50% of $104.5 million at 6%/y for 15 years will cost $5.291 million/y
Paying the Owner for his investment of 50% of $104.5 million at 9%/y for 15 years will cost $6.359 million/y (9% because of high inflation)
Lifetime actual cost 15 x (5.291 + 6.359) = $174.75 million
Assume daily charging/discharging at a lifetime throughput of 10%, at a 20% loss, or 15 y x 365 d/y x 181.9 MWh x 0.1, throughput = 99,590,250 kWh to HV grid; 124,487,813 kWh from HV grid; 24,897,563 kWh, loss.
Total to Bank and Owner is $174.75 million / 99,590,250 kWh = 175.5 c/kWh
Throughput loss is 1.5 c/kWh
Total cost is 177 c/kWh
Less subsidies at 50% is 88.5 c/kWh
Announced cost is 88.5 c/kWh
At a highly unlikely 50% throughput, announced cost would be 20.5 c/kWh
At 50% throughput, you are close to Tesla’s recommend of not charging in excess of 80% and not discharging to less than 20%, which, in fact, was not heeded by Hornsdale owners eager to make a buck.
http://www.windtaskforce.org/profiles/blogs/the-hornsdale-power-reserve-largest-battery-system-in-australia
Not included: 1) O&M; 2) roundtrip losses, about 20%; 3) system aging, 4) plus, in year 15, decommissioning, i.e., disassembly, reprocessing and storing at hazardous waste sites.
NOTE 2: After looking at several aerial photos of large-scale battery systems with many Megapacks, it is clear many other items of equipment are shown, other than the Tesla supply, such as step-down/step-up transformers, switchgear, connections to the grid, land, access roads, fencing, security, site lighting, i.e., the cost of the Tesla supply is only one part of the battery system cost at a site.
NOTE 3: Battery system turnkey capital costs and electricity storage costs likely will be much higher in 2023 and future years, than in 2021 and earlier years, due to: 1) increased inflation rates, 2) increased interest rates, 3) supply chain disruptions, which delay projects and increase costs, 4) increased energy prices, such as of oil, gas, coal, electricity, etc., 5) increased materials prices, such as of tungsten, cobalt, lithium, copper, manganese, etc., 6) increased labor rates.
Where’s Nick’s response? Nick? Nick? You there mate?
There will be subsidies for wind, solar, etc, as long as there are fossil fuels.
Looks like coal is steady at 35%.
Look for that to climb over the next few years as wind and solar are found to be “wanting”, and expensive to implement, and subsidies of “other people’s money” dry up.
The erratic nature of wind and solar makes them totally unsuitable for grid supply.
Rational thought will eventually triumph over the child-like virtue-seeking that Nick is hooked on.
“Look for that to climb over the next few years”
The OP-linked IEA report says of 2024 coal use:
“In the electricity sector, we expect a decline of about 1%, due to the continued strong expansion of renewable power generation amid moderate electricity demand growth.”
Opinions are lime a*seholes, everybody has one. Only time will tell which is right.
S o it’s bnice2000 vs IEA. But the IEA has information.
IEA has information for the future. Go long, go long. LOL.
IEA has a lot of delusional belief information, a lot of modeled information worth less than your old flip slops, a lot of government demanded faux information, and a little, very little accurate information.
You can keep the IEA stuff.
Models vs data, which to choose.
The IEA has a very leftist slant, and so deals with a “virtue-seeking” subsidised future.
Not a real future.
People are starting to realise they have been conned.
Wind and solar only exist because of politically-based profiteering.
That cannot last forever.
I repeat, since Nick is very slow of comprehension.
The erratic nature of wind and solar makes them totally unsuitable for grid supply.
Everywhere where wind and solar have infected grids that were once run by dispatchable coal, gas and nuclear, the grids have become expensive to run, unpredictable and now have built-in unreliability.
With enough subsidies, crutches and a wheelchair, wind and solar are just fine, until we are all bankrupt
It also says
“China will continue to account for more than half the world’s coal use, with the power sector alone consuming one third of the worlds coal” .
Add in India and the global share rises to 70% “meaning China and India alone consume double the amount of coal as the rest of the world combined”
And in 2024 the“share of China, India and the Asean region is expected to reach 76%”
Coal production in China rose by 11% and by 12% in both India and Indonesia in 2022.
What this really means is that, within a decade, China and India will be producing more emissions than the rest of the world combined. And regardless of Nut Zero aspirations, global emissions will continue to rise as manufacturing and jobs leave the Nut Zero world
Nick,
There won’t be “Moderate electricity Demand Growth” once EV regulations take a hold. Many states are considering a mid 2030 EV mandate that will over tax a grid powered solely by Wind and Solar/Battery. EV mandates, if their draconian regulations can even be met, will require a minimum doubling and likely tripling of grid capacity on top of forcing the demand peak to be at night, after solar is unresponsive.
They will require
Upgrading electric services
Adding Transformers to practically every pole
…no more than 4 customers per Transformer
Replacing many poles that would be undersized to hold a Transformer
Increasing Ampacity of all Primary from the substation to the point of service
Replacing then undersized equipment
…Switches
…Fuses
…Capacitors
…Regulators
…Boosters
…Interrupters
…Regulators
…Sectionalizers
Miles and Miles of then Undersized Primary Wire (Copper and Aluminum)
Steady at that level in spite of everything suicidal western socialist governments could do to kill coal. All their talk of doom and catastrophe has done is cause a huge renewal in nuclear. Shame that it takes so long, as we won’t see new nuclear’s numbers on a graph for a decade. Of course by that time all the new coal fired plants choking up the pipeline, like the huge 50GW in China alone, will also end up on the graphs. It’s a horse race, place your bets…
Graphs are for electricity only.
That’s about all wind & solar can do.
Modern society can’t get by on wind and solar.
Where would the 6,000 other products come from?
If you don’t ask, I will tell you no lie
Twice nothing is still nothing.
Indeed, if the trend as shown continues wind and solar should hit 50% by about 2030 and 100% a few years thereafter 🤫.
It would not surprise me to see that start to flatten out, then start to fall as wind turbines die and aren’t replaced because subsidies are no longer viable.
Virtue-seeking governments cannot continue to keep pushing electricity prices up and up with continued implementation of unreliable suppliers into the grids.
Yup! They could reach 100% and still only produce (Wind 0.07GW (0.29%)
Solar 0.00GW (0.00%)) of DEMAND. Even then Nick will be touting the future growth of W&S without acknowledging their failures to meet demand.
Nick anytime you wish to respond to this known fact/data we can have a discussion.
UK this morning
Wind 0.07GW (0.29%)
Solar 0.00GW (0.00%)
Coal 0.36GW (1.48%)
CCGT 14.89GW (61.18%)
https://www.gridwatch.templar.co.uk/
Wednesday the 16th. of August, 2023 at 06:25 BST
Yes, too early for solar and the wind is down. But it’s been a good week for W&S; 24.8%W and 7.4% solar
But what would I do today if we’d no gas?
Yesterday has long departed and tomorrow hasn’t started!
It’s not the days they work that’s the problem it’s the days they don’t.
The wind went AWOL 20 hours ago and gas has supplied 300GWh during that time.
Where’s that going to come from in the Glorious green future??
Don’t forget you need to use 300GWh to recharge when the same wind conditions apply the day after tomorrow
Not much wind currently in the Australian grid.
SA… 82% gas, 9% diesel, and draining the tiny battery. (will be empty soon)
… sucking on the Victorian brown coal teet. !
Tassie grabbing money from hydro while they can.
Qld 96% fossil fuels,
Vic 70%, (some wind and hydro)
NSW 77% fossil fuels, 22% hydro (you do the maths on what coming from wind 😉 )
And the Q1 wholesale prices were:
Nick, I’m laughing so hard I have tears. A good week for W&S until it wasn’t? And, this is the NORM!
I think old mate must look at the weather forecast each day, not to determine what to wear, rather just hoping that a turbine will be spinning somewhere…
Perhaps to determine if the Winds are favorable so he can Post here about how well the wind (renewable energy) is doing at 2 pm on the.second Tuesday of August.
Disregard all those other days behind the curtain
It has been good news for gas to balance all that variable/absent wind and solar
An alternative view of the last 7 days (+ 8.5 hours) for the “renewables” and “fossil-fuel” contributions to the GB electricity grid (from 30-minute “BM Reports” / Elexon and ESO data).
For real thrill-seekers only, zoom in to the last 36 hours …
Take a look here:
https://gridwatch.co.uk/Wind
Look at the full year figures. This is what 28GW faceplate delivers in the real world. This is not a generating technology that is fit for purpose. The only way its halfway usable is as part of a hybrid system with rapid start gas.
UK Labour, who will probably be in government in a year or so, propose to get to net zero in generation by putting in four times as much wind as now, which will be about 100GW. And for a few weeks every year it will deliver less than 20GW. And for quite a few days every year it will deliver less than 5GW.
Whether there is a climate crisis or not, its not fit for purpose. Installing it, subsidizing it, adjusting the other generating capacity and transmission networks around it, its a sort of madness.
Take out the subsidies and the compulsory purchases and no-one would ever install this stuff.
“The only way its halfway usable is as part of a hybrid system with rapid start gas.”
That may be what we’ll have for a while, and will save a lot of fuel. But then we’ll get better things.
At what cost Nick? I can calculate it. Can you?
Where is the evidence that it saves fuel? I keep asking, but you never give an answer.
And why should we install this silliness if ‘better things’ are coming.
And what are they?
OK, here is a graph of actual emissions, which equate to carbon burnt, for the UK, as they moved to renewables. Down by a factor of 3
Not quite sure that this proves that there has been a fuel savings due mainly or solely to installation of wind and solar…
Going to need a lot more than this.
A) It saves ZERO fuel! Wind and solar require dependable backup power. Fuel is used nonstop while wind and solar get preferable treatment courtesy of government mandates and biased contracts.
B) No fantasy in the world can deliver dependable inexpensive efficient wind or solar.
C) Neither wind or solar has the life cycle of nuclear, hydro or fossil fuel generators. That is, long before your fantasies can achieve rational generation, the entire fleet of wind and solar must dump their toxic wastes into trash dumps.
And how exactly does that chart look, relative to demand, when you remove coal and gas from the mix entirely? Consider neighboring countries will be wearing the same shoes and have no available Fossil Generated Electricity to export so Imports might also dwindle…
Currently in the U.K. wind and solar combined are producing nothing.
Absolutely nothing.
..and costing a fortune — to produce nothing.
Nick,
using percentage as this grid does distorts the reality. What matters is what each fuel contributes in watt hours. Essentially as wind and solar are starting from a very low base this grid flatters them.
“The historic trends contradict the conventional view that fossil generation has been declining, while renewables are gaining.”
“No, the cited ex-BP link shows the contrary. Coal and oil are declining, gas has plateaued. Hydro and nuclear are declining. Wind and solar are rising exponentially.”
Nick seems to be claiming that coal use is declining but the data show that coal use is continuing to grow. Nick’s graphs show that coal use is declining as a percentage of electricity use, but the absolute amount of electricity generated by coal is still increasing. Now that Africa is starting to industrialise, I expect coal use to continue to grow for decades to come.
The claim was not that fossil fuels have gone up while renewables have declined, it was that renewables have had little or no increased market share since 1985: ““Despite this, and the hosting of twenty-seven UN climate conferences, the share of electricity generation by low carbon fuels in 2022 was only roughly equivalent to the peak in 1995.”.
The charts in Nick Stokes’ comment show fossil fuels holding onto their %age overall (actually, a slight increase). That is all that was claimed for fossil fuels – actually, a wee bit more than was claimed.
“it was that renewables have had little or no increased market share since 1985″
OK the OP link has that aggregation. It still isn’t true.
How many degrees-C warming will this alleged “exponential” growth prevent?
NICK, please put them all on the same graph. You are playing games with numbers by quoting percentages, rather than actual MW additions. You are better than this. Wind and solar could increase 100% and still be dwarfed by the small percentage addition to fossil fuel growth. Do not obscure the reality by such sleight of hand and trickery.
I am showing the graphs from the link cited in the head post. I can only show what they ahow.
You only show the proportional generation. The actual amount of electrical generation is rising substantially. It is rising for all sources of generation other than oil. Coal and natural gas consumption for electrical generation are clearly rising. The “renewables” are still a very small player overall and play a trivial role in sectors outside electrical generation.
I note that you have used the old trick of having graphs on different vertical scales Nick. If you were to superimpose the “exponential” growth of wind for instance on the same graph as coal energy, wind energy would be crawling along the bottom with a minor uptick.
“The first is horizontal drilling and hydraulic fracturing (fracking), which, starting in 2008 has revolutionized natural gas production.” Ought to be better known throughout the world.
And looking at the graphs provided by Stokes, much of the decline in coal and oil appears to be explained by the use of natural gas.
To a point, but gas use fraction has barely risen since 2010
Thanks to the idiocy and sheer malice of people like then Secretary of State for Energy and Climate Change ‘Potato’ Ed Davey, who decreed that seismicity intensity from fracking should be limited to 0.5. This implies a tremor roughly equivalent to the effect of a sparrow farting.
In every other sphere (including fracking for Geothermal), seismicity is limited to 4.0, not a ban because entirely natural readings above 4.0 have always been experienced in the UK. But as a level of ‘concern”.
As seismicity is measured to a logarithmic scales, 4.0 implies over 3,100 times as much energy (from pile driving, quarrying, railways, etc.) as Fracking’s 0.5.
No wonder Davey proudly boasts, as he trousers £18,000 for his “advice” to a Solar “Energy” Company, that he was the one who “banned fracking.”
He’s right there, and none of our UK Beloved Leaders wants to check his conclusions.
I wouldn’t be surprised if Nick Stokes has a picture of Ed Davey on his bedroom ceiling. Right alongside those of Klaus Schwab and Bill Gates.
Noting that the Taylor Swift concert in Seattle ‘generated seismic activity equivalent to a 2.3 magnitude earthquake’ according to the BBC.
https://www.bbc.co.uk/news/world-us-canada-66347361
How has the total changed in that time?
Percent decline
Except China, SE Asia, and other countries have greatly expanded coal use. Coal use has increased globally, not declined.
If the Europeans REALLY cared about CO2 emissions and energy security, instead of just virtue signaling for the cameras, then they would have permitted fracking, developed their own clean burning natgas resources and would not now be re-opening and throttling up old brown coal power plants! They would probably have lower total emissions and cleaner air, as well as stable, low prices.
But they didn’t, and we now have a war in Ukraine and growing use of coal. There are dumb decisions and then dumb examples from dumb decisions. My biggest complaint is that my dumb prisident is following those same dumb examples.
A hot house flower technology, dying in the US and irreplicable almost anywhere else. The ONLY place it stands a chance of being economic is with Saudi gas. They have the geology, the gas in place, a steady supply of $300/month indentured servants, and a Ben Dover attitude to environmental, safely, health for those workers and for those living/traveling nearby. Also, they will shine on their asset retirement obligations. I.e., they will leave the downhole and surface trash cans they will create behind, when the project is depleted. But at least that gas will supplant lots of oil being burned for domestic summer AC. That oil will be produced, but burned over more years, moderating it’s climate forcings.
Well, Union Pacific did restore a Big Boy locomotive and switch to oil instead of coal becuz oil is more convenient and easy to handle for a locomotive. Not sure the Big Boy runs thru Montana…probably just Wyoming so the kiddies of Montana are safe – no Big Boy for them.
Nick Stokes the flame of the renewable fantasy! So called renewables which are actually intermittent unreliables are a small fraction of the total energy package. Coal declined from a large percentage to slightly less of a large percentage. Some day I hope to tell my Grandchildren about the idiocy of the 2023 energy policy of our imbecilic government as a sad chapter of the many human beliefs like burning witches as a means to change the weather and rid plagues.
They are called renewables because they don’t last very long so you have to keep renewing them.
How clean are the coal fired plants in China compared to the coal fired plants in the US? My guess is that China’s plants don’t come close to ours. Now consider that much of the new coal plants are probably powering the manufacture of wind and solar devices and all the processes to manufacture them and then sell them to us and other knuckleheads who don’t know any better. That’s not even considering all the other crap China makes and sells to us. How stupid can we get.
“How stupid can we get.” ….. We’re trying to find out.
Rumor has it that China has shut smaller and more polluting coal facilities and built large modern plants. They can say we are decommissioning coal plants while actually increasing coal use.
[Not my thing, so look this up.]
Sorry, no links but I heard the same. The dirty air in places like Beijing was an embarrassment to the government and of course the new coal plants are much more efficient and a better use of resources than the small, much older crap that was replaced.
The socialist governments here can wave their fingers and demand private enterprise run things on unicorn rainbows, but the socialist government in China is also in charge of the utilities and production – so they have to make sure the lights stay on and the presses keep stamping. So we can expect the Chinese to have a much more reliable and efficient energy network over the coming decades, than in the windmill-blackout infected West.
You are correct, John.
And note my comment above.
Just as China actually built new Hexaflouride plants so they could get the West to pay for closing them (Ozone hole scam).
They certainly have the adulation of all the GangGreen promoters here for closing down a multitude of really crappy old plants, well past their “sell-by” date, that they planned to close anyway. Even the CCP Politbureau didn’t enjoy breathing in smog on the way to work.
How many of our very own GangGreen chums are super admirers of China? Certainly Maurice Strong, who was right there at the beginning.
Only when he was caught with millions in his pockets after the food-for-oil racket in Iraq was his popularity here reduced, so he got a nice house in China with CCP goons protecting him before conveniently “dying”.
Christina Figueres, Otmar Edenhoffer, how many others still treasure their “little red book”? Nick Stokes, perhaps?
Actually, China’s new coal power stations use the latest ultra supercritical technology and produce much more (+50% ?) Energy from a ton of coal than even the latest (50 year old) power plant in the UK (Drax, burning much more American Wood Chip than Coal now, and the latter to be phased out next year.
Don’t run away with the idea that the evil Chinese Communist Party are even as tenth as stupid as our Uniparty MPs.
It takes around 770 kilograms of coal to make one ton of steel.
… who is making quality steel?
The biggest steel producing country is currently China, which accounted for 54% of world steel production in 2022.
Number 2 in steel production is India.
EU steel production comes close to that of India’s.
Number 4 is USA.
Number 5 is Russia
Add in the fact that much of the green additions like solar and wind are going straight to the grid to make up for anti-fossil fuel agenda losses.
And… little things like the war in the Ukraine.
Then among EU countries it isn’t surprising they would return to that fuel that lies under their own feet, given increasing demands for electricity, EV’s, loss of natural gas and nuclear inputs -strangled by the net zero zealots.
Surprise! An increase usage of the OGfossil fuel, coal. 🫣 🤦♂️
“… who is making quality steel?“
In the USA, a big steel maker (Cleveland-Cliffs) wants to take over another (US. Steel). Look up “electric steel” – used in vehicle motors. Note, USS has the Big River Steel mill in Arkansas, where it is close to completing a line to produce electrical steel.
We told you so.
If people had any idea how Much of this green energy BS is funded and manipulated by China maybe just maybe there would be a opportunity for some reprogramming.
China ( and their brethren world com front) are the most serious enemy the west has ever faced- bigger than WW2 bigger than the old cold war( which really never ended) And useful idiots that abound here in the west, easily influenced, easily bought easily fooled.
This is going to get real serious real quick because narcissistic nut case tyrants can easily get themselves into a reckless mindset at anytime. And sleepy corrupt Joe will sell us out again to save his corrupt butt, same goes for all the rest of the idiots politicians that support the Dems here in the US
China is not a threat to most of the world. If you live in Taiwan you should be worried, similarly if you live in China and want to exercise free speech and other democratic rights then you are going to find yourself run over by a tank but that is about the limit of their territorial ambitions.
Dictators only want to take over their neighbors.
The problem is once they take over their neighbors, they have a new set of neighbors.
That would be news to India, Bhutan, Myanmar, Vietnam, Japan, the Philippines, Indonesia, and other countries that all have the common distinction of China claiming parts of their territories, sometimes militarily occupying them. And that’s not even getting into the predatory Belt and Road stuff where China sets up debt traps for poorer countries and then uses the leverage to gain control of key infrastructure, as has happened in places like Sri Lanka. What an ignorant comment.
Yes.
And how strange that none of our far-left chums ever acknowledge the problems with China’s vicious and inhumane version of “Colonialism.” Or “racism”, for that matter.
And slavery.
At one time maps in China labeled Australia as “New China”.
So what about the other 2.5%? They’ve not started using hamsters in wheels, have they? Or is it generated by all those static “bikes” in gyms?
There’s no surprise that solar and wind are increasing dramatically as a percentage, but that’s from a very low base compared to other sources. If you look at the absolute numbers a very different picture emerges, showing how coal continues to dominate — AND, crucially, how it continues to grow.
On this basis wind and solar remain very small and will continue to do so.
Here’s a link: https://ourworldindata.org/electricity-mix
Excerpt from a recent press release by Wind Europe entitled ‘European Parliament vote sends strong positive signal for renewables investment’ (19 July 23)
Despite the above positivity the press release itself notes
“And Europe invested only 17bn euros in new wind farms in 2022, the worst annual investment figures since 2009…… And orders for wind turbines were down 47% year on year”
https://windeurope.org/newsroom
King Coal will continue to power the world for decades to come, at least until we are completely nuclear powered
I note that Nick was nowhere to be seen in the comments regarding Ms Curry’s post, I wonder why.