Guest Post by Willis Eschenbach
Yesterday, Anthony Watts posted a most interesting discussion of the Hunga-Tonga volcano, entitled “Record Global Temperatures Driven by Hunga-Tonga Volcanic Water Vapor – Visualized“. I found some curiosities worth discussing in the post.
First was the delay between “cause” and “effect”. Here’s Ryan Maue’s graph showing the conundrum:

Figure 1. Output of a climate reanalysis model of the 2-meter surface temperature. This shows a big jump in mid-March.
Now, the Hunga-Tonga volcano erupted on 14 January 2022. My questions are … why is there a ~ 14-month delay before the mid-March 2023 temperature jump shown in the red square in Figure 1?
And why does the eruption have no visible immediate effects?
I mean, we’re talking about changes in radiation due to water vapor, and they are instantaneous—as soon as the water vapor concentration changes, the radiation changes.
And why is there nearly as much warming from November 2022 to the mid-March date of the purported “jump” as there is after the date of the “jump”?
Some folks have said that it’s because it takes time for the water vapor to spread around the stratosphere. In his post, Anthony quoted from a study entitled “Global perturbation of stratospheric water and aerosol burden by Hunga eruption” regarding the huge quantity of water vapor injected into the stratosphere. But here’s another quote from that same paper:
Owing to the extreme injection altitude, the volcanic plume has circumnavigated the Earth in only one week and dispersed nearly pole-to-pole in three months.
So we should have seen some kind of change within a few months of the eruption … but there’s no sign of that in the data above.
Now, Ryan Maue’s graph doesn’t show observed temperatures. Instead, it’s the output of a climate “reanalysis” model. So I thought that in addition, I’d look at, you know … actual observations. I was going to start with the Berkeley Earth temperatures. But they only extend to March 2023, so they wouldn’t show the purported jump in temperatures.
So instead, I looked at the UAH MSU satellite atmospheric temperatures. Let me start with the temperature of the lower stratosphere because it’s there that the water vapor was injected, so it’s there that we should see the main effect.

Figure 2. UAH MSU lower stratosphere temperatures.
You can see the effect on the stratosphere of the large eruptions of the late 20th century, Pinatubo and El Chichon. The temperature peak just before the Hunga-Tonga eruption is likely a combination of the White Island and Taal eruptions in December 2019 and January 2020.
But there’s no sign at all of the Hunga-Tonga eruption. Nor is there any sign of the purported jump in temperatures in mid-March 2023.
Moving down in altitude, here’s the temperature of the tropopause, which is the altitude where the stratosphere meets the troposphere.

Figure 3. UAH MSU tropopause temperatures.
The signals of the earlier eruptions are less distinct at this lower altitude … and again, no sign of any effect from Hunga-Tonga.
Moving lower still, here’re the mid-troposphere temperatures.

Figure 4. UAH MSU middle troposphere temperatures.
The signs of the big eruptions are pretty much lost in the noise … and still no sign of Hunga-Tonga.
Finally, here are the UAH MSU lower troposphere temperatures:

Figure 5. UAH MSU lower troposphere temperatures.
Same story. No sign of any effect of Hunga-Tonga.
So I figured I might be looking in the wrong place. Where would we expect to see the changes from a volcano in Tonga?
Well, in Tonga, maybe? … unfortunately, there’s no daily temperature data from Tonga. However, here’s data from some of the nearby islands.

We’ll start with Fiji, a lovely place where I lived for nine years. Hey, those waves aren’t gonna surf themselves …

No immediate effect from the eruption, nor is there any sign of the purported jump in temperatures in mid-March. Next, here’s Tahiti:

Again, no sign of the eruption, nor of any sudden jump. It rose after the “jump” date, but it rose before that date by about the same amount.
Next, Pago Pago in American Samoa.

Looks like Tahiti, a whole lot of nothing going on. Next, here’s Auckland in New Zealand.

No immediate reaction to the eruption. And if Hunga-Tonga caused the warming in 2023 … did it also cause the preceding cooling starting at the end of 2022?
Moving on, here’s Honiara, my old hometown in the wonderful Solomon Islands where I lived for eight years.

Same lotta nothing going on there, temperatures rising both before and after the mid-March “jump” … finally, here’s Lord Howe Island off of the east coast of Australia.

A year of cooling after Hunga-Tonga, then warming … say what?
Next, to look at a larger area, here’s the North Atlantic Oscillation over the same period.

Still not seeing it. There is a rise starting around mid-March, but it’s indistinguishable from the previous rise and is much smaller than the rise pre-Hunga-Tonga.
Finally, here’s a different computer reanalysis model of the global temperature. To give a better view of the overall situation, I started the data in 2016 rather than 2022 as in Ryan Maue’s graphic above.

As with Ryan Maue’s graph, there’s warming both before and after the “jump”. However, it’s much smaller in total than the warming just before the eruption.
To close out, here are three different looks at the same post-2016 time span—ERA5, HadCRUT, and UAH MSU results.

Sorry, but I’m still not seeing any effect from the Hunga-Tonga eruption, nor any big jump in temperatures in mid-March 2023.
What do I conclude from this?
My guess, and it’s nothing but a guess, is as follows:
None of the above graphs, including Ryan Maue’s, show any immediate effects from the eruption. I suggest this is because estimates of the global effect of the injected water focus almost exclusively on the warming effects of the increase in downwelling longwave radiation from increased stratospheric water vapor.
But they seem to disregard the cooling effects of the decrease in downwelling shortwave (sunshine). This is likely to be significant, since stratospheric water is going to contain a lot of ice, and ice is a good reflector of sunlight.
In addition to reflecting sunlight, a second large issue is that water vapor, ice, and water droplets all absorb sunlight, which also cools the earth by reducing downwelling shortwave at the surface.
Also, I’m just not buying that an injection of water into the stratosphere that has “circumnavigated the Earth in only one week and dispersed nearly pole-to-pole in three months” would a) have zero immediate cooling or warming effects, zero six-month effects, and zero one-year effects … but b) would still cause an upwards step-change in temperature fourteen months later. I may be missing something, but I see no feasible physical process that would cause that.
w.
PS—As folks who regularly read WUWT likely know, I’m happy to defend my own words and I’m willing to admit when they’re wrong. I cannot do the same for your interpretation of my words. So when commenting, please QUOTE THE EXACT WORDS you’re discussing. Saves lots of problems.
PPS—For those who enjoy such things, here’s my story of one of my adventures in Tonga, entitled “Old Bill Rises From The Dead“.
One other thing worth mentioning is that scientists were predicting that the SH ozone hole would grow in size as a result of the eruption. [1] [2] [3] As many of you know O3 is a GHG and generally leads to warming when it increases in the troposphere. But, in the stratosphere it does more to block incoming shortwave radiation than outgoing longwave radiation. So a reduction in the stratosphere would enhance the Earth Energy Imbalance.
Anyway, observations are indeed showing an early onset of ozone hole growth.
There is no incoming shortwave radiation during winter over the polar regions. The size of the ozone hole has no bearing on this issue, and global stratospheric ozone levels don’t appear much affected at this time.
The size of the ozone hole definitely has a baring on the issue. The ozone hole typically peaks in October as the south pole begins ramping up in terms of solar insolation.
Viewing that chart with the one shown here, showing the Stratospheric WV apparently heading upwards into the ozone layer over time.
Very interesting.
Willis,
Thank you for a very nice, data-based analysis of this particular eruption and investigating what possibly may have caused a time-delay between cause and effect, IF there is really a delayed connection between the Hunga-Tonga volcano eruption and the global warming as indicated by Ryan Maue’s temperature anomaly graph presented at the top of your article.
Believe me when I say that I don’t have a horse in this race, but in the interest of stimulating further discussion, the following items come to mind.
1) Could the ~14 month delay between eruption and apparent temperature step-charge (commencing March 2023) reflect the fact that the water/water vapor injected into the upper troposphere/lower stratosphere immediately flash froze to microscopic ice crystals due to the low temperature and low pressure in the these regions? Because there is still some ambient pressure at these altitudes, the ice crystals would not sublimate as fast as ice does in hard vacuum when irradiated by sunlight. But could the bulk of such ice crystals persist for a year or more given diurnal cycling of sunlight? . . . I don’t know. Also, why wouldn’t the rate of sublimation be more-or-less constant, instead of having a step change? Could some “catalyst” be in play to cause such?
2) If the volcano’s “water injection” indeed became predominately ice crystals instead of low temperature, low pressure water vapor, given the range of altitudes and horizontal dispersions of such they may not have even appeared as visible “clouds”. Given that possibility, can we say the “immediate” effect of the volcano’s eruption would have been cooling, warming, or perhaps neutral?
3) It is interesting to compare, as you did, the temperature anomaly signatures (or lack thereof) of Hunga-Tonga to those of El Cichon and Pinatubo (your Figures 2–5). However, this is definitely an apple-to-oranges comparison since Hunga-Tonga had the top of its pre-eruption underwater caldera 150 m underwater whereas El Chicon and Pinatubo were volcanos erupting directly into air. I could not locate by Web search how deep the water may have been to the bottom inside the caldera pre-eruption, but I could easily believe as much as an additional 1000 m, since the caldera’s top—again pre-eruption—was 2000 m above the ocean floor and the calder itself was 4 km across (ref: https://en.wikipedia.org/wiki/Hunga_Tonga ). Amongst many expected eruptions differences, I would think that perhaps Hunga-Tonga injected far less SO2 and smoke/dust particulates by dint of the “scrubbing action” that the mass of water being ejected simultaneously may have performed. However, and on the other hand, could the salt water being ejected have created many more cloud condensation nuclei?
4) It is reported that only 119 submarine volcanoes in Earth’s oceans and seas are known to have erupted during the last 11,700 years. I could not locate via Web search a listing as to which, if any, may have occurred in the last, say 100 years, which might enable an data-centric apples-to-apples comparison with Hunga-Tonga. Do you know of any?
5) FWIW, the above-cited Wikipedia reference states that Hunga-Tunga itself had historical eruptions that occurred in 1912, 1937, 1988, 2009, 2014–15 and 2021–22. Would you know if the data from any of the four more recent eruptions would be suitable for comparison to Jan 2022 eruption, or are they just too small?
My bottom line: I conclude that there is just too insufficient an amount of data and appropriate analyses of such to conclude whether or not a direct-but-delayed causal relationship between the Jan 2022 eruption of the submarine volcano Hunga-Tunga has led to the apparent since-March 2023 global heat anomaly (ref: Ryan Maue’s graph).
Per Willis: “But they seem to disregard the cooling effects of the decrease in downwelling shortwave (sunshine). This is likely to be significant, since stratospheric water is going to contain a lot of ice, and ice is a good reflector of sunlight”.
To form stratospheric clouds the temperature would have to be below -78ºC, the stratosphere is substantially warmer than that:
atmprofile.jpg
Phil, you’re guessing. There are indeed stratospheric ice clouds. See my comment and the associated link above.
w.
Yes I read it Willis that’s what I referred to above in response to that post, those clouds are basically at the tropopause, the coldest part of the lower atmosphere.
“We found that SICs with cloud-top heights of 250 m above the first lapse rate tropopause are mainly detected in the tropics. Monthly time series of SICs from 2007 to 2019 show that high occurrence frequencies of SICs follow the Intertropical Convergence Zone (ITCZ) over time in the tropics and that SICs vary interannually at different latitudes. Results show that SICs associated with double tropopauses, which are related to poleward isentropic transport, are mostly found at midlatitudes. More than 80 % of the SICs around 30∘ N/S are associated with double tropopauses”.
The water vapor in this case is much higher in the stratosphere where it’s significantly warmer and the H2O vapor pressure is much lower which means that ice would not form. Initially a lot of the water transported up there was in the form of ice crystals but it wouldn’t stay that way for very long because of the extremely low vapor pressure there.
Phil. August 7, 2023 7:08 pm
Per the Nature article Fig. 6 and Fig. 7, although as you say most of the water is higher up, there’s still lots of water just above the tropopause.
In addition, water vapor absorbs sunlight, so even in the absence of clouds there will still be a cooling shortwave reduction.
Regards,
w.
Well, in rebuttal there is this:
“Noctilucent clouds are composed of tiny crystals of water ice up to 100 nm in diameter and exist at a height of about 76 to 85 km (249,000 to 279,000 ft), higher than any other clouds in Earth’s atmosphere.”
— https://en.wikipedia.org/wiki/Noctilucent_cloud
(my bold emphasis added)
It is generally accepted that the tropopause at its highest altitude (i.e., over the equator) is no more than about 18 km above sea level.
— http://www-das.uwyo.edu/~geerts/cwx/notes/chap01/tropo.html
Also, here is an interesting factoid for you, Willis and me to chew on (from the same cited Wikipedia article):
“Noctilucent clouds are first known to have been observed in 1885, two years after the 1883 eruption of Krakatoa. It remains unclear whether their appearance had anything to do with the volcanic eruption or whether their discovery was due to more people observing the spectacular sunsets caused by the volcanic debris in the atmosphere.”
Hmmm . . . insert something here about possible “time delay” . . .
“Well, in rebuttal there is this:
“Noctilucent clouds are composed of tiny crystals of water ice up to 100 nm in diameter and exist at a height of about 76 to 85 km (249,000 to 279,000 ft), higher than any other clouds in Earth’s atmosphere.””
But that’s not in the stratosphere it’s at the top of the mesosphere where the temperature is below -80ºC
OK, point taken.
Although might one might wonder how all that ice/water vapor transited the below-zero deg-C levels of the stratosphere to enter the mesosphere without ever forming (ice) clouds . . .
But wait . . . maybe it didn’t:
“Clouds are found almost exclusively in the troposphere . . . Yet on occasion thin veils of clouds are observed above the tropopause. Presumably these clouds consist largely of ice, although their exact composition is not known . . .
“Nacreous clouds, also known as mother-of-pearl clouds, are stratospheric; they occur between 15 and 30 km. Large volcanic eruptions emit dust particles in the lower stratosphere. These may combine with ice to produce nacreous clouds. In fact, in the year following Mt Pinatubo eruption in 1991, many nacreous clouds where spotted by airline pilots flying in the twilight . . .
“Nacreous clouds are normally too thin to be visible from the ground (Fig 1). They are most common in two situations. One situation is when strong winds (and winds increasing with height) cross a long mountain ridge, such as the Rocky Mountains in North America. The resulting high-amplitude gravity waves may propagate into the stratosphere. Nacreous clouds there are the stratospheric equivalent to lee wave clouds (Ac lenticularis) in the troposphere.”
— “Clouds above the troposphere”, B. Geerts and E. Linacre,
Ref: http://www-das.uwyo.edu/~geerts/cwx/notes/chap08/noctilucent.html
(my bold emphasis added)
On the mystery of ocean warming this summer, Judah Cohen remarked at his AER blog:
I feel like I have been highlighting all summer long this strange atmospheric feature that suggests stratosphere-troposphere coupling where warm/positive polar cap geopotential height anomalies (PCHs) seems to be propagating down from the stratosphere to the surface and forcing a negative AO. This coupling persists (see Figure 11) and once again is supporting a negative AO/NAO and Greenland blocking well into August. In Figure i, I post the NAO the observed and predicted NAO index from NOAA’s Climate Prediction Center and the NAO has been almost continuously negative since the start of summer. It is my experience that is very rare and showing my bias here but would love to see that repeated in winter!
High latitude blocking seems to be a more common summer feature of late, but it does seem to me that the high latitude blocking is stronger this summer than other recent summers. Of course, there is still plenty of summer left but looking ahead to the transition to fall, if the strong high latitude blocking continues well into the fall months this could have important implications on the developing polar vortex, but I digress and/or get ahead of myself.
From social media and the news certainly seems that there have been many superlatives in the weather from record high sea surface temperatures, record high land temperatures, heavy rainfalls, the lethargic growth of Antarctic sea ice and extensive Greenland ice melt. I just came across this nice story from the The Weather Channel on some of the record heat in the US this summer. Why has the globe seemed to turn the heat dial to 11 this summer, is an interesting question and I certainly don’t have the answer. At least some intuitive contributors are the developing El Niño and the Hunga Tonga volcanic eruption at the beginning of 2022. Unlike other explosive volcanoes it was sulfur poor but water vapor rich since it was an underwater volcano as discussed in this EOS article.
But despite the seemingly exceptional weather this summer across the Northern Hemisphere (NH), I think the overall pattern of surface temperature anomalies is consistent with recent summers and with summer forecasts from this past spring (the summer forecast was included in the 22 May 2023 blog post).
https://www.aer.com/science-research/climate-weather/arctic-oscillation/
I’m not an expert, and I’m not even sure that anyone knows what a water injection to the Stratosphere actually does to climate.
The eruption took place in SH summer.
How long does it take for materials to move from the point of injection to being distributed evenly around the globe?
If it’s a year then it would reach the NH peak early 2023. Did that mean an effect on NH spring and summer 2023 rather than an instant effect Autumn and winter 2022? Would most of the SH effect be warming the southern oceans?
I’ve not got a clue.
I read last week it’s been a bit chillier than normal in Tonga this winter.
As usual, Willis is on target in his assessment of any warming from the Hunga Tonga eruption on 15 Jan 2022. Since 2013, I have used twilight photometers to provide altitude profiles of atmospheric aerosols, water vapor, and the ozone layer. On 11 May 2022, my key water vapor photometer detected a thick band of water vapor in the lower mesosphere. I had never observed this before, so I sent a profile chart to the authors of a Hunga Tonga paper, one of whom is a prominent NASA atmospheric scientist. That profile chart created a good deal of interest, and within a month NASA assigned me to conduct regular twilight profiles in a contract that has been extended to 29 Feb 2024. The contract included funds to design and build much better twilight photometers, a task that was completed by Scott Hagerup, the sharp engineer who transformed my handheld TOPS ozone instrument into Microtops.
Water vapor is a key “greenhouse” gas. Because Hunga Tonga increased stratospheric water vapor by from 10% to 13% according to various papers, I assumed that the new Hunga Tonga water vapor would cause some warming during 2022. Various papers suggest that stratospheric water vapor warms the surface by a degree C or less C. If so, then a linear extrapolation of pre-HT water vapor by a 13% increase from HT might increase the surface temperature by a small fraction of a degree. But, as Willis notes, there was no obvious Hunga Tonga warming during 2022. Any possible increase might have been cancelled by surface cooling from HT aerosols, which persisted much longer than expected due to the chemistry within the aerosol plume caused by substantial water vapor.
The ongoing heat wave during 2023 presents a very different situation, for cooling by HT aerosols, while still present, is significantly reduced. Meanwhile, there has been considerable speculation that HT water vapor is behind the current heat wave. Could a 13% addition to stratospheric water vapor by the HT eruption cause a major, non-linear increase in surface temperature? Probably not, but HT was an historic, unprecedented eruption during the instrumentation record. Thus, the lack of precedence doesn’t rule out at least some warming.
Substantial HT water vapor will remain in the stratosphere for several years, after which its effect on surface temperature, if any, should be well understood. Meanwhile, I will continue to measure the altitude of HT aerosols and water vapor. And I’m confident Willis will be carefully watching both surface and satellite temperature trends.
The attached profile shows HT water vapor over my Texas site on 30 Apr 2023. The 50-60 km band is mesospheric water vapor unrelated to Hunga Tonga. The profile does not show low altitude tropospheric water vapor.
Willis,
Oops. Was gonna ask if seen this study on the topic?
Didn’t read down comments far enough…
https://agupubs.onlinelibrary.wiley.com/doi/full/10.1029/2022GL099381
They predicted (possible) surface warming and it happened. The scientific method in action.
It’s not a post hoc fallacy because they gave good reasons why it should happen.
If the next five years indeed prove warmer than the previous five, alarmists will blame anthropogenic CO2, not ENSO and the Tonga eruption.
Don’t worry, alarmists will always blame Trump.
Milo, who is “they”, and exactly what did they predict and where did they predict it? Links, please.
FWIW, I never saw a single prediction that said “14 months after the eruption we’ll see a jump step in temperatures” …
w.
How about reading the link to which I responded? The authors predicted 18 to 24 months for effects in mid latitudes, since you’re averse to reading anything which challenges your ill-informed assumptions.
“They” are the authors of the paper. Why am I not surprised you didn’t bother to read it?
Willfully ignorant people without any education in relevant disciplines should really not presume to comment on issues outside their limited (to say the least) competence.
PS: Only a complete geological, chemical and physical nincompoop, ie you, would equate the Tongan eruption with El Chichon and Pinatubo.
Milo August 7, 2023 10:11 pm
Milo, this is EXACTLY why I ask people to quote what the fark they are talking about. Yes, your “they” could easily have referred to the paper. But it also it could have referred to any other paper on the planet. I can’t read your mind. People talk about all kinds of things when they are responding to some comment, and often they have little to do with that comment.
Next, yes, I read the paper. I was totally unimpressed, so I just kept going.
You claim “They predicted (possible) surface warming and it happened.”
But in fact, they didn’t predict a damn thing. They said it “may lead to surface warming” and it “could potentially warm the surface”. that it “could reduce stratospheric temperature”, and that it “could also result in the tropospheric westerly jets becoming stronger and storm tracks shifting poleward”.
And they said it “may lead to global warming”. Perhaps that kind of candy-assed wishy-washy BS impresses you. Me, not so much.
Then they say that “HT-HH may be the first volcanic eruption observed to impact climate not through surface cooling caused by volcanic sulfate aerosols, but rather through surface warming caused by excess H2O radiative forcing.”
And yes, it “could” and “might” and “may” and “potentially” be or do a host of things … but those are handwaving, not scientific predictions. A scientific prediction is falsifiable, and not one of those is falsifiable.
Look, at any given time, the surface is either warming or cooling. If I say “it could potentially warm next month” and it does, is that a successful prediction? Because I’ll be right about half the time … and even if it doesn’t happen, hey, I didn’t say it WOULD warm, I said it COULD POTENTIALLY warm, which was 100% true. So my statement is not falsified, it could have warmed.
Next, you say that “The authors predicted 18 to 24 months for effects in mid latitudes”.
In fact, they said “The excess H2O could arrive in northern and southern midlatitudes in ∼18 and ∼24 months, respectively.” And yes, they could … or not.
However, since the claimed step change in temperature occurred 14 months after the eruption, I’d say that was a badly failed non-prediction.
Finally, let me politely invite you to stuff your vile claim that I’m “averse to reading anything which challenges my ill-informed assumptions” as far up the distal end of your esophagus as you can reach. It’s both untrue and slimy. Try it again, and you’ll never get another word of response from me.
w.
Story tip. Until there is an appreciation of the amount of sodium chloride entrained in the ‘water’ that was injected into the stratosphere and the effect that such high concentrations of these (and associated) elements have on instrument readings, the value of those readings is suspect.
When HT erupted, it must have also released a large amount of energy into the surrounding ocean.
Where did it all go?
I would think it was still providing a significant amount of heat energy.
We saw a BIG volcanic eruption, and it did not affect the climate as it should have done – or did it? First, it depends on your definition of “climate” – we can only see “weather”, not “climate”. Second, maybe we don’t know enough about BIG volcanic eruptions, and we surely don’t know enough about “climate”. When an unknown meets an unknown, mysteries arise naturally. Long live settled science.
I would concur with Willis – this isn’t passing the smell test for me at this point, unless solid data & analysis supports why there is a 14 month lag. I am open to the possibility but I don’t see anything at this point that I feel is that compelling to say the events are connected.
Yes, morons, each major volcanic eruption puts more “greenhouse gas” into the atmosphere than the human race has ever, or can ever, produce. Stupid f*cks.
First, calling folks “morons” and “stupid f*cks” is not going to get anyone to do much except point at you and laugh.
Next, sorry, but your claim that “each major volcanic eruption puts more “greenhouse gas” into the atmosphere than the human race has ever” is a joke. That’s a popular myth that has been falsified over and over and over, see below for a few of them … but I guess there are still some moronic stupid f*cks who haven’t gotten the memo.
w.
https://www.reuters.com/article/factcheck-volcanoes-co2/fact-check-volcanoes-do-not-produce-more-co2-emissions-than-human-activity-idUSL1N2XV1HA
https://www.climate.gov/news-features/climate-qa/which-emits-more-carbon-dioxide-volcanoes-or-human-activities
https://apnews.com/article/fact-check-volcanoes-co2-emissions-383647479337
https://www.scientificamerican.com/article/earthtalks-volcanoes-or-humans/
https://www.science.org/content/article/scienceshot-volcano-co2-emissions-no-match-human-activity
https://skepticalscience.com/volcanoes-and-global-warming.htm
https://www.usatoday.com/story/news/factcheck/2023/01/25/fact-check-humans-produce-100-times-more-co-2-than-volcanoes/11074806002/
https://phys.org/news/2019-10-humanity-emissions-times-greater-volcanoes.html
https://volcano.oregonstate.edu/man-versus-volcanos
Carl Spackler: So I jump ship in Hong Kong and I make my way over to Tibet, and I get on as a looper at a course over in the Himalayas.
Angie D’Annunzio: A looper?
Carl Spackler: A looper, you know, a caddy, a looper, a jock. So, I tell them I’m a pro jock, and who do you think they give me? The Dalai Lama, himself. Twelfth son of the Lama. The flowing robes, the grace, bald… striking. So, I’m on the first tee with him. I give him the driver. He hauls off and whacks one – big hitter, the Lama – long, into a ten-thousand-foot crevasse, right at the base of this glacier. Do you know what the Lama says? Gunga galunga… gunga, gunga-lagunga.
It’s an onomatopoeic metaphor…
Must I explain the metaphor? Okay…
The High Priests of Climathesism have concocted mystical theories and models to foretell the battles of the Climate Gods, only to see their oracle portents sliced into the Ravine of Nothingness. No effect, despite the rigorously propounded causationals. In the end it’s just a silly story.
And yet the theorizing proceeds apace. Witness all the armchair hand waving and grasping at models herein. Can’t let go of the divinations, even when there’s no there there. How exasperating! Hunga ga tonga! Hunga hunga ga tonga!
Some thoughts. What else was happening that might affect the situation?
For example, in 2022 we were into La Nina and most people expected more cooling. It didn’t happen. Willis notes there was no warming either. It seems possible there actually was warming from H-T that simply canceled out the La Nina cooling.
In March 2023 the La Nina ended and that’s approximately when the warming started. If we assume there was a La Nina cooling influence and a H-T warming influence, the data seems to match quite nicely both in 2022 and 2023.
Keep in mind that water vapor averages ~250 times stronger warming effect in the upper atmosphere than it does at the surface due to saturation effects. Even at a low concentration this multiplier could make it more significant.
Some of the warming could to be jet stream related. The jet stream looks like it has slowed. Difficult to say how the eruption might have affected the jet stream but it clearly could be related.
In order for water vapor to condense, you need cloud condensation nuclei. Not sure how much exists above the lower Stratosphere. This could be another reason the water vapor will not form ice.
Finally, there are possible effects from the eruption itself. A tsunami was sent crashing into Antarctica at a time of relatively low sea ice. Could this have weakened the ice to the point where it will take some time to build up higher ice levels. Maybe that is why the ice has not expanded as much during the SH winter.
According to UAH we are about .3 C warmer than last July and some of this should be from ENSO. We should see more warming from ENSO later this year. Should be interesting to see how high it goes. It would be interesting to vault past the 1.5 C and 2 C levels.
We should be very careful in dismissing the effect of the eruption. I’ll admit I did that initially but now I’m having 2nd thoughts.
Have we any idea of the “normal” loading of water vapor in the various altitude regimes? Seems like we don’t really know how much “alot” is if we don’t know the proportional increase from Tonga. Maybe with measurements, someone could actually do some sciencing, instead of making BS headlines.
I don’t think of yours as a guess Willis, seems like you’ve falsified the hypothesis (as if any scientist has actually proposed one). What we have is two events that have no connection other than their proximity in time: the definition of co-incidence, and not a very close one at that.
Nice how “they” (whoever they are) can shift the blame for the failure of “anthropogenic” CO2 to raise temperatures over to a natural event. But CO2 is still bad, bad, bad.
Dang Willis, there you go with your white supremacist, patriarchal logic again. I don’t care what the data says , it’s what I FEEL that matters. 😉
I don’t know why there is any discussion of “water vapour” here. Even the top down video of the explosion shows massive amounts of water being thrown up , not transparent water vapour. The stratosphere is around -60 deg C. so any water blasted up that will cause very little to remain as WV. What we could look at is that this was SEA water. How much salt was thrown up?
Wasn’t this one of the genius geo-engineering solutions to global warming ? How about we examine this natural experiment in how well that will work ?
The first question raised by figure 1 is why was there an abrupt and far sharper DROP in April 2022 of equal magnitude. If they can’t explain that attempts to attribute this year’s rise are a non starter.
As we saw with the sulphate aerosols of Mt Pinatubo, the effects on AOD increase as an exponential spread (1-exp(t)) . counteracted by an exponential elimination. This is consistent with very simple chemistry , regarding both processes as “rate reactions”. The eruption: and impulse injection of reagent is convoluted with an exponential kernel. The result is again convoluted with a different exponential ( different time constants ) . This gives a qualitative model of the overall process. Adjusting just the two time constants gives a very good fit to AOD following Mt. P , as I showed here:
https://climategrog.wordpress.com/category/volcanism/

Convolution is a simple sliding window, weighted average calculation, it is basically how we calculate running means and more well designed filters such as gaussian. Exponential window functions are also very useful.
Bottom line, the effects are immediate, continuous, monotonic and are clearly distinguishable after a month. There is no way to get a flat response then a step change 14 weeks later.
“There is no way to get a flat response then a step change 14 weeks later.”
I think it is a little more complicated than that, Pinatubo was an atmospheric opacity event with Enso neutral conditions, this a radiative transfer event that was competing with La-Nina last year.
Well, first off it was 14 months later for the temperature step change, not 14 weeks.
Setting this aside, you may be interested in this excerpt from Wikipedia:
“Noctilucent clouds are first known to have been observed in 1885, two years after the 1883 eruption of Krakatoa. It remains unclear whether their appearance had anything to do with the volcanic eruption or whether their discovery was due to more people observing the spectacular sunsets caused by the volcanic debris in the atmosphere.”
— https://en.wikipedia.org/wiki/Noctilucent_cloud
(my bold emphasis added)
Hmmm . . . it’s been right at 140 years since Krakatoa erupted and atmospheric scientists still don’t know if there was a cause-effect relationship associated with appearance of noctilucent clouds two years after a major surface volcano eruption. Gosh, the science of how major volcano eruptions affect Earth’s atmosphere must not be as simple as one might think.
But wait . . . revisiting your bottom line statement above, I am wrong . . . you surely would not have any interest whatsoever in this fact.
Is this a case of the dog that didn’t bark in the night? One of the feared side effects of more atmospheric CO2 is more water vapor. Here we had an event that significantly increased water vapor in the atmosphere and the response from global weather was crickets. That suggests there is something about the impact of more water vapor that we don’t understand perhaps related to clouds. I think this is an important mystery to understand.
Willis, on your UAH MSU lower stratosphere temperature, the (recording setting) dip in lower stratospheric temperature following, is the signature from the event. The lower stratospheric temperatures were influenced by the particulate matter from the eruption for some number of months.
Yes, the lower stratosphere temperature shows a jump in Jan/Feb 2022 in the SH (but still noticeable in the global value in February) followed by a drop which would be expected due to the SO2/aerosol effect (although much smaller than El Chichon and Pinatubo which had much more SO2). If the recent jump is due to this eruption then as I have said before, the delay could be due to the initial cancelling by the SO2/aerosol cooling and the warming due to the stratospheric water. It will be interesting to see the future developments.
Also, the effects of the eruption were competing with an entrenched La-Nina state. Pinatubo was an atmospheric opacity issue which logically one would assume the effects would be more rapid (sharp decline of incoming), and when you look at the data there are no abrupt changes in global temperatures. It took years to see the trend.
The amount of heat under the surface equatorial Pacific increased from April to July, where it reached its highest value. Doesn’t the global temperature of the troposphere rise during El Niño? Even when it is not strong?

Yes, it does. A good example is the ‘moderate’ El Niño of 2009-2010. Typically, ENSO events peak on UAH Global LT data about 4 months after they peak on the Oceanic Niño Index (ONI).
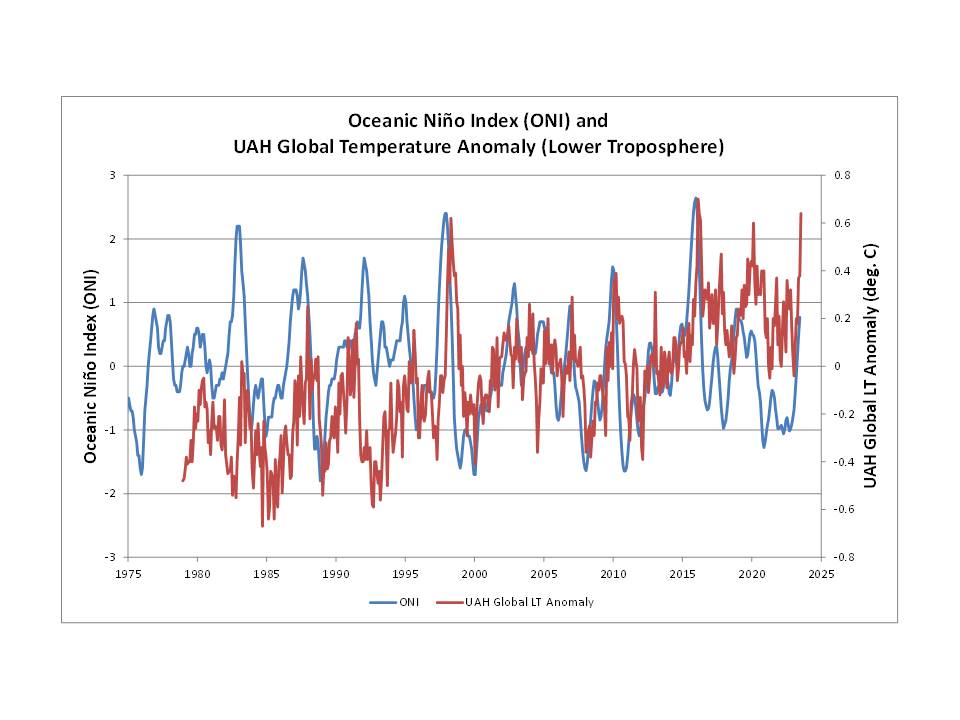

As you will be aware, the Oceanic Niño Index (ONI) is the rolling three-month average of the sea surface temperature (SST) anomaly in the Niño-3.4 region in the equatorial Pacific Ocean. It is quite instructive, in my opinion, to look at the measured SST values instead of simply focussing on the calculated ONI (anomaly) values. In the plot below, the monthly SST values are shown by the red line and the climatology (average SST over a 30-year base period) is shown in blue. The difference between the two curves reflects the monthly anomaly values, which are then averaged over three months to obtain the ONI value.
A key difference between moderate or larger El Niño events and all La Niña events is the fact that former show little or no seasonal cooling, with less of a sharp peak and high SSTs lasting many months, whereas La Niña events are largely limited to each seasonal cooling event separated by a clear warmer period. The peak seen in the ONI data is a consequence of the anomaly values reflecting the absence of this seasonal cooling. This observation is entirely consistent with the view that upwelling cold waters in the equatorial Pacific Ocean are significantly reduced (‘shut-off’) during El Niño events.
W. Could this delay be caused by ozone depletion started by the injection of 13% more water vapor into the stratosphere which then coupled with particulates from Canadian wildfires? The timing is about right. [story tip]
How wildfires deplete ozone in the stratosphere:
https://www.nature.com/articles/d41586-023-00598-w
2023 Canadian wildfireshttps://en.wikipedia.org/wiki/2023_Canadian_wildfires
Typhoons in the Western Pacific. One of them reaches South Korea.


New York Post article from a year ago:
Massive volcano eruption could weaken ozone layer, scientists warn
LINK as posted by Lepton at Free Republic
Tonga’s Eruption Fallout: How It Worsened Australia’s Flood Crisis | In-Depth Analysis