By Christopher Monckton of Brenchley
The UAH global lower-troposphere anomaly for June 2023 is up by 0.01 K from the 0.37 K in May to 0.38 K. The New Pause thus remains at 8 years 10 months:

Nere is the entire dataset from December 1978 to June 2023:

IPCC (1990), in the business-as-usual emissions scenario A in its First Assessment Report, predicted 0.3 [0.2, 0.5] K decade–1 global warming from 1990-2090. Scenarios B, C and D all predicted less warming, but they also all predicted fewer sins of emission than Scenario A. Scenario B, for instance, predicted that annual emissions would not increase from 1990-2025. In reality, however, emissions have increased by more than half since 1990. Scenario A, then, is the emissions scenario on which we must judge IPCC’s predictions, which have proven to be grossly excessive. For the warming rate since 1990 has been only 0.137 K decade–1, showing IPCC’s original range of predictions to be 220% [150%, 370%] of observed reality.
Here is the UAH temperature record since 1990:

The latest el Niño is now well underway. On past form, it will soon bring the current Pause to an end. Already, the unspeakable BBC is licking its chops and predicting new record global temperatures.
The Realitometer, unchanged since last month, continues to show the excess of prediction over observed reality:

Meanwhile, the Climate Realists of Norway have undertaken the arduous task of establishing an international journal of climate science and philosophy. The journal is, perhaps, unique in that it allows challenges to the official narrative. Science of Climate Change (https://scienceofclimatechange.org). Volume 1.1 appeared on 1 August 2021 with a memorial of professor Nils-Axel Moerner, two book reviews and seven full-length papers (including one by me on What is Science and what is not?. The journal is free to read, but asks authors for a small fee to cover publication costs.
I remember Energy and Environment with affection. That journal used to provide a home for peer-reviewed papers that the guardians of the Party Line would not permit to be published elsewhere. Now Science of Climate Change is fulfilling a similar role. Contributions to the new journal are welcome.
Vol. 2.2 published a paper by the late Ernst-Georg Beck, Reconstruction of Atmospheric CO2 Background Levels since 1826 from Direct Measurements near Ground (https://doi.org/10.53234/scc202112/16). A dataset of annually averaged CO2 background levels directly measured from 1826 to 1960 was presented. It was based on a selection process of about 100,000 single samples from more than 200,000 available near ground on land and sea, mainly in the northern hemisphere. One of Beck’s findings was the CO2 level around 1940 peaked at 370 ppmv.
Beck’s paper sparked a good debate, of which a large part can be seen in Vol. 3.2, the latest of seven editions to date (https://scienceofclimatechange.org/volume-3-2-june-2023). Vol 3.2 starts with an essay by Richard Mackey focusing on how observed oscillations in several atmospheric and oceanic subsystems are largely responsible for Earth’s weather and climate. Rotation forces the oscillations and is the primary reason for the climate change we observe. This is currently overlooked.
Ferdinand Engelbeen commented on the article mentioned above by Ernst-Georg Beck. His article had been posted for open review, which attracted several comments on both sides. Professor Hermann Harde showed that the equations for release of CO2 from land and ocean due to higher temperatures can explain the observed peak. In short, there was a debate on a climatic question. That, on its own, is rare and valuable.
Yet more evidence the IPCC models are based on flawed assumptions.
Agreed, but it’s more complex than that. The assumptions were made to support (create) the results. In other words, they did what they needed to do to make the high and unrealistic level of warming. It’s climate politics all the way down.
El Niño is now projected to be moderate, which is no surprise because of how much heat is being released this early https://www.cpc.ncep.noaa.gov/products/analysis_monitoring/lanina/enso_evolution-status-fcsts-web.pdf. Therefore, it’s looking increasingly likely 2023 and 2024 will not break hottest year record and the pause will continue when the El Niño commences. Since the world tends to cool after El Niño, we may even go back to the original pause sometime in 2025, 2026, or 2027.
North America remains cold…
And Australia hasn’t got any warmer.
In fact, cooling since the 2016 El Nino..
Australia has been cooling for considerably longer, according to surface station anomalies … since January 2012.
ACORN mean temperature anomalies averaged 0.918C from Jan 2012 to Sep 2017, and 0.909C from Oct 2017 to Jun 2023.
It’s only a whisker at -0.09C, but a slight cooling nevertheless.
Averaged UAH anomalies warmed +0.028C from Jan 2012-Sep 2017 to Oct 2017-Jun 2023.
However, ACORN anomalies – dodgy as they are – suggest eastern Australia had its second hottest June since 1910 with mean temperatures at +2.14C, bettered only by +2.26C in June 1996.
ACORN purports that eastern Australia’s June minimum anomaly was +1.94C and June’s maximum anomaly was +2.33C.
That max anomaly of +2.33C means eastern Australia has supposedly just sweltered through its hottest June days since 1910.
The media didn’t notice but then again neither did anybody else who presumably enjoyed the apparently warmer than usual days of June.
UAH Australia shows June 2023 as 16th warmest in 45 years,
And on a year-to-date basis, 24th warmest.
Acorn is generally a total mess of sites that are unfit for purpose.
The days weren’t too bad here once the morning frosts thawed.
New England is experiencing a period of seriously hot weather- but perfectly normal for this time of year. Good thing for air conditioners- but, please don’t tell the climate police or they may raid my home and take them away- to SAVE THE PLANET!
We had to run the furnace yesterday for a bit, didn’t get above 60F.
When I lived in Vermont, the long-standing joke was that Summer came on July 4th — and left on July 5th.
New England has had a cold spring and summer beginning. They deserve a little warmth before Autumn cools summer temps down.
“the pause will continue when the El Niño commences”
Well, the new New Pause. “Pauses” start at each big peak. But the “New Pause” was 0.2 K warmer than the old pause, and the new new pause will be as much again. If that is the way you want to count you warming, you can.
So it’s the El Nino’s that cause the warming then?
Yes, and ONLY El Ninos.
CO2 has absolutely nothing to do with it.
“Yes, and ONLY El Ninos.”
Not sure about that. Perhaps you could explain why we don’t just keep warming, I mean these things happen at least once a decade?
“Not sure about that.”
Then you should pay more attention, and start looking at reality for a change.
UAH data clearly shows there is no warming between major El Nino events.
If CO2 was causing warming, it would be continuous… and it is not.
For some 39 out of the last 45 years, the trend has been essentially zero. Just steps up at the major El Ninos.
There is absolutely no CO2 warming signature in the atmospheric temperature.
“Not sure about that.”
“Then you should pay more attention, and start looking at reality for a change.”
Pot meet kettle
“UAH data clearly shows there is no warming between major El Nino events.”
Hmmm how to explain this to someone who struggles. Here I’ll try. If you compare the same points of the ENSO cycle, i.e bottom of the la Nina with the next bottom of the La Nina. Or mid way with the next midway…. there is clearly warming (although I will admit it is not at every point, but then you wouldn’t expect it to be). Sure if you compare the top of the El Nino with the bottom of La Nina there is not. But if you are doing that you are either being dishonest, or you just don’t understand.
“If CO2 was causing warming, it would be continuous… and it is not.”
Common misrepresentation. There is more than one factor at play here. There is not a climate scientist worth their salt who would agree with your claim and that includes the skeptical ones.
“There is absolutely no CO2 warming signature in the atmospheric temperature.
Yes there is. How do you explain this…
chrome-extension://oemmndcbldboiebfnladdacbdfmadadm/https://static.berkeleyearth.org/pdf/annual-with-forcing.pdf
I’ll note you didn’t answer my question. ” Perhaps you could explain why we don’t just keep warming, I mean these things happen at least once a decade?”
The truth is El Nino is no more responsible for the modern day warming, than the the tide is for sea level rise.
“Yes there is. How do you explain this…”
LOL, that Berkeley Earth nonsense is a surface fabrication using all the very worst surface stations available, then FAKED and tortured to give the result they want.
It is totally unrepresentative of real global surface temperatures, let alone the actual atmospheric temperature.
I said “atmospheric temperature”… and you put forward that garbage.. seriously hilarious.
And NO, you are wrong as always… with a very feeble and dishonest explanation, as always.
If you look at the data between major El Ninos,
There is essentially no warming from 1980-1997 (if you take midpoints of the up and down cycles in this period, there is no warming)
No warming from 2001-2015, (first pause)
…and now no warming since 2016 (new pause)
The atmospheric warming has happened ONLY at those two major El Nino surges.
“LOL, that Berkeley Earth nonsense is a surface fabrication using all the very worst surface stations available, then FAKED and tortured to give the result they want.”
Hmmm wasn’t Judith Curry on that team? And didn’t Anthony Watts have so much faith in the team that he said he would accept the results no matter what they were (or something like that)?
No.
Really? I wonder why her name is on this then?
chrome-extension://oemmndcbldboiebfnladdacbdfmadadm/https://berkeleyearth.org/wp-content/uploads/2022/12/UHI-GIGS-1-104.pdf
That data is so bad. Their classification of a good dataset is crazy. Even if there are artificial influences nearby a station, it’s rural so long as the population nearby is small. A rural dataset can be just as and maybe more corrupted than a weather station located smack dab in the city.
Simon you RACIST! Why is it bad for the pot to be Black? Or hypocritical to criticize the kettle for being Black?
Don’t try to wiggle out of this. It’s checkmate. Everything you’ve ever said is proven wrong by the evidence of your wrongthink!
I have no clue what you are dribbling about.
Nice try, but you can’t rely on the “I’m just a simpleton” defense, Simple Simon. You have employed a blatantly racist trope and you need to be cancelled. Everything that is claimed by a racist is automatically false. Even if you don’t know you’re being racist, it’s inexcusable. Don’t you read the Guardian?
“Pot meet kettle”
As you well know, is a brutally insensitive racist reference to the white supremacist saying “Like the pot calling the kettle Black”. The pot is just as Black as the kettle, so it’s hypocritical to criticize the kettle for being Black. We all know that’s what was in your heart.
Don’t tell me I’m being ridiculous. This is serious stuff. 😉
“Why is it bad for the pot to be Black? “
Because both the pot and the kettle are black from the dirt and grime from being on the fire and yet only one sees it. It’s about highlighting hypocrisy …. which seems to be a badge of honour round here.
Omg, Simples! You’re totally unrepentant of your crime! (Tears his cloak)
Black people are dirty and grimy now, is it? Arrrrrrrgggggghhhh! (Roars at sky)
You can see a series of step-wise increases in temps, 80-90s then the early 2000s, then 2015 till now. Sure the trend line still fits, but the steps don’t fit the narrative of being caused by steady increases in CO2 levels.
Next he will come up with some anti-science nonsense of CO2 causing El Ninos…
(after 3 years of la Ninas). 😉
“Next he will come up with some anti-science nonsense of CO2 causing El Ninos…”
That is very funny…. considering what you just claimed.
So no answer for my question huh?
“” Perhaps you could explain why we don’t just keep warming, I mean these things happen at least once a decade?”
Yes, and there have been two warming steps one at each major El Nino.
That is the only warming in the last 40 odd years (out of the coldest period, late 1970s, since the warmer 1930s, 40s)
Are you seriously claiming CO2 causes El Ninos ??
That would be very funny. !
I repeat, since your comprehension level is so low…
There is absolutely no CO2 warming signature in the atmospheric temperature data.
“Are you seriously claiming CO2 causes El Ninos ??”
I think you might have a problem… but I will apologise if you can quote anywhere or at any time I said what you claimed I said. Will you do the same if you can’t?
In Scotland CO2 would be released from court with at worst a Not Proven verdict.
That would be changed to guilty if someone could prove that ENSO was caused by manmade CO2, probably a bit of a long shot.
Oh I don’t know guys. ENSO is a cyclical process whereby the ocean alternately accumulates and expels heat. It doesn’t explain the origin of the heat or determine the trend.
The world is getting slightly warmer which is an entirely good thing unless you hate human flourishing. We don’t know how much of the warming (if any) is actually due to an enhanced greenhouse effect. It’s not inconsistent with the theory of an enhanced GHE though.
If La Niña accumulates heat in the ocean and El Niño expels it then it follows that a constant or slightly increasing heat “source” would not result in a steady rise in temperature but rather in a step-wise alteration of pauses caused by La Niña temporarily negating the warming trend and warm bursts during El Niño.
If the world were in an unfortunate cooling trend, presumably ENSO would still operate but with step-wise alternation of cooling during La Niña and pauses where El Niño temporarily negates the cooling trend.
(facepalm) We ARE in an ‘unfortunate’ cooling trend – we are in a steady decline, with an occasional slightly warm or cooler period, towards the next glaciation. It’s downhill all the way!
Yes over a very long term view, we are cooling. It’s very unlikely that anything we have done or could ever do would change that unfortunate reality.
Nevertheless, even if it’s a dead cat bounce, we’re at least on a short-term reprieve. Thinking positively, if human activity has any impact at all, it’s a benefit.
Did you read the Durham Report yet, CNN Simon?
Sure did. Remind me again how many convictions came from it? Now tell me how many Mueller got?
I also watched the poor guy get a grilling from the sex offender Gaetz. Thought he hadn’t tried hard enough. You can try all you like,but if there is nothing there… there is nothing there.
How ’bout that Alpha Bank hoax, y’all sure went bonkers over that. Straight off Shrillery’s notepad.
And yer boi Brandon, he’s cream of the crop, eh wot?
I’m no fan of Biden now. Too old. But even with his failing mind he is still a far better bet than the crooked Trump. I see one of his (Trumps) employees is not saying he shared top secret doc on the patio at his home.
https://thehill.com/regulation/court-battles/4080498-former-trump-press-secretary-says-he-showed-classified-documents-to-people-on-mar-a-lago-dining-patio/#:~:text=Former%20White%20House%20press%20secretary,a%2DLago%20residence%20in%20Florida.
FF’sS. He has to go inside.
So the Brandon bribery/money laundering machine is ok in your book, yet DJT is guilty of “something”.
And your great link is hearsay from another Marx Stream Media mouthpiece.
Same old CNN Simon.
“So the Brandon bribery/money laundering machine is ok in your book, yet DJT is guilty of “something”.”
If he has done that then no it’s not OK. But to date there has been no evidence produced except here-say. In my book that is not good enough.
Compare that to what we know about Trump… he’s on tape admitting the docs were top secret and that he didn’t declassify them….and there are witnesses ready to testify. Very different.
You need to get out of your leftist kook echo chambers, who protect these criminals.
And you are quoting a twisted partial “tape”, much like Adam Shithead and his endless lies about having evidence of Russian coluuuuuuuusion.
But I forget, you too are a leftist kook.
Right so you think all the evidence against Biden is real even though no one seems to have any…. but the recordings of Trump, that he at no time has denied, are fake. You are obviously an astute man…..
https://youtu.be/J-9a5L_MyKM
Well that is an interesting story. I will look forward to seeing how that plays out.
OK so like I said, it will be interesting to see what happens. Well what happened is this guy is a major crook. Illegally involved in oil trading with Iran and is a foreign agent. Also trying to arrange foreign arms sales to the US’s enemies. Is it any surprise he is trying to bring down the US government by lying about Biden?
Look at the graph Simon do you see continuous warming? No, you see three sets of stairs along with some volcanic cooling in the 80s and 90s.
“Look at the graph’
Which one? all the main data sets show warming. Some more than others.
Really? How about the one currently being used by Monckton? The only good dataset there is?
Monckton uses lots of graphs, which one are you talking about?
It is the nature of the warming that is being discussed. There is no difficulty in fitting a linear regression to a step function. Therefore, that is not proof that it is a continuous warming. Inspection shows that there is a long-term, discontinuous increase that is not explained well by the concentration of CO2 in the atmosphere, or anthropogenic emissions.
I think that’s being a bit too dogmatic, it’s almost as bad as the “Thou shalt have no other radiative forcings but CO2” zealots.
My understanding is that many people, including me, are more in the “We simply do not ‘know’, with cast-iron rock-hard certainty, just how much CO2 is (or is not) warming the mid-troposphere (or the surface)” camp.
A fundamental unanswered question for us is : “How much of the ‘recent’ warming is natural, and how much is from anthropogenic GHG emissions (including, but not limited to, CO2) ?”
“We” consider both “0% and 100%” and “100% and 0%” to be wrong answers.
– – – – –
Updating my “UAH vs. ENSO proxy (ONI) vs. CO2” data to June 2023 gives the graph below.
Notes
– The overall trend for UAH is roughly +1.341°C per century.
– The overall trend for my “scaled” ONI curve (divided by 4 to roughly match the UAH dataset’s overall amplitude / range) is roughly minus 0.234°C/century.
– Even assigning all of that delta to rising CO2 … an enormous assumption ! … that’s +1.575°C per century, let’s say +0.16°C per decade.
– The amplitude of the UAH anomalies is on the order of 1.4°C. Using absolute temperatures, with their “annual cycle”, will give a (much ?) larger range.
– In layman’s terms, 0.16°C per decade relative to even the smaller 1.4°C range equals “not a lot” …
– My Mk I eyeball can see a much larger correlation between the UAH curve and the ONI curve than between UAH and CO2 … but maybe that’s just me ?
Plot the ONI curve as the independent variable and and the UAH temperatures as the dependent variable, do a regression and report the correlation.
Do the same with monthly MLO CO2 concentration as the independent variable, and UAH as the dependent variable and obtain the correlation as above.
Compare the two correlations.
I freely, and publicly, admit that I do not have the “math skills” to do that, especially when it comes to choosing (/ calculating ?) the optimum delay to use.
Just out of curiosity, what correlation numbers did you get ?
The IPCC TAR famously noted … way back in 2001, on page 91 of the WG-I assessment report … that “Climate varies naturally on all time-scales”.
I don’t think limiting CO2 correlations only to the monthly timescale is justified.
For “climate” related discussions annual averages, or their 30-year (or longer) trends, are probably more reasonable.
Had I done it, I would have gotten the same numbers as you if you were to use Excel. I saved the glory for you.
Again, using the El Nino steps to get a trend.
Where is the evidence of CO2 warming in the UAH data.?
There is NONE.
Please re-read my post again.
The ONI data, which is an ENSO proxy remember, has a negative “long-term” trend from January 1979 to June 2023.
The trend for the entire UAH dataset, from December 1978 to June 2023, is positive.
Whatever the deficiencies of limiting ourselves to “the trend of the entire dataset, and only the trend of the entire dataset”, this does constitute “evidence of warming“.
This is correct.
Again, please re-read my post again, more carefully this time …
My main point was that even if 100% of that “warming” had in fact been “caused by” rising CO2 levels … 0.16 degrees Celsius per decade (at an altitude of 5 or 10 kilometres) constitutes a “crisis” and/or an “emergency” ? … Really ?!?
El Nino is a quasi-periodic cycle. This “warming as a stepwise series of pauses” is simply the pattern you get when you add a line to a sinusoidal function:
El Nino isn’t causing the warming, El Nino keeps getting hotter because there is warming.
El Nino’s are an ocean based phenomena. Explain how CO2 back radiation heats the oceans. You must already have that knowledge in order to make your claim.
Learn how radiation heats anything and you will be able to answer your own question. How does a heat lamp keep a pan of food warm when the radiation penetrates but a few micrometers into the solid mass?
But importantly, my comment above says nothing whatsoever about the cause of the warming. The warming is happening no matter what is driving it. My point is that Mr. Monckton’s New Pauses will continue ad infinitum as long as there is quasi-cyclicity superimposed on the long term trend.
Your fantasy little graph is hilarious.
Did your 12 year old trans-child draw it for you ?
The zero-trend that exists between the major El Ninos shows there is no CO2 warming.
The slightly milder climate is entirely beneficial and we don’t even know if we can take any significant credit for it.
“El Niño is now projected to be moderate…”
They could be wrong, as the heat is continually recharged by the high TSI driving OHC up.
As long as TSI remains as high as it is, expect further ENSO region warming through 2023. This solar cycle would have to crash and burn for the next pause to start as early as you suggested, if I understood you right; possibly in 2027.
The current pause will end from the full effect of this current solar warming period.
The high TSI phase of this solar cycle is about only 33% over with now, so there will more ocean warming until the TSI falls below the decadal warming threshold I first established in 2014, and the heat from this ASR gets redistributed by the growing El Niño, in 2-3 years.
I would go so far as to say it is possible we’ll have two Niños by the time the cycle is over.
As this solar cycle is stronger than the last cycle, we can expect another net SST gain by solar minimum, as happened last time, even after the solar cooling period into and past the solar minimum when TSI is low, which also happened last time, which is why the current pause is still going, because the solar warming effect hasn’t fully materialized yet..
See the latest surge in equatorial ocean heat content anomaly driven by a sunspot surge and TSI spike in June, above the warming threshold (the solid white line). The change from La Niña to El Niño conditions happened after the period defined by the previous years’ zero sunspot count equal to zero (black arrows), and after the 356day average sunspot number exceeded 95 SN (red arrows), as I predicted it would in my last year’s works.
Note in the first CERES TSI image above, the two periods of low TSI (in blue), below the decadal sun-ocean warming threshold (red line), centered on the solar minima, were the direct cause of the last two pauses.
Oh, the climate-oligarchy won’t let a trivial matter like a lack of evidence interfere with declaring 2023 the hotest year ever (the dinosaurs are laughing and rolling in their graves).
Actually, it is supposedly the hottest year since 1979, although that is played down and certainly no self-respecting alarmist would mention 1933!
Those were exactly my thoughts which I expressed in a comment to one of Willis’ articles three weeks ago:
Great minds think alike 🤟🏻
Will we ever see an uncertainty interval on these trends? Or on the UAH data?
Oh the irony…
And the monthly trendology clown car show has arrived.
Hello clown car show. You arrived just in time.
So are you going to help Monckton with the uncertainty estimates?
Oh dear, the ball-boy just dropped his ball… embarrassing for it.
How many posts will go by before bgwxyz posts (spams) the link to the NIST uncertainty machine?
Hell kalo’s sock puppet. Good day to you.
That should be hello, not hell. But either works.
yawn, the puppy whimpers. !
And he has his paid upvoters working this morning.
Oh you are desperate!
How is the patent app going for the Bellmaniam yardstick-micrometer?
The patent exists in your head and only there. If you think it’s possible to measure something in micrometers with a yardstick, you explain how. I’ve told you enough times why it won’t work.
It’s almost as if you are using a straw man argument.
Using absurdity to highlight your nonsense propaganda about averaging temperature measurements.
Try again, another fail.
A Reductio ad Absurdum that doesn’t follow from the logic of what I’m saying is just a strawman fallacy.
Great. You win. Carve a notch on your GAT hoax belt.
Oh look, bellcurvewhinerman digs deep and put on his PeeWee Herman costume!
I take it you are not interested in discussing uncertainties today.
Not with an uneducated rube who can’t understand even the terminology.
Yet YOU can’t just post it……, LOL.
The data is merely taken from published temperature datasets. One would normally assume that they would have their own error and uncertainties available so why would they need to be repeated here? Surely you can just go to the source and look at them, can’t you?
“One would normally assume that they would have their own error and uncertainties available so why would they need to be repeated here?”
You might assume that, but you would be wrong in the case of UAH.
As to other data sets, they do, but many he will insist the uncertainties can’t be that small, and make up their own.
However, you don’t need to know the monthly uncertainties to estimate the uncertainty in the trend – and for this short “pause” period it tends to be very large, to the extent that there is no significant difference between this pause and any other period.
More handwaving.
Yawn!
Who cares? There’s a slight warming trend and it’s all good. Maybe (JUST MAYBE) human activity can even take some credit for the good news.
The propaganda machine is spinning out of control. Third day in a row they’re desperately flogging the “hottest day on record” bull.
So, you are saying that a trend of zero is indistinguishable from a trend of zero?
Over this period a trend of zero is indistinguishable from a trend of +0.4°C / decade.
Are you referring to the headlined 106 month period? If so, then I think that this is wrong. Without consideration of the spread of the monthly values, there is a ~42% chance that the trend is greater than zero. But, even given the high ratio of mean/standard error, there is essentially no chance that the trend is at or above +0.4 C/decade. Ironically, if the spread of the monthly values were included, you would be less wrong.
But keep up the good posting. I don’t see how you or any of the other usual posters here get anything done – unless you are phone zoned most of the time – but I at least try to read some of them.
I was basing it on the Skeptical Science Trend Calculator. That suggests a 2-sigma confidence interval of ±0.47°C / decade. I think this includes a very hefty correction for auto correlation, but I couldn’t comment on how realistic it is.
It should be emphasised that this isn’t saying how much of a chance there is if it being that high. It’s saying that if it were that high there’s a chance we might have got the zero trend. And what that actually means with regard to a time series from the single planet we have is something I wonder about.
My 2 sigma confidence interval was for ~0.12 deg C/decade, but without consideration of autocorrelation. So, I can’t backup my criticism*. I’ll start using the Skeptical Science calculator. Also, Nick Stokes Moyhu has a real slick one that allows the evaluation of many different data sets, and also treats autocorrelation. So, I’m out of excuses to shine on that effect.
But I would think the your calculator would yield a ~48% chance that the trend was above zero, but only a ~4% chance that it was above 0.4 deg C/decade. Still qualitatively different. What do you think?
I’ve tried not to do my own estimates for autocorrelation, as it requires more knowledge and experience than I have. That’s why I prefer just to use the values given by SSTC. I think Nick Stokes has said he thinks they are too high, and he might well be right for all I know.
My only other observation on this is that if you look at all trends of 106 months, they vary from over +0.5°C / decade to around -0.2°C / decade, which at least suggests to me the values may well be in the right ballpark. There’s a lot of variability in any trend over such a short period.
Talking about percentages is tricky as strictly speaking, in classical statistics there isn’t a probability of the correct trend, it’s not a random variable. And in Bayesian statistics it will depend on your initial assumptions. My assumption would be that it’s very unlikely that the underlying trend is as high as 0.4 or even 0.2. It would seem much more likely it’s close to the overall trend from the start, i.e. around 0.13°C / decade, but I wouldn’t like to put a figure on it.
In classical terms it’s easier just to say there is no good evidence that the trend has changed since 2014.
I also think it’s a mistake to look at the trend of the pause in isolation. The problem is if you compare it to the previous trend there’s a big discontinuity. If you just project the trend up to 2014 forwards to today, there doesn’t seem any reason to assume a slow down.
In fact, you could ask why the last few years been generally warmer than would have been predicted given the trend up to that point.
This graph projects the trend up to the current start of pause forward, the section in red. The confidence interval here is not correcting for auto correlation.
“I’ve tried not to do my own estimates for autocorrelation, as it requires more knowledge and experience than I have.”
Also me. A few posters here should heed that.
“It would seem much more likely it’s close to the overall trend from the start, i.e. around 0.13°C / decade, but I wouldn’t like to put a figure on it.”
Disagree. It looks like a true “pause” to me.
“I also think it’s a mistake to look at the trend of the pause in isolation.”
Agree. And a key observation
“The problem is if you compare it to the previous trend there’s a big discontinuity. “
Studiously ignored by many here.
Thanks for the time you took to respond.
Taking the uncertainty interval into account actually lengthens the Pause. By simply using the midrange values, one thus minimizes the length of the Pause, which may well, therefore, be somewhat longer than the value shown.
Only if you have some non-satistical definition of the pause; which of course you do.
If you want to define the “pause” as the furthest you can go back and not have significant warming, then yes, the pause will be much longer than the one presented here.
But if you want to actually claim the pause is a real thing, the correct statistical approach is to ask if there is sufficent evidence that your pause couldn’t have happened by chance. In which case the less uncertainty the better.
Seems the ball-boy doesn’t understand basic maths.
A pause means there are no “drivers”, or that “drivers” cancel out.
39 years of “pause” out of 45.
Just 2 major El Ninos… That’s all the climate cobs-wallopers have.
All he understands is the average formula, in fact it is the god he worships.
He has mastered some of the vocabulary of statistics since he has been posting here.
Yesterday he declared that some of the JCGM vocabulary was wrong.
Yesterday I pointed out I thought they were wrong to insist that “standard error of the mean” was an incorrect term. Aparently for those whop worship at the altar of JCGM, as Pat Frank puts it, this is heresy.
So far nobody has been able to offer an explanation as to why the universally used term standard error of the mean is incorrect, it just seems to be an article of faith that is someone managed to get that stuck in the GUM, means it must be true.
Stop whining.
“All he understands is the average formula”
One more than you.
Ouch, this really hurt, PeeWee.
“39 years of “pause” out of 45.”
Could you point to this 39 year pause? Is it in the room at the moment?
Oh that’s clever Bellboy! I have to admit that I chuckled. It’s the things that are plain to be seen that you deny like bird shredders and slaver panels never being able to power modern society that we should be discussing.
My recollection is that when you first started posting here I corrected you on some fundamental mistakes and you acknowledged that you weren’t an expert and were learning as you went along.
Now you are giving expert advice to someone who is known to have a strong background in mathematics?
“Now you are giving expert advice to someone who is known to have a strong background in mathematics?”
No. I’m giving my opinion based on my understanding of what significance means. By all means if you disagree explain why I’m wrong. But don’t try to pull the argument from authority.
I’m not sure what expertise Monckton has. He might have a “strong background” in mathematics, but everything I’ve seen him say does not suggest he puts it to good use.
Though he has proven the Goldbach Conjecture, which I’m sure will be recognized as an achievement any day now.
Not sure what Monckton’s “strong background” in mathematics is, he did a BA in Classics at Cambridge followed by a Diploma in Journalism at Cardiff.
Only after temperatures are presented routinely with their inherent uncertainty. The recent claim about the ‘warmest June “recorded” evah,’ implies an uncertainty of +/-0.005 deg F, but at least one source reported a ‘record’ temperature with an implied 0.0005 deg F.
All that averaging, it works miracles, y’know?
I’m not sure which record you are talking about there. In UAH this was the 2nd warmest year. I assume you are talking about the US if they are still using F. But none of this has anything to do with the uncertainty in the trend.
In the UK according to the MO this June beat the record by 0.9°C for mean, but that does not mean it was the hottest June “evah” or ever as we spell it. Records only go back to the late 29th century, and UK temperature is highly variable and Junes seem a little odd as far as records are concerned.
In CET this was the 5th warmest June, but the warmest since 1846. That year was a over a degree warmer. Given the uncertainty 1676 could have been warmer, but any data that far back is unreliable. In the CRT nesrly all the hottest June’s up to now were before the start of the MO’s records.
And none of this means that June has not been getting warmer by the CET record, it’s just that there seems to be less variation on temperatures. No really hot June’s, but no cold ones, and on average getyong warmer since the mid 20th century.
“Scenario B, for instance, predicted that annual emissions would not increase from 1990-2025. In reality, however, emissions have increased by more than half since 1990. Scenario A, then, is the emissions scenario on which we must judge IPCC’s predictions, which have proven to be grossly excessive.”
Not true: Scenario B predicted that CO2 would increase at a lower rate (500ppm by 2040), that CH4 would flatten off by about 2050 ( 2500ppb vs 3000ppb), CF11 would be slightly lower than scenario A (500 vs 530).
“Phil.” is, as usual, wrong. The emissions scenarios A-D in IPCC (1990) were just that – emissions scenarios. Whether “Phil.” likes to admit it or not, on Scenario B the prediction was that fro 1990-2025 emissions would not rise compared with 1990. Emissions have in fact risen by 54% since 1990. Scenario A, therefore, is the scenario that has eventuated in the real world. Yet the warming predicted under Scenario A was 0.3 [0.2 to 0.5] K/decade, but less than 0.14 K/decade has occurred since 1990 – less than half of what IPCC had predicted at midrange.
It matters not whether IPCC had over-predicted the concentrations arising from the emissions, or the forcing arising from the concentrations, or the warming arising from the forcing. The fact is that IPCC had over-predicted; that IPCC (1990) effectively predicted that ECS would be ten times the predicted decadal warming rate; that on that basis IPCC (2021) still predicts 3 [2 to 5] K ECS, ten times the 0.3 [0.2 to 0.5] K/decade warming rate predicted in IPCC (1990); and that on that basis IPCC should now be predicting less than 0.14 K ECS.
How many more times will the climastrologers repeat this idiocy about the “wrong scenario”?
As bdgwx has shown before Scenario A is not the best match.
jAIr3dZ.png
Here’s a plot of Hansen’s scenarios:
gavin1.png
Talking about ‘being wrong’. The Clerk of the Parliaments has assured me that the ruling of the previous Clerk has not been overturned, contrary to your earlier claim. Also the current Clerk has not ‘tacitly accepted’ that you are a member of the House of Lords.
In fact he told me that you are a peer of the realm, but he does not accept that you are also a member of the House of Lords. He says that you have never been a member of the House of Lords and are not entitled to say that you are. He also tells me that he has written to you telling you this.
The BoM ”acknowledge that the WMO has announced an EN” but ”we have not called it yet”.
BOM’s El Nino threshold is +0.80 for 3 consecutive months. It’s currently at +0.62.
No official El Nino with NOAA yet either. Their threshold is +0.5 for 3 consecutive 3-month periods. Only the latest (A-M-J) currently meets that threshold.
How can you seriously claim a pause when the hottest day on record (and likely since homo sapiens walked the earth) was the day before yesterday? We live on the earth’s surface, not 2 km up in the troposphere.
You mean the claim that is based on data that only goes back to 1979?
Yes, I think a lack of perspective is evident.
Has a loonier statement ever been made since homo sapiens walked the earth?
I don’t believe so.
possibly when Mickey Mann announced the hockey stick?
I don’t think a deliberate lie, like Mann’s Hockey Stick, should be decribed as loony.
Loony means detached from reality. I think these particular Hockey Stick liars knew exactly what they were doing.
You want a real hockey stick?
One created by bureaucrats fiddling with definitions strange to Nature?
Geoff S
I thought he was being sarcastic, but apparently not.
” We live on the earth’s surface, not 2 km up in the troposphere.”
The troposphere is where all the weather happens. It’s where co2 does it’s magic.
“ It’s where CO2 does it’s magic.”
Ie. absolutely nothing !
Actually, there are a lot of people who live above 6,000 feet elevation.
“(and likely since homo sapiens walked the earth)”
Absolute and total mantra BS !
Nearly all the last 10,000 years has been significantly warmer than current temperatures.
We are only a degree or so above the COLDEST period in those 10,000 years.
“the hottest day on record”
Certainly not where I am.
And is that after all the urban heat, aircraft exhausts, air-conditioner outlets etc etc have been “homogenised”… ?
ie is it anything except pure fabricated BS !
Maybe climate activists were born yesterday but not the wise man.
Please note the 2016 data point sitting around +0.9C. The anomaly relative to pre-industrial is currently sitting around +1.4C.
There are a huge number of studies showing large areas of the globe being warmer by a few or even several degrees through the Holocene optimum.
Yes, the Holocene was much more stable than the LIA (which we are fortunate enough to have left behind, just),..
Be very thankful for the minor warming we have had, and let’s all hope the global climate does not cool back down to those colder levels.
Are you a Holocene denier?
Climate scientists who I know argue this very same point that the earth has been much warmer than at present since the last major Ice age 12,000 years ago.
The earth started to cool around 1400 AD with the onset of the Little Ice Age .LIA
The earth only started to warm up from around 1800.
How do we know that ? Just research Glacier Bay Alaska which had glaciers caving into the Pacific Ocean when European sailors first sailed up that coast in the 1700s.
The glaciers retreated many miles after 1850 untill 1900 but very little since then .
The Vikings farmed in Greenland growing barley but most left with the onset of the LIA.
Farmers in Greenland cannot grow barley now so that is proof that it was warmer 500 years ago than at present .
Do some research and people ( Simon and Nick Stokes ) will realize that you are being lied to as climate change has been politicized as a lever to change the world political system.
The United Nations and many other governments have embraced global warming to socialize the world and impose One world government .
These are facts that are ignored because some scientists refuse to accept that CO2 and other greenhouse gases have very little effect on the worlds weather .
The sun and the earths rotation and tilt around the sun are what controls the weather .
I’m convinced they are cogs in the machinery that keeps the lies alive.
You forgot the sarc tag, and that huge peak in temps from 6000BC, and the one from about 1200BC. All much warmer than today.
Europe was certainly warmer in the 6000 BC interglacial but it may not have been a global phenomenon. The Holocene was remarkably stable, despite considerable regional variation causing civilisations to rise and fall.
There are a huge number of studies showing large areas of the globe being warmer by a few or even several degrees through the Holocene optimum.
Heck they ever called the cooling down period the “NEOGLACIATION” (that’s when most of the world’s glaciers formed)
And it hasn’t warmed up much since the minimum temps of the LIA.
See https://wattsupwiththat.com/2023/07/05/the-new-pause-remains-at-8-years-10-months/#comment-3744613 Globally, the average temperature was most likely cooler than the current decade.
Funny that all the previous post-glacial warming episodes only seem to have affected Northern Europe and nowhere else, according to Alarmists like you.
I think that Ron Long can attest to the magnificent glacial features found in the mountains of southern South American — and then there is the Southern Alps of New Zealand.
Civilizations rise and fall for many reasons- including unstable climate but also new technologies, new religions, rising populations putting stress on resources, plagues, etc., etc., etc.
It was a global phenomenon but, because of the peculiarities of our planet, it didn’t happen at the exact same rate at the exact same time.
Much like the ‘warmest day ever’ nonsense – some areas were decidely colder than average which makes a complete mockery of the ‘global average’ silliness – makes about as much sense as having an ‘average depth of ocean’ or ‘average landmass height’.
Averages can be useful. However, that is usually when the variance is a small fraction of the nominal value.
Some of the studies here go back 30K years, come back and tell us if what you say is confirmed
“likely”
Not very scientific.
In response to Mr Papps, if he will get someone to read him the head posting he will find that the Pause is shown as running up to June 2023. An isolated day of warm weather outside that period will not affect the Pause as measured for that period. We do not yet have the full data for July 2023, for the good and sufficient reason that July is not yet over.
True, but please note June was the warmest ever according to the CopernicusECMWF temperature record: https://twitter.com/WMO/status/1676877479212982273
You are being misled by that stupid twitter claim.
The hottest day on record? I believe it especially taking into account the use of instrumentation like this. That’s a gravel surface by the way and for some reason, that’s used as the official record for the city. Can’t imagine that being much different every else in the world.
Well, the Paleocene-Eocene Thermal Maximum was before humans, but not our primate ancestors. How about the Eemian? That is a little closer to humans. OK, tell you what, how about just considering the 1930s?
Nope, 1930s were cooler. The PETM spawned a mass extinction event and is probably not something we should aim for.
The Eocene was also a time of rapid evolution of mammals, and were it not for that, we probably wouldn’t exist.
https://www.ncei.noaa.gov/access/monitoring/climate-at-a-glance/national/time-series/110/tmax/1/7/1920-2023?base_prd=true&begbaseyear=1901&endbaseyear=2000&trend=true&trend_base=100&begtrendyear=1970&endtrendyear=2023
It looks to me like the Summer (July) maximum temperatures were higher than currently.
If I give you the air temperature at 2 Km altitude, do you think that
yousomeone could work out the approximate 2 m surface temperature based on an approximate lapse rate?It would be approximate only. TLT is much more susceptible to ENSO variations and it lags too.
All measurements have inherent errors. Some more than others.
It was hotter than now in the early Holocene….. maybe you should stop reading NYT.
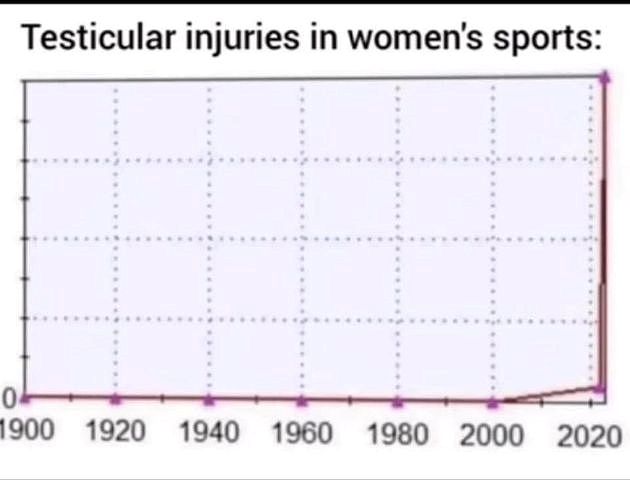
Quite right, your lordship – debate is increasingly a proscribed activity. Climate discussion is not allowed on Twitter and Facebook; academics and students at James Cook University may well have years of undisputed data showing that parts of the Great Barrier Reef recover over time but they are forbidden to talk about it; students at Oxford University will ban you if you describe a person with a penis and testicles as a man; and the Bank of England absolutely insist that a person so equipped can become pregnant. So well done the Norwegians. And well done you for continuing to point out that 2 + 2 does not equal 5 (unless, of course, you are Justin Rowlatt the BBC’s squirm-inducing ‘environmental correspondent ‘)…
In Australia, June 2023 was the 16th warmest June in 45 years.
On a year-to-date basis, 2023 is in 24th place.
And your point is?
Just information… if you can handle the facts..
Australia has been cooling since the 2016 El Nino.
Meanwhile, UAH satellite temperatures just released for June.
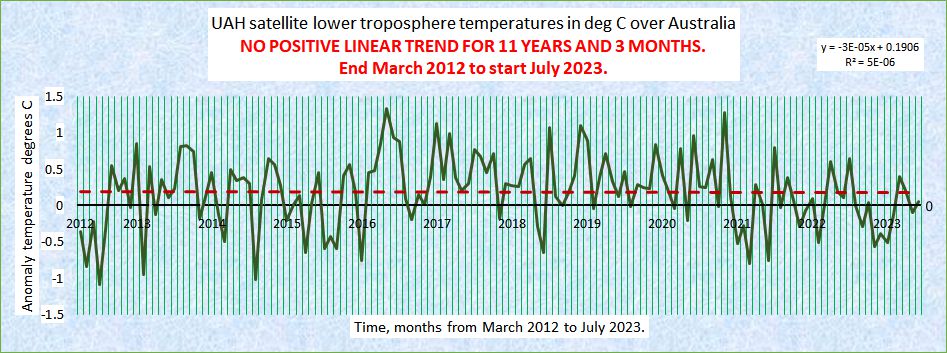
Here is the Australian sector, with the “pause” to now extended mathematically by 2 months.
Now 11 years and 3 months since a postive (warming) trend from now back to March 2012..
Geoff S
At the end of March 2012, UAH showed a warming rate of +0.16C per decade for Australia which was a full warming of +0.52C from December 1978 up to that time.
As of June 2023, the UAH warming rate for Australia has increased to +0.17C per decade and the full warming since Dec 1978 now stands at +0.74C.
During this pause in the rate of warming, actual warming has continued, to the extent that almost one third of all the heat that UAH records for Australia has occurred during the period of ‘pause’ shown in your chart.
In Australia, June 2023 was the 16th warmest June in 45 years.
On a year-to-date basis, 2023 is in 24th place.
It has been COOLING for the last 7 years, and is cooler now than it was 23 years ago.
Again, No warming from 1980-1996 in Australia (see chart), a slight step at the 1998 El Nino, then 23 years of basically zero trend.
Just that El Nino… and even the 2016 El Nino had basically zero effect, a slight bulge, and are now at the same temperature as before it.
There is ZERO evidence of CO2 warming in the Australian atmosphere… period.
(Plenty of urban and “adjustment™” warming by BoM, of course.)
Then you better tell Roy Spencer his data set is wrong.
Its straight from the UAH data.
Sorry you are incapable of understanding straightforward data.
Remember, I am commenting on UAH Australia.
There’s a warming trend in that data. Just because a single monthly anomaly was higher 23 years ago than one today doesn’t mean it’s cooler now than it was 23 years ago.
As I said… a monkey with a ruler
You do realise that the only reason that very slight insignificant trend exists, is because of the 2015/16 El Nino bulge towards right hand of the graph.
Do you even understand how linear trend calculators work and what effects them, and how little they actually tell you !!
Your trend relies totally on that El Nino bulge…
… thus supporting my point that it is NOT CO2 warming.
“one third of all the heat that UAH records for Australia has occurred during the period of ‘pause’ shown in your chart.”
Wow, you will sink clutching at soggy straws…
It was just a slight bulge from the El Nino.. all gone now.
El Ninos are all the alarmists have… its what they rely on and prey for.
That shows that THEY KNOW is absolutely nothing to do with CO2.
Yep. CO2 continues to increase in the atmosphere but takes vacations for decades from the warming it is supposed to cause.
A temporary pause in the rate of warming does not mean that warming has stopped.
The full linear warming rate in UAH before the onset of this latest pause (Dec 1978 – Aug 2014) was +0.11C per decade, which is a total warming of +0.39C.
After this pause, the full linear warming rate in UAH (Dec 1978 – Jun 2023) has risen to +0.13C per decade, which is a total warming of +0.60C.
This pause in the warming rate has resulted in a further +0.21C total warming. Fully one third of all the warming in the UAH data set has occurred during this pause.
TFN.
I do monthly UAH Australia updates of the temperatures back from now until no warming trend in the numbers supplied and using conventional linear least squares math. I do it without speculation. The numbers tell a story. I do not.
That said, I am in agreement with Pat Frank and his recent paper on uncertainty estimates from typical thermometer instruments. He arrives at larger certainties than are popular by a realistic evaluation of variables. If a similar examination was done with the UAH numbers, I would not be surprised to find a large final uncertainty that would play upon the validity of the least squares stats that that I use. However, there are so many claims about warming climate in similar stats terms that I try to balance the story, by showing numbers.
Society should understand that present indications of alleged warming will not continue forever into the future, if the proxy past is a guide. The pause that I illustrate is consistent with a change from warming to cooling, but not a predictor of the future. Imagine the social turmoil when global global warming becomes global cooling, as it is likely to do some time. Be prepared. Geoff S
As I mentioned in reply to your comment above, you appear only to be considering the linear rate and then only over a particular period; your method is not considering the linear accrual of warmth. This is also calculated using least squares linear mathematics. Australia has accrued a further +0.22C of warmth compared to what it had accrued up until the start of the rate pause you have highlighted.
Only at El Ninos.
1980-1996, no warning
… now 23 years since 1998, and we have the same end temperatures just with the 2016 El Nino bulge in the middle. (which is what the linear calculation relies on)
Do keep relying on those El Ninos.. its all you have. 😉
If you only count warming from El Nino and discount cooling from La Nina then of course you will end up with a warming trend!
The trend in ENSO since 1980 is slightly negative – ENSO fluctuations do not explain the warming trend since 1980.
LOL, thanks for confirming you don’t understand the ENSO system 🙂
Yes, It has been COOLING since the 2016 El Nino, or hadn’t you noticed !
Warmed quickly up to the 1930s,
cooled a lot from the peak in the 1940s
,
The late 1970s was a very cool period… extreme levels of Arctic sea ice.
The warming in UAH has come ONLY at El Ninos. no warming at all between them.
Absolutely no CO2 warming evidence. !
You just made this up!
Hilarious!
If there is a warming rate of +0.134 C per decade, as there is in UAH, then this means that, on average, +0.134C of warming has been accrued per 120 months over the course of the record. This equates to +0.001C per month.
The record is 535 months long. 0.001 x 535 = 0.60C of accrued heat. This is how much warmer it is now than it was when the UAH record began, according to them, not me.
So just admit you can’t and don’t understand heat transfer.
It is a fraction of a degree warmer, and as you have shown us,
any warming trend is because of El Nino events…
… so nothing to do with enhanced atmospheric CO2
There is no evidence of CO2 warming in 45 years of the atmospheric data...
none whatsoever.
I’m waiting for him to finish his story – he’s just got to mention the aliens with giant blowtorches soon!
Farther down he declares victory!
Of course not. Natural warming and cooling trends last for centuries with many short pauses and temporary retracements.
What this temporary pause in the rate of warming means is that warming is not accelerating. Why is warming not accelerating? If it is due to increasing CO2 levels, warming should be accelerating. CMIP6 multi-model mean predicts a warming acceleration under the 4.5 scenario, which is the closest to actual emissions.
Only if it is mostly natural should the warming trend show no acceleration under exponentially increasing CO2 levels.
You should be worried that your favorite hypothesis has such a hole. Rather than looking for an explanation, you should contemplate a change of hypothesis.
The warming trend in the CMIP6 multi-model mean looks fairly linear to me (‘CMIP6 mean over all members’, ssp585 used).
Looks can be deceiving, particularly in science.
Shown in b is the 15-year decadal rate of warming from monthly data after deseasonalizing it. The black line is HadCRUT5 with the thick line having a Gaussian smoothing, and the thick dashed red line is the same Gaussian smoothing of the CMIP6 multi-model mean at the SSP245 scenario.
You can see how the rate of warming has increased in models since post-1976 warming started, but not in observations, where it remains at 0.2ºC/decade in HadCRUT.
Observe also how the rate is going down since the 2016 Niño. The longer this situation proceeds the worse the models will look.
If CO2 levels are increasing exponentially, ¿how could the warming rate not increase if the increase in CO2 was its cause?
We all know the planet is warming. The question is not if it is warming or not, but how it is warming because that can tell us why it is warming.
Your claim was that CMIP6 models show accelerating warming; not that they show a warming rate higher than HadCRUT5. Here are the CMIP6 model ssp245 data from 2000 projected to 2100. The warming rate is clearly linear, not accelerating.
It is not a claim. I have shown it. The warming rate in CMIP6 grew from less than 0.2ºC/decade from the late 1970s to the early 1990s to 0.4º/decade from the late 1990s to 2010. Look at the graph. It currently remains at 0.3ºC/decade, well above observations. That is why models are running too hot. If it is in the data it is not a claim.
Obviously, the predicted rate changes in the future as the SSP245 scenario contemplates a great reduction in the rate of CO2 increase starting in 2020 which nobody knows if it will take place or not. For an increase in the rate of emissions, the warming rate must increase. It is an axiom, that the real world is not showing.
But that’s mostly hind-casted. The early part of the model would have been influenced by real temperature fluctuations. That’s not their projection period. I have shown the projected rate of warming from 2000 above, the very model you used, and it is clearly linear.
How? Temperature fluctuations are not an input to the program. They are deduced by the program.
Hindcasted means what the program interprets should have happened to temperature given historic forcings. I thought you knew how models work. Letting them know how the temperature changed would be cheating.
Given the real CO2 forcing, CMIP models interpret that the rate of warming should have increased. This has a very solid theoretical foundation if CO2 acts as believed. The problem is that the rate of warming has not increased in the last 45 years, not what it might do in the future.
If the warming rate has not increased in 45 years, then its cause cannot be mainly the increase in CO2. It may have contributed but it cannot be driving it.
It is from a computer game.
It is NOT REAL.
Computer games are real. A multi-billion dollar industry. I’ve played my share and my fun was real too.
HadCRUD5 is pretty much a fabrication as well.
A maladjusted and lineared-out creation of the AGW agenda., pertaining to nothing much in the way of reality.
CMIP6 multi-model mean…
Meaningless unscientific computer games !
Averaging the outputs of these climate “models” is completely absurd.
Why use SSP5-8.5 when even the IPCC has concluded that it (and SSP3-7.0) are “counterfactual” emissions pathways ?
Why not look at all of the pathways, and compare them to the actual datasets, however imperfect they may be ?
SSP3-7.0 gives you a roughly linear “projection” for GMST all the way to 2100 (at least).
SSP5-8.5 and RCP8.5 give you “accelerating” warming (to 2100).
All other pathways, from SSP1-1.9 to RCP6.0 give you de-celerating warming (to 2100).
.
.
.
Step 1 : To make cherry pie, first pick your cherries …
Give a monkey a ruler, it can draw a straight line…. lol !
Doesn’t mean it comprehends anything.
Sorry, But the only warming over Australia has come from the 1998 slight step..
…, and the 2016 El Nino bulge. (just like USCRN)
Are talking to me or Lord M? We both used the same method.
No, LM knows what he is doing.. He looks at the data.
You don’t look, and just apply linear trends you are clueless about.
There should never be a pause with increasing CO2 levels. You can’t add more “heat trapping” material and get less heat. When will you realize that?
Perhaps that’s why we’re currently at a record low for seaice area for the date by 3,000,000 km^2
Rusty when are you going to understand the purpose of the pause? How much CO2 has gone into the air since 2015? There is a long term warming trend but there have been two pauses, 1 lasted 17 years and this one lasting 8 years and currently still continuing.
Long-term that may be true. But we don’t know, and won’t know with certainty for some time. We will only know in hindsight, and cannot be certain that it might not start warming again. The only thing we know with certainty is that it hasn’t been warming for at least 8 years and 10 months.
We’ve had a cold start to July in my part of the UK, “average temperatures” when the Met Office and BBC are done with them. But galloping to the rescue comes U.S. National Centers for Environmental Prediction with the hottest day on Earth since records began.
According to the BBC “Chances are that July will be the warmest ever, and with it the hottest month ever: ‘ever’ meaning since the Eemian which is some 120,000 years ago,” said Karsten Haustein, from the University of Leipzig.
I’ve lived in my present home for 20 years and this is the first time my heating has come on in June and July – it’s much cooler than usual.
Yup, ditto.
Plums on my 40 year old plum tree are always ripe on July 4th and are always used to make a plum sauce for 4th of July barbeques.
Not this year. The relatives were extremely disappointed.
Whatever the weather, the climate terrorists’ smear campaign against lifegiving carbon dioxide is false. So obviously false that they’re starting to blame nitrogen, too.
The most inconvenient truth is that CO2 is good for you.
Monckton of Brenchley, thank you for this update. It gives us all a good reminder of the unsoundness of the claims of harmful warming. Please keep on.
Also, I appreciate that you see the value of Pat Frank’s work on uncertainty and have said so strongly here at WUWT.
In winter, the troposphere looks quite miserable against the stratosphere. With such a thin troposphere, is it more likely that there will be a significant increase in winter temperatures, or a rapid decrease?
SOI is again positive and trending upward.
https://www.longpaddock.qld.gov.au/soi/
The atmosphere in the South Pacific is not responding to the Niño 1.2 temperature rise because the polar vortex to the south is strong and generates easterly winds in the central equatorial Pacific.