Ever since the beginning of the global warming debate, now labeled “climate change,” there has been one immutable yet little-known fact: All of the temperature data stations used to make determinations about the state of Earth’s temperature are controlled by governments.
In June 1988, when Dr. James Hansen, then-director of NASA’s Institute for Space Studies in Manhattan, went before the Senate Energy and Natural Resources Committee to say that, “global warming has begun,” he was using temperature data collected by governments worldwide from a weather station network that was never intended to detect a “global warming signal.”
In fact, Dr. Hansen had to develop novel statistical techniques to tease that global warming signal out of the data. The problem is, these weather station networks were never designed to detect such a signal in the first place. They were actually designed for weather forecast verification, to determine if forecasts issued by agencies such as the U.S. Weather Bureau (now the National Weather Service) were accurate. If you make temperature and precipitation forecasts for a location, and there is no feedback of the actual temperatures reached and the rainfall recorded, then it is impossible to improve the skill of forecasting.
The original network of weather stations, called the Cooperative Observer Program (COOP), was established in 1891 to formalize an ad hoc weather observation network operated by the U.S. Army Signal Service since 1873. It was only later that the COOP network began to be used for climate because climate observations require at least 30 years of data from weather stations before a baseline “normal climate” for a location can be established. Once the Cooperative Observer Program was established in the United States, other countries soon followed, and duplicated how the U.S. network was set up on a global scale.
However, the COOP network has several serious problems for use in detecting climate change on a national and global scale. The U.S. temperature readings made by volunteer COOP observers are rounded to the nearest whole degree Fahrenheit when recording the data on a paper form called a B-91. When comparing such coarsely recorded nearest whole degree temperature data to the claims of global warming, which are said to be about 1.8°F (1.0°C) since the late 1800s, the obvious questions of accuracy and precision of the COOP temperature data arise.
Even more concerning is that more than 90% of the COOP stations in the United States used to record climate data have found to be corrupted by local urbanization or contamination effects over time, with hundreds of COOP stations found to have been severely compromised by being placed next to air conditioner exhausts, jet exhausts at airports, and concrete, asphalt, and buildings that have sprung up near stations. All of these heat sources and heat sinks do one thing and one thing only: bias the recorded temperatures upwards.
The crux of the problem is this: the NWS publication “Requirements and Standards for Climate Observations” instructs that temperature data instruments must be “over level terrain (earth or sod) typical of the area around the station and at least 100 feet from any extensive concrete or paved surface,” and that “all attempts will be made to avoid areas where rough terrain or air drainage are proven to result in non-representative temperature data.” However, as detailed in this report, these instructions are regularly violated, not just in the U.S. network, but also in the Global Historical Climate Network.
This isn’t just a U.S. problem; it is a global problem. Examples exist of similarly compromised stations throughout the world, including Italy, the United Kingdom, China, Africa, and Australia.
With such broad corruption of the measurement environment, “The temperature records cannot be relied on as indicators of global change,” said John Christy, professor of atmospheric science at the University of Alabama in Huntsville, a former lead author on the Intergovernmental Panel on Climate Change.
The fact is that all global temperature data are recorded and compiled by government agencies, and the data are questionable due to corruption issues, rounding, and other adjustments that are applied to the data. In essence, the global surface temperatures that are reported are a mishmash of rounded, adjusted, and compromised readings, rather than being an accurate representation of Earth’s temperature. While scholars may claim the data are accurate, any layman can surmise that with all the problems that have been pointed out, it cannot possibly be accurate, only an estimate with high uncertainty.
Only one independent global temperature dataset that is independent of government compilation and reporting methods exists, and that is satellite-derived global temperature data from the University of Alabama at Huntsville (UAH), which are curated by Dr. John Christy and Dr. Roy Spencer.
But, even the UAH satellite dataset doesn’t give a full and accurate picture of global surface temperature because of limitations of the satellite system. At present, the system measures atmospheric temperature of the lower troposphere at about 26,000 feet (8 kilometers) altitude.
To date, there is only one network of climate capable weather stations that is accurate enough to fully detect a climate change signal. This is the U.S. Climate Reference Network (USCRN), which is a state-of-the-art automated system designed specifically to accurately measure climate trends at the surface. Since going into operation in 2005, it has not found any significant warming trend in the United States that can be attributed to climate change.
Unfortunately, the data from the USCRN network are buried by the U.S. government, and are not publicly reported in monthly or yearly global climate reports. It has also not been deployed worldwide.
Given the government monopoly on use of corrupted temperature data, questionable accuracy, and a clear reticence to make highly accurate temperature data from the USCRN available to the public, it is time for a truly independent global temperature record to be produced.
This isn’t “rocket science.” Given that governments are spending billions of taxpayer dollars on climate mitigation programs, doesn’t it make sense to get the most important thing – the actual temperature – as accurate as possible? Given today’s technology, shouldn’t we confirm and validate the need for it with a network and data collection that is not relying on a 100-year-old system? After all, if we can send a man to the moon, surely, we can measure the temperature of our own planet accurately.
Anthony Watts (awatts@heartland.org) is a senior fellow for environment and climate at The Heartland Institute.
This post originally ran in Issues & Insights.
“the obvious questions of accuracy and precision of the COOP temperature data arise”
apparently not so obvious to some people who think the data and science is settled
To a certain extent the actual temperatures don’t matter. The problem with climate change (originally global warming) was not in warmer (or cooler) temperatures, but with the impact of those temperatures. The reality is that for any area we can measure the impact of warming by comparing the region to another nearby region of 2-3C higher average temperature and estimate the harm on vegetative growth and so on. Then we should compare the net global total vegetative output in the warmer environment.
Separately we should be able to look at the amount of warming that has happened so far, compare the impact on rainfall, and estimate the total impact if the amount of warming doubles/triples and so on.
I suspect that some areas would be less productive under a warming environment (i.e. Algeria), but many others (i.e. Boreal forests and Siberia) will become more productive. I suspect the impact of temperature change on rainfall is not measurable, and so would be unimportant if tripled.
So, add the costs of the harms associated with warming to the costs of mitigation, and viola! Then you can see the actual need to map out climate change.
Under that sort of analysis I suspect the global impact of warming would be a net positive (i.e. more vegetative growth, some land is lost to higher sea levels, but much more frozen wasteland becomes habitable, etc.).
Are there papers that have done this sort of analysis?
That was essentially Nordhaus’s approach with his DICE model.
Like so much in Economics, it is quite sensitive to the parameters used, particularly the discount rate.
Anthony, I’ve been saying this for sometime but more broadly on ‘climate’ effects too. We need independent research funded on coral reef/polar bear, penguin, etc., health, mountain glaciers, paleoclimate stuff. Susan Crockford, Jennifer Marohasy , and others could manage polar creatures (count and measure health status), coral bleaching and recovery, paleo temperatures of LIA, MWP, etc.
Dendro climate is a bust as it it is practiced and whole trees are ignored! Eg: The 5000 yr old Tuktyaktuk rooted tree trunk, Arctic coast of NW Canada, just by its presence there indicates Holocene T at that location was 5-8°C warmer than now! The Garibaldi Mountain B.C. glacier melt back has revealed a substantial MWP forest under the ice (MWP was demonstrably warmer than today). There is lots of this stuff, for example
https://www.atlasobscura.com/places/ellesmere-island-mummified-forest
There is a number of driftwood species on a currently ice-locked beach on the north coast of Greenland….
Those data points are the ones that matter anyway, not temperature. Temperature and rainfall are important insomuch as they determine the environmental capacity of a region. Imagine a region with ideal temperature and rainfall, but with no nutrients at all in its sandy soil that is unable to hold water. The environment would have a low carrying capacity.
The fundamental question that needs to be answered first is whether the planet is more or less hospitable to life in a future with 2C warming. I strongly suspect a warmer planet is more hospitable to life, not less.
We have satellite data (UAH) and we have ocean data (HadSST3). They agree through the time HadSST3 has been maintained. Why do we need anything else?
The UAH satellite data is great. But is not specific to any actual location. HADSST3 is changing all the time. Every time I used to grab one of their series for my AI modelling it has changed.
JM said: “The UAH satellite data is great.”
Did you know that UAH makes numerous adjustments and performs infilling?
Hows about this….put a satellite in orbit that views the earth in perpetual eclipse and measures the entire IR spectrum? The temp of the earth will be viewed according to the IR radiation. The temp will be according to the clouds….any volcanoes….aerosols….seasons…everything.
Perpetual eclipse means a view of the night side 24/7.
The moon would periodically interfere but no problem – there is still enough data to determine warming/cooling.
We already do that. That temperature of Earth as measured by its IR emissions is about 255 K. Willis Eschenbach works with the CERES data a lot and so can probably give us a more precise temperature. He might even be able to separate it between day and night as well.
That temperature of Earth as measured by its IR emissions is about 255 K.
codswallop
I had to look that up. Anyway, yeah, Earth’s emissions are about 240 W/m2 in the LW. That is sblaw(240 W/m2) = 255 K. Again, Willis Eschenbach might be able to give us a more precise figure. DeWitte & Clerbaux 2018 is often cited on WUWT. They estimate about 238.5 W/m2 in 2018. You get ~255 K using their figure as well. Of course, it does vary some from year-to-year.
that blue marble floating in space is no blackbody.
fanatics running around with their IR sensors set on emissivity 1.0 have not a clue what’s going on.
Which emissivity do you want to use?
As an observer from space I recommend 0.7 looking at a passive white looking thing with 1/3 blues greens and browns. Extremists say 0.6.
One must not confuse their theoretical foundations with stars.
Then it is sblaw(240 W/m2, 0.6) = 290 K.
the point being that observing 240 Wm-2 with a radiometer does not automatically imply a temperature of 255K.
255K is the minimum possible temperature assuming blackbody emission. But we know such an assumption is unphysical with respect to the Earth system.
Take a barren no atmosphere earth, receiving (somehow) only 240 Wm-2 of solar irradiance. The barren rocky crust with similar radiative properties as today must have an emissivity resembling 0.9 or so.
In the real Earth system, such as viewed today, I take the simplistic assumption that about 1/3 of the effective radiative surface at any given time is composed of the mostly oceanic surface with emissivity approaching 1. The bulk of the effective radiating surface observed from space is occupied by the roughly 2/3 cloudy atmosphere with emissivity something like 0.6.
Taken as a weighted whole the effective radiating surface observed from space appears to have the characteristic quality of emissivity 0.7.
One can nibble around at the minutia of emissivity characteristics of different land surfaces, but such a myopia causes one to miss the larger conceptual picture.
Right. I get that Earth isn’t a blackbody. I’m just using the blackbody assumption because the surface isn’t that far from being a blackbody so its a satisfactory assumption.
It sounds like you are talking not about surface temperature but the temperature as might be reasonably perceived by a space based observer optically thick atmosphere and all. I actually hadn’t consider that as the context of antigriff’s post. But I see where that could be the context. Honestly that might make more sense because I don’t see anything in his posts regarding the surface.
BTW…ε = 0.6 is awfully low considering it results in 290 K which is higher than the surface temperature. Even ε = 0.7 seems too low as that is 279 K which is the temperature at about 800 mb. Just blind stabbing at a value it seems like ε = 0.8 would be reasonable since that yields 270 K and is at about 500 mb. I think with an optically thick atmosphere in the LW you’re going to be getting an effective emission height of several kilometers up. No? I am perfectly fine accepting ε = 0.7 if that’s what it is…just seems low to me as I think out loud without looking anything up.
rough figures-
Bulk system radiating height:
calibrating to ε = 0.7 the TOA observed temperature is about 278K radiating 240Wm-2
this results in a global average effective radiating surface height of about 288K – 278K / 6.5K / km
= bulk system radiating height of 1.5km. [you can take 289-279 and get same thing if you like].
environmental lapse rate ad hoc assumption is 6.5K / km.
Bulk atmospheric radiating height:
2/3 atmospheric effective radiating surface component = 1.5km / 0.66 = bulk atmospheric effective radiating height about 2.3km.
Bulk atmospheric radiating temperature:
Bulk atmospheric effective radiating temperature = 288K – (2.3km x 6.5K/km) = about 273K.
273K bulk atmospheric radiating temperature at emissivity 0.6 = atmospheric radiating power about 190 Wm-2.
Those numbers make sense to me. Thanks.
There is compelling evidence that, on average, the globe is warming. That warming trend has been occurring for centuries now.
To understand why it is warming requires a sound understanding of the internal energy transfer, dissipation and storage processes
The fact that no climate model predicts where the temperature is trending up, down or static is proof that the cause is not CO2. In fact climate models show the temperature going up everywhere. That is inconsistent with observation.
Top of the Atmosphere radiation imbalance and temperature change have no correlation. To understand temperature change, the focus needs to be predominantly on the energy transfer processes.
An excellent post, Anthony. Your point is very important.
One small note. You say:
However, this isn’t true. From Dr. Roy’s blog, here are the weighting functions.
I digitized it and got the weighted mean of the lower troposphere (LT) weightings. It turns out that the weighted average is 4.7 km, or about 15,300 feet.
My best to you and yours, and immense thanks for creating and sustaining this amazing public arena for the public peer review of the climate papers and claims.
Your friend, as always,
w.
Yeah. That’s what I get too using a different approach. The UAH absolute temperature is about 263 K which corresponds to 4 km on the international standard atmosphere.
We could start with the fact that about 95% of the data before active all-day airport thermometers was falsified because nobody’s got time to go out at 3am and sling down a couple thermometers then wait around 10 minutes to check the windchill…
95% of past observations were falsified? That is an extraordinary claim. Can you provide extraordinary evidence in support of it?
BTW…what does windchill and 3am have to do with it?
In fact, Dr. Hansen had to develop novel statistical techniques to tease that global warming signal out of the data. The problem is, these weather station networks were never designed to detect such a signal in the first place. Ta simple offset method that is m
wrong.
regardless of what you do. there was an LIA!!!!!!!!
it was colder before, hence warmer now
animals know this
plants know this
the stupid ice knows this
the sea level knows this
try to be smarter than things with no brains.
Aimals have no temperature networks and even they know the climate is getting warmer
Unfortunately, the data from the USCRN network are buried by the U.S. government, and are not publicly reported in monthly or yearly global climate reports.
good god!!!!!!! the data is not buried!!!
since you have trouble finding things ask people who work with the data for a living
hourly, daily, monthly
https://www.ncei.noaa.gov/data/us-climate-reference-network/access/products/
Why We Need an Independent Global Climate Temperature Database
Who is “We”?
Who would pay for this? We?
To date, there is only one network of climate capable weather stations that is accurate enough to fully detect a climate change signal. This is the U.S. Climate Reference Network (USCRN), which is a state-of-the-art automated system designed specifically to accurately measure climate trends at the surface. Since going into operation in 2005, it has not found any significant warming trend in the United States that can be attributed to climate change.
predict CRN shows different results than garbage networks
here monthly tmax
https://www.ncei.noaa.gov/access/monitoring/national-temperature-index/time-series/anom-tmax/1/0
monthly Tmin
https://www.ncei.noaa.gov/access/monitoring/national-temperature-index/time-series/anom-tmin/1/0
what you see is a PERFECT match between
and 2. the stations you attack as inadequate!!!
how is it that A. i can find the data. and
B. the perfect network records the same trend as the “bad network?”
maybe we need independent skeptics!!!
because CRN Vindicates the other networks
The graphs look identical for some reason but the numbers posted below the graph certainly do not.
	ClimDiv	USCRN

2023	1.34°F	1.66°F

2022	-0.26°F	0.07°F

2021	-5.68°F	-5.29°F

2020	0.62°F	0.79°F

2019	-4.80°F	-4.57°F

2018	0.17°F	0.72°F

2017	5.64°F	5.89°F

2016	4.31°F	4.48°F

2015	-2.10°F	-2.00°F

2014	-3.48°F	-3.28°F

2013	-1.04°F	-1.33°F

2012	1.57°F	1.60°F

2011	-2.08°F	-2.02°F

2010	-5.34°F	-5.80°F

2009	2.01°F	1.40°F

2008	-0.48°F	-0.47°F

2007	-3.61°F	-3.37°F

2006	0.19°F	-0.11°F

2005	1.65°F	1.33°F
Mmmm … thanks much, Mosh, but I’m not sure about that.
My problem is this. There are over 10,000 stations in the ClimDiv system. There are currently 143 USHCN stations. In 2005 there were 62 stations, far less than half. Even in 2012 there were only 114.
But the absolute error between ClimDiv and USCRN has NOT decreased as the number of USCRN stations has increased. The agreement is as good back when there were only 62 stations. How can that be?
And in addition, the overall correlation of the two is 0.994 … I’m sorry, but that seems unbelievable. How can the average of 143 really good stations have that kind of correlation with the average of 10,000 mostly crappy ClimDiv stations? At a minimum, you’d expect far less variation in the larger average, due to averaging out of various inaccurate readings … but there’s no sign of that. SD of ClimDiv is 2.18, SD of USCRN is 2.20, no significant difference.
Something doesn’t add up here. Not sure what it is, but the whole comparison seems far too good to be true … and as my daddy used to say, “When something seems too good to be true … it is.”
w.
PHA reduced the monthly RMSD down to 0.16 F. It would seem that it is effective.
I’m not sure I’m following the argument about lower variation. nClimDiv is gridded so it is doing an area weighted average of the cells; not a trivial average of the stations. The variation is going to be dominated by weather phenomenon in both cases.
“SD of ClimDiv is 2.18″
That SD almost entirely reflects weather variation, not measurement uncertainty. And the weather is common to both.
“The agreement is as good back when there were only 62 stations. How can that be?”
I’m not sure that it is:
How do you know how much of the “weather variation” is measurement uncertainty? This is just more of the common assumption in climate science that all uncertainty is random, Gaussian, and cancels thus leaving only the stated values to determine what variation there is. If you can’t measure weather variation accurately then you can’t define the weather variation accurately either!
“How do you know how much of the “weather variation” is measurement uncertainty?”
The close agreement of ClimDiv and USCRN certainly shows how small is the measurement uncertainty. These are totally independent measurements, but share the same weather.
You can’t compare averages and have a clue about uncertainty.
You didn’t even address:
“””””This is just more of the common assumption in climate science that all uncertainty is random, Gaussian, and cancels thus leaving only the stated values “””””
Heck you think a bogus SEM is measurement uncertainty. Tell us do you get the SEM by dividing by the size of the sample or the number of the sample. Lots of folks here think it should be number of samples.
Tell us how you add variance when you subtract random variables to calculate anomalies!
Do you use NIST TN1900 to calculate variance or is that an incorrect procedure?
JG said: “You can’t compare averages and have a clue about uncertainty.”
The type A evaluation of uncertainty using nClimDiv and USCRN is ±0.18 C (2σ) for monthly values.
JG said: “Do you use NIST TN1900 to calculate variance or is that an incorrect procedure?”
Yes you can. Like the GUM, NIST TN1900 recommends either a type A or type B evaluation of uncertainty. I think type A is preferrable here because it will better capture the uncertainty arising from systematic effects.
Malarky. The instrumentation has an uncertainty of somewhere between +/- 0.3C and +/- 0.5C. You can’t change that! You can’t decrease the uncertainty through averaging! If every temperature measurement used in that monthly value has an uncertainty of +/- 0.5C then just how do you think you can somehow get an uncertainty of +/- 0.18C?
What you are calculating is how close you are to the population average. That tells you NOTHING about how accurate that population average is!
If every measurement has a systematic bias of +1C and every measurement is exactly the same then *YOUR* uncertainty will be ZERO with a (2σ)) of ZERO. Your average will be exactly the population average with no standard deviation at all.
YET THAT AVERAGE WILL BE WRONG BY +1C!
I’ll repeat: In climate science all uncertainty is random, Gaussian, and cancels.
TG said: “Malarky.”
So you don’t accept NIST TN1900?
TG said: “You can’t change that!”
Nobody is changing the uncertainty of individual measurements. The question being answer is the uncertainty of the average. It has to be computed.
TG said: “If every temperature measurement used in that monthly value has an uncertainty of +/- 0.5C then just how do you think you can somehow get an uncertainty of +/- 0.18C?”
It is a type A evaluation. It does not use the assessed uncertainty of individual measurements. If you want to use the assess uncertainty of the individual measurements then you perform a type B evaluation using GUM section 5.
TG said: “If every measurement has a systematic bias of +1C”
Anomalies solve that problem. The math is simple. If T is the true value, M is the measured value, and B is the systematic bias then M = T + B. Then the baseline Mb = Σ[Mx, 1, n] / N would carry with it B since each Mx value is biased by B. And since the anomaly is A = Mb – Mo where Mo is the measured observation we have A = (Tb + B) – (To + B) = Tb – To = ΔT so the anomaly is the change in the true value T without the bias B.
TG said: “I’ll repeat: In climate science all uncertainty is random, Gaussian, and cancels.”
No. That is not correct. There is structural error in both nClimDiv and USCRN. That is why the difference between the two is increasing at 0.08 C/decade.
“So you don’t accept NIST TN1900?”
Of course I do – within the assumptions included in the analysis. I.e. measurement uncertainty is zero.
You simply refuse to list out the assumptions made in 1900. I *know* there is a reason for that. It’s because if you did list them you would have to admit that you are assuming all measurement uncertainty is random, Gaussian, and cancels out. It would be a death knell for you stubbornly clinging to the idea that how close you get to the population average is the accuracy of that population average.
It’s an unsupportable meme. In 1900 Possolo assumes that all measurements come from the same device at the same location and they are measuring the same thing – Tmax. That is the very formulation that allows you to ignore the measurement uncertainty – i.e. all measurement error is random, Gaussian, and cancels.
That is simply not applicable when you have different devices measuring different things one time each.
“Nobody is changing the uncertainty of individual measurements. The question being answer is the uncertainty of the average. It has to be computed.”
Your “uncertainty of the average” is how close you are to the population average. It tells you NOTHING about how accurate that population average *is*. It simply doesn’t matter how close you get to the population average if that population average is inaccurate.
“It does not use the assessed uncertainty of individual measurements.”
Of course it doesn’t! It has the inbuilt assumption that all measurement uncertainty is random, Gaussian, and cancels!
That is *NOT* a justifiable assumption when you have different devices making single measurements of different things.
Yet you stubbornly cling to that assumption as being applicable in all situations.
“Anomalies solve that problem.”
Anomalies do *NOT* solve that problem. The uncertainties in the base value and the measured value ADD. Your anomaly is LESS certain than either of the components.
“Mb = Σ[Mx, 1, n] / N”
You keep making this mistake over and over and over no matter how many times it is pointed out to you.
Mb = M_avg +/- sqrt(n x B) where M_avg = Σ[M, 1, n] / N
The uncertainty is *NOT* divided by n. Uncertainties add – they *always* add. You can add them directly or by root-sum-square depending on the situation – but they *always* add.
Therefore, the uncertainty of Mb grows as you add uncertain elements. The uncertainty of Mb adds to the uncertainty of To.
Thus, A= (M_avg – Mo) +/- [sqrt(n x B) + B ]
You just keep on trying to say that the average uncertainty is the uncertainty of the average. B/n s the AVERAGE UNCERTAINTY. It is *NOT* the uncertainty of the average. The uncertainty of the average is [sqrt(n x B) ].
“No. That is not correct. There is structural error in both nClimDiv and USCRN. That is why the difference between the two is increasing at 0.08 C/decade.”
It *is* correct. It’s an unwritten assumption in everything you do. You can’t even recognize that the GUM is based on this assumption by defining its process as being multiple measurements of the same thing using the same device under conditions of repeatability. Thus you can consider the variation in the stated values as a measure of the uncertainty of the measurand. But it only works if there is no systematic uncertainty!
JG said: “Of course I do”
I thought we were making progress until I read your comment further. It doesn’t appear like you accept it at all. You certainly don’t accept the 1/sqrt(N) rule.
JG said: “Anomalies do *NOT* solve that problem.”
Remember, the “problem” is that ALL measurements have the same bias B. Anomalies absolutely solve THAT problem. If you want to discuss a different problem then fine, but let’s focus on the first problem you mentioned first.
JG said: “The uncertainties in the base value and the measured value ADD.”
Irrelevant. We are not talking about uncertainty. We are talking about the bias B. Stay focused and stay on topic.
JG said: “Mb = M_avg +/- sqrt(n x B) where M_avg = Σ[M, 1, n] / N”
This makes no sense.
First…you say you accept NIST TN1900 and then immediately perform an operation contrary to the example. The uncertainty of an average as documented in E2 scales as 1/sqrt(N). But here you scale it as sqrt(N).
Second…you said “If every measurement has a systematic bias of +1C” so the bias B = +1 C. It is not a random variable. It is constant for all measurements. You said so.
JG said: “You just keep on trying to say that the average uncertainty is the uncertainty of the average.”
You are hallucinating. I said no such thing.
JG said: “B/n s the AVERAGE UNCERTAINTY.”
What? B/n is the bias B divided by n. It’s not the average of anything let alone the average uncertainty (Σ[u(ti), 1, N]/N) which no one cares about. Burn this into your brain. Nobody cares about the average uncertainty (Σ[u(ti), 1, N]/N). I’m not discussing it. Possolo is not discussing. It has no bearing whatsoever on the topic. What Possolo is discussing the uncertainty of average (u((Σ[ti, 1, N]/N)). Note that Σ[u(ti), 1, N]/N and u((Σ[ti, 1, N]/N) are two completely different things.
Not once have you mentioned the variance of the distributions you are talking about. Do you ever calculate the standard deviations?
I’ll bet you never read this document from NOAA about expressing averages from CRN have you? Do you wonder why they have used the values expressed?
NDST_Rounding_Advice.pdf (noaa.gov)
Wow, Monthly Means to one decimal place.
That basically means the uncertainty should be no more than one decimal digit either. Your quoted 0.18 rounds to 0.2.
What do you think that does to anomalies? If the temps are rounded to one decimal place, the anomalies should be no better.
You are basically parroting what all the climate scientists have done in the past. Ignore the uncertainty of the measurements and divide everything by the number of stations to reduce it as far as you can. You read all these documents but understand little about what they are saying.
Why do you think NIST used an expanded experimental standard uncertainty? Read the TN 1900 very closely, they explain why expansion is necessary. It moves the standard uncertainty from 0.872 to an interval of ±1.8 which you forgot to mention. Again, it makes anomalies as calculated well within the uncertainty interval which means you have no idea what the value truly is!
JG said: “Not once have you mentioned the variance of the distributions you are talking about.”
I shouldn’t have to. I used the method defined in the GUM. Knowing that I used the GUM on monthly nClimDiv and USCRN data gives you all the information you need to figure out the variance.
JG said: “Do you ever calculate the standard deviations?”
I used the method defined in the GUM. Knowing that what do you think the answer is going to be?
JG said: “Why do you think NIST used an expanded experimental standard uncertainty?”
It is standard practice to do so. As such I expanded my experimental standard uncertainty via K = 2.
JG said: “Read the TN 1900 very closely, they explain why expansion is necessary. It moves the standard uncertainty from 0.872 to an interval of ±1.8 which you forgot to mention. “
I mentioned it when I said ±0.18 C (2σ).
JG said: “Again, it makes anomalies as calculated well within the uncertainty interval which means you have no idea what the value truly is!”
We do know. That’s the whole point of uncertainty analysis. In this case the type A evaluation says that there is a ~95% chance the value will fall inside an envelope bounded by -0.18 and +0.18 C around the measurement. And again…our measurand in this case is the monthly average temperature anomaly of the CONUS.
±0.18 is not the variation in the data as calculated by TN1900. I have been using that method to calculate the expanded uncertainty. Both the baselines for a month and the monthly have uncertainties in the units digit.
Anomalies are calculated using two random variables, the monthly average, call it μ_month, and the baseline average, call it μ_base. The anomaly is calculated by:
μ_month – μ_base. No average, no nothing but subtraction.
When you do an addition or subtraction of two random variables the variances add.
Var₍ᵪ₋ᵧ₎ = Var(X) + Var(Y)
In the TN1900, the expanded uncertainty (standard deviation) is 1.8. The variance for this is 1.8² = 3.24. I have no reason, from what I’ve seen using TN1900 on the baseline, that the baseline variance will be much different, say 2.76.
Var₍ᵪ₋ᵧ₎ = 3.24 + 2.76 = 6
Uncertainty = √6 = 2.45
Anything inside the uncertainty interval is statistically insignificant!
“I have no reason, from what I’ve seen using TN1900 on the baseline, that the baseline variance will be much different, say 2.76.”
You don’t think the fact the baseline is based on 30 years of data will reduce standard uncertainty?
Remember you are dividing the standard deviation of the observations by the square-root of the number of observations. If there are 30 times as many observations that would make the uncertainty 5.5 times smaller.
And when you use quadrature to add the two uncertainties, anything smaller tends to disappear pretty quickly. Say the expanded uncertainty of the base was 0.4 compared to the individual month’s uncertainty of 1.8.
√(1.8^2 + 0.4^2) = 1.84, or 1.8 if you want to round it to 1 decimal place.
And that number allows an error in anomalies in the hundredths digit, if not thousandths?
How about an anomaly of 0.25 ± 1.8? Just how significant is that anomaly?
Also remember, that 1.8 is from a station near the ocean in May. The ocean mediates temperature fluctuations. I’m seeing bigger values. Not a lot, but in the 2 – 3 range. However, that is large enough to question the value of the errors that allow ridiculous low anomaly values. The anomalies I see are between the ± expanded experimental uncertainty.
“How about an anomaly of 0.25 ± 1.8? Just how significant is that anomaly?”
I think you mean 0.2 ± 1.8.
It’s significance depends on what you are testing? It’s significantly different than 4.0 ± 1.8, not significantly different from 1.0 ± 1.8.
“Also remember, that 1.8 is from a station near the ocean in May.”
Yes, one station, in one month, only looking at one data point for each day, and with 1/3 of the data missing.
“I’m seeing bigger values. Not a lot, but in the 2 – 3 range.”
Just for fun, here’s my uncertainty calculations, using the TN1900 method, for May 2022, for all the USCRN stations (those with at least 20 days).
Least certain is Oakley, KS at ±3.2°C
Least uncertain is Port Aransas, TX at ±0.4°C
Mean uncertainty is ±1.7°C.
Two inaccurate measurement devices can read close together – e.g. two micrometers calibrated against a gauge block that is inaccurate. Getting similar readings does *NOT* show that measurement uncertainty is small. It only shows that their calibration is similar – which doesn’t prove there is no uncertainty.
If this is the type of logic that is commonly used in climate science I hope none of the practitioners ever design a bridge I have to drive over.
Yes, but the “Global Climate Temperature” of the headline does not exist !
I know that everyone talks about global temperature and stopping it rising by 1.5oC or whatever, but there actually is no such thing.
Why? Because temperature is an “intrinsic” property of matter, as opposed to “extrinsic”: you can take a series of temperatures of different samples of matter and calculate the average, but that average (oC, oF, Kelvin or Rankine) has no meaning, except as a kind of hand-waving proxy for heat (Joules).
Take a silly example: What is the temperature of a glass of gin & tonic? If I tell you that it was made from gin at 20 oC, tonic and lemon both at 5 oC and a lump of ice at-15 oC, what is the temperature of the whole? The “average” is 3.75 oC but the true answer is we don’t know. We don’t have the masses of each element, nor the specific heat capacities, nor the latent heat, nor any knowledge of the environment.
Now try this with a planet composed of many different materials, with different specific heat capacities, water in three phases, gasses at varying pressures, one side sunny, the other dark, rotating, heating, cooling all at the same time… It has no “temperature” in any meaningful sense.
And if it has no temperature, it is meaningless to discuss a future 1.5oC warming because that won’t exist either.
The whole Global Doominess is underpinned by an unspoken assumption of temperature that just isn’t true. But they carry on regardless; nobody likes a show stopper because the show, and the money, might stop 😉
This is the prime reason that “homogenization” is a joke. Temperature depends on a whole host of factors including elevation, terrain, geography, humidity, etc. Trying to average temperatures on a local basis is a joke and the joke only gets worse as you do it on a regional and global basis.
See the attached graphic of temps in NE Kansas at 6pm, 4/7/23. How are you going to homogenize temps that are so different and get a reliable “average”?
They average anomalies.
Nick, how did they “average anomalies” to determine the so-called “pre-industrial temperature”?
Next, the industrial revolution started in 1769 with James Watt’s invention of the steam engine. This freed humans from immense amounts of mindless labor.
But that was just after the temperature bottomed out during the Little Ice Age … and we have very little information on the global temperature anomalies at that time.
Best regards,
w.
Willis,
You can average anomalies whenever you have enough temperature data. Naturally, the further back you go, the greater the uncertainty.
What uncertainty? I never see any quoted for either the baseline average or the stated value used to subtract from the baseline. What’s the variance of each component? What’s the variance of the anomalies?
Malarky! The anomalies are themselves derived from “averaging” the temperatures you see on the map!
Who cares, warming and CO2 are good for the planet, whether it has warmed 1, 2 or 3 C
That’s a quite “political” reply. Who cares what the truth is, so long as it affirms my views 😉
(and, also quite politically, ignores the facts and argument being advanced. Sadly (IMO) much typical of the watsupwiththat commentariat)
Regarding “But, even the UAH satellite dataset doesn’t give a full and accurate picture of global surface temperature because of limitations of the satellite system. At present, the system measures atmospheric temperature of the lower troposphere at about 26,000 feet (8 kilometers) altitude.”: 8 km is not lower troposphere, but upper troposphere, and that is in the top end of the main sampling range of UAH v6 TLT, which is surface to 8 km. The weighting curve peaks at 3 km, a little lower than the 700 millibar level.
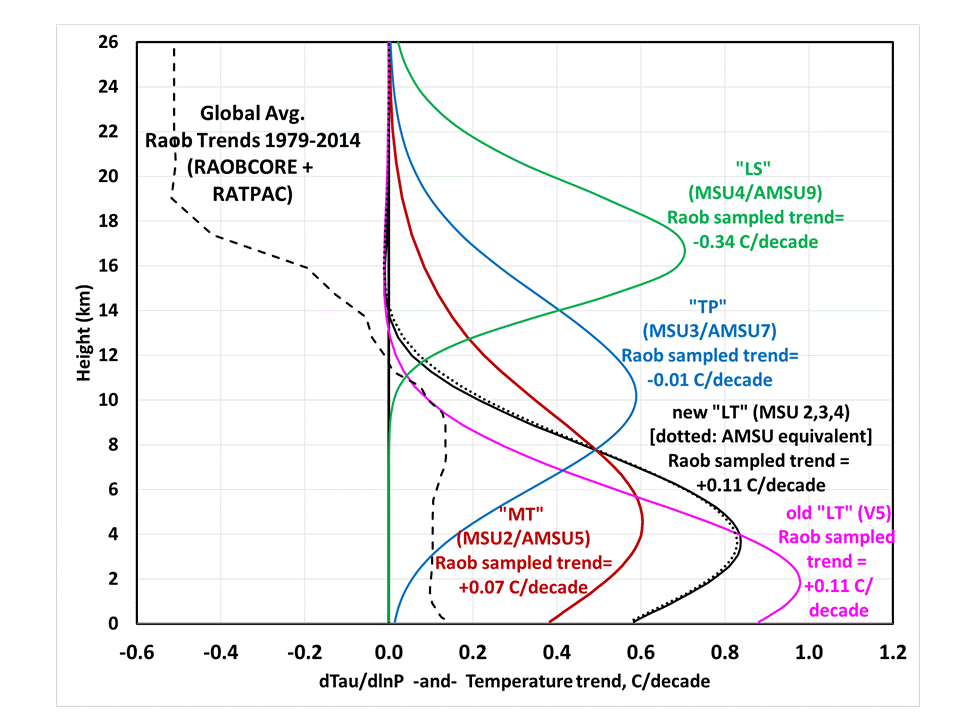
https://www.drroyspencer.com/2015/04/version-6-0-of-the-uah-temperature-dataset-released-new-lt-trend-0-11-cdecade/
Regarding the US Climate Reference Network: It and USHCN agree with each other during the time period when both existed.
My comment will be lost in the noise, but I agree with Anthony wholeheartedly. I think that a world-wide array of weather stations is called for, all of the same design, and all reporting data constantly through Starlink or some other satellite constellation.
These stations should measure temperature, humidity, barometric pressure, wind speed and direction, precipitation rate, and incident solar intensity as a minimum. The engineering standards should be as high or higher than those of the Argo floats, which IMHO are masterpieces.
Most importantly, as many of these stations should be placed at the exact points on Earth as are used as grid points in the majority of climate models.
I think it would be possible to finance such a project privately, and that’s the way it should be (and must be) done.
MSK said: “Most importantly, as many of these stations should be placed at the exact points on Earth as are used as grid points in the majority of climate models.”
I don’t disagree but it would be costly. CMIP6 is down to about 100 km while the HighResMIP subset is down to about 50 km. The highest resolution climate model is about 20 km. At 100 km resolution that would be 51,000 stations. At 50 km resolution that would be 204,000 stations. At 20 km resolution that would be 1,275,000 stations.
MSK said: “I think it would be possible to finance such a project privately, and that’s the way it should be (and must be) done.”
We could probably use the ARGO buoy cost of about $40,000 initial and $200 per profile as a rough guide. So the deployment cost might be $2 billion for 100 km resolution, $8 billion for 50 km resolution, and $51 billion for 20 km resolution. The operational cost $3.7 billion/yr for 100 km resolution, $14.9 billion/yr for 50 km resolution, and $93 billion/yr for 20 km. 10yr cost would be $40 billion 100 km resolution, $157 billion for 50 km resolution, and $981 billion for 20 km resolution. There may be other costs to consider, but it does seem at least in principal.
My comment wasn’t specific enough, I realize. I didn’t mean that we needed a station at every climate model grid point location. It may not be possible to place stations at the vast majority of such locations (especially those over oceans). But there should be some placed, if possible, at four adjacent grid point locations here and there around the globe.
The point is not only to gather data, but also to test the idea that Kriging can give us any kind of accuracy in surface temperature predictions at locations not now equipped with weather stations. I have enough data from my own measurements to say with confidence that temperature interpolation by this means is worthless – I’ve observed 6 degree F differences among stations in a one mile diameter circle, and a consistent 3 degree F difference in temperatures I measure between my house and the end of the road leading to it, 1,300 feet away. The latter measurements were made with the same instrument over a period of five minutes. But it would be good to have some rigorous data data collection, reviewed by independent metrologists, to determine whether or not interpolation is usable. It would also be useful to judge climate models, by comparing the actual measured temperatures with those predicted by climate models.
Further, I wouldn’t propose such a vast number of stations. More is better, of course, but even Argo has only about 4,000 floats to cover 357 million square kilometers of ocean. If we had 4,000 well-placed land weather stations of the type I proposed, especially if they were distributed in both northern and southern hemispheres proportionally with land area, we would be way ahead of the game today.
Oh got it. I actually was thinking of having a high density network. It would have advantages outside of climate research. In fact, it would probably be more useful for weather forecasting than climate research. Climate research would just be an added bonus. And ideally would have some kind of station every 1-5 km in the United States. Again…costly. But…useful.
BTW: UAH & REMSS databases independently & separately report the satellite data that comprehensively & densely cover the oceans, where all the heat is held and by which the global climate is controlled, that largely terrestrial “official” data barely cover by contrast, so are wrong.
Note that RSS is used by activists to attempt to debunk UAH data as if the satellites cannot agree. In fact the data they both present similarly debunk the terrestrial manipulated data. It is 0.8deg colder now than 2016 El Nino, 0.5 colder that the 1998 El Nino, cooling for the least 8 years or so. I suggest, as before, that this is the turning point maximum that natural change cycles should produce about now. The end of the Globalised Warm Period. Going down, anyone? ?dl=0
?dl=0
Brian Catt said: “UAH & REMSS databases independently & separately report the satellite data that comprehensively & densely cover the oceans”
The coverage is actually worse than terrestrial datasets. Here is how UAH dealt with the sparseness of satellite observations.
[Spencer & Christy 1992]
15 grids representing 2.5° of longitude each at the equator is 4175 km. That is an infilling reach of 4175 km and 2 days.
Brian Catt said: “In fact the data they both present similarly debunk the terrestrial manipulated data.”
I’m not sure how you concluded that, but I’ll hear you out.
Brian Catt said: “It is 0.8deg colder now than 2016 El Nino, 0.5 colder that the 1998 El Nino, cooling for the least 8 years or so.”
That falls inline with expectations reasonably well.
Brian Catt said: “I suggest, as before, that this is the turning point maximum that natural change cycles should produce about now.”
I suggest the opposite. That is we are close to seeing a local minimum as the result of the triple dip La Nina and that higher highs are inevitable possibly in as little as 5 years. I base that primarily off the positive planetary imbalance.
Whoa. I spaced on your model posts so far, but 5 terms to capture at least the biggest 25 UAH13 significant spikes (your mileage may differ). And night and day match/nonmatch with/without CO2.
Yes, physics free. But it sure eyeballs well. Do you have any more relevant fit stats?