Guest Post by Willis Eschenbach
As the result of an untimely rush of blood to my head, I posted the first comment on an article at PhysOrg entitled “On this flooded island of homeless people, climate change has never been more real“. Pulling out all the stops to tug at our heartstrings, the article talks about some homeless folks in Sacramento, California who apparently believed the recent drought would last forever. The story was also picked up by the LA Times and other papers. Of course, the LA Times can’t call them “homeless”, that’s not politically correct these days. The term currently used by noble virtue signalers is “unhoused” …
[Lest you think I am without compassion for the homeless, please read my posts “Fixing The Brakes“, “Fixing The EGR“, and “Wandering In Wonderland“. But I digress …]
In any case, here’s the backstory. As a result of thinking the river would never rise again, or perhaps not considering the river at all, a number of the “unhoused” took up residence on a spit of land jutting into the Sacramento river called “Bannon Island”. And of course, 100% predictably, after the last several years of little rain the recent strong rains slowly transformed the spit. First, it turned back into an island, then into a partially-flooded marsh. As the photo above shows, now these unhoused people have to travel to/from their unhouses by raft. Shocking, I know, and obviously a clear sign of “climate change” to the climate ignorati.
My comment was:
When California was dry over the last few years, that drought was blamed on “climate change”, and the people on Bannon Island were high and dry. Mostly high.
Now that we have rainfall again, Bannon Island is partially submerged, and the people on Bannon Island are wet, but likely still high … and that is also blamed on “climate change” …
You guys are a joke. If both wet and dry can be blamed on climate change, then EVERYTHING is the result of climate change. And that’s just nonsensical.
Get a grip. California has had both floods and droughts for untold millennia. And if you live on a low-lying spit of land in a riverbed, you can’t be surprised if the rain may flood your home.
Duh.
w.
Likely somewhat harsh in retrospect, but I don’t care for folks who turn human foolishness and lack of foresight into some kind of bogus climate morality tale.
Amid the usual mud-throwing personal attacks on me that are the typical response of people who have no scientific ammunition, someone said:
It is pretty clear even to high school students: more energy in a system with high contrasts and processes of mixture leads to increased extremes, on either side. You don’t even need earth science for this, of which much can influence the outcome, exacerbate or dampen events.
To which I replied:
While this may be true in theory, recently in fact there has been LESS annual variation in rainfall in Sacramento. Variations in the 1800’s were larger than today. See here for the actual data. (Note there is missing data for a few of the recent years.)
Unfortunately, the PhysOrg website doesn’t allow images in comments. If they had, I’d have posted up this graphic.

Figure 1. Monthly rainfall, Sacramento, CA. Source: KNMI
Of course, this was not convincing to the gentleman, who once again resorted to a personal attack, saying “It is true in practice and you are not a climate scientist.” I had to laugh at that, given that my work has been cited by the IPCC as well as in a Congressional submission to the EPA, and Google Scholar lists ~ 200 citations to my various scientific articles.
However, it did give me an idea about how I could measure “climate extremes”. I decided to take a look at a trailing standard deviation of the Sacramento rainfall data. “Standard deviation” is a measure of the spread of the data. If we’re currently getting more extremes, meaning more wet years and also more dry years, then the standard deviation of the recent data should be greater than that of the earlier years.
A “trailing standard deviation” measures the standard deviation of some number of years previous to a given year. I used a 30-year trailing standard deviation in the graphic below, meaning that each data point in time represents the standard deviation of the 30-year period prior to that time. Why 30 years? Well, calculations over that length of time are generally said to represent the climate rather than the weather. Here’s the result.

Figure 2. 30-year trailing standard deviation of the monthly rainfall in Sacramento, California. Photo shows one of the unhoused inhabitants of Bannon Island considering the vagaries and peccadilloes of the weather.
“Great,” sez I, “done deal!” … however, as has happened more than once, during the night I woke up and thought “Hang on, I left something out!” Grrr … what I’d left out is the fact that as the average rainfall decreases, as has happened in Sacramento, we’d expect the standard deviation to decrease as well. So Figure 1 was not showing what I wanted to investigate.
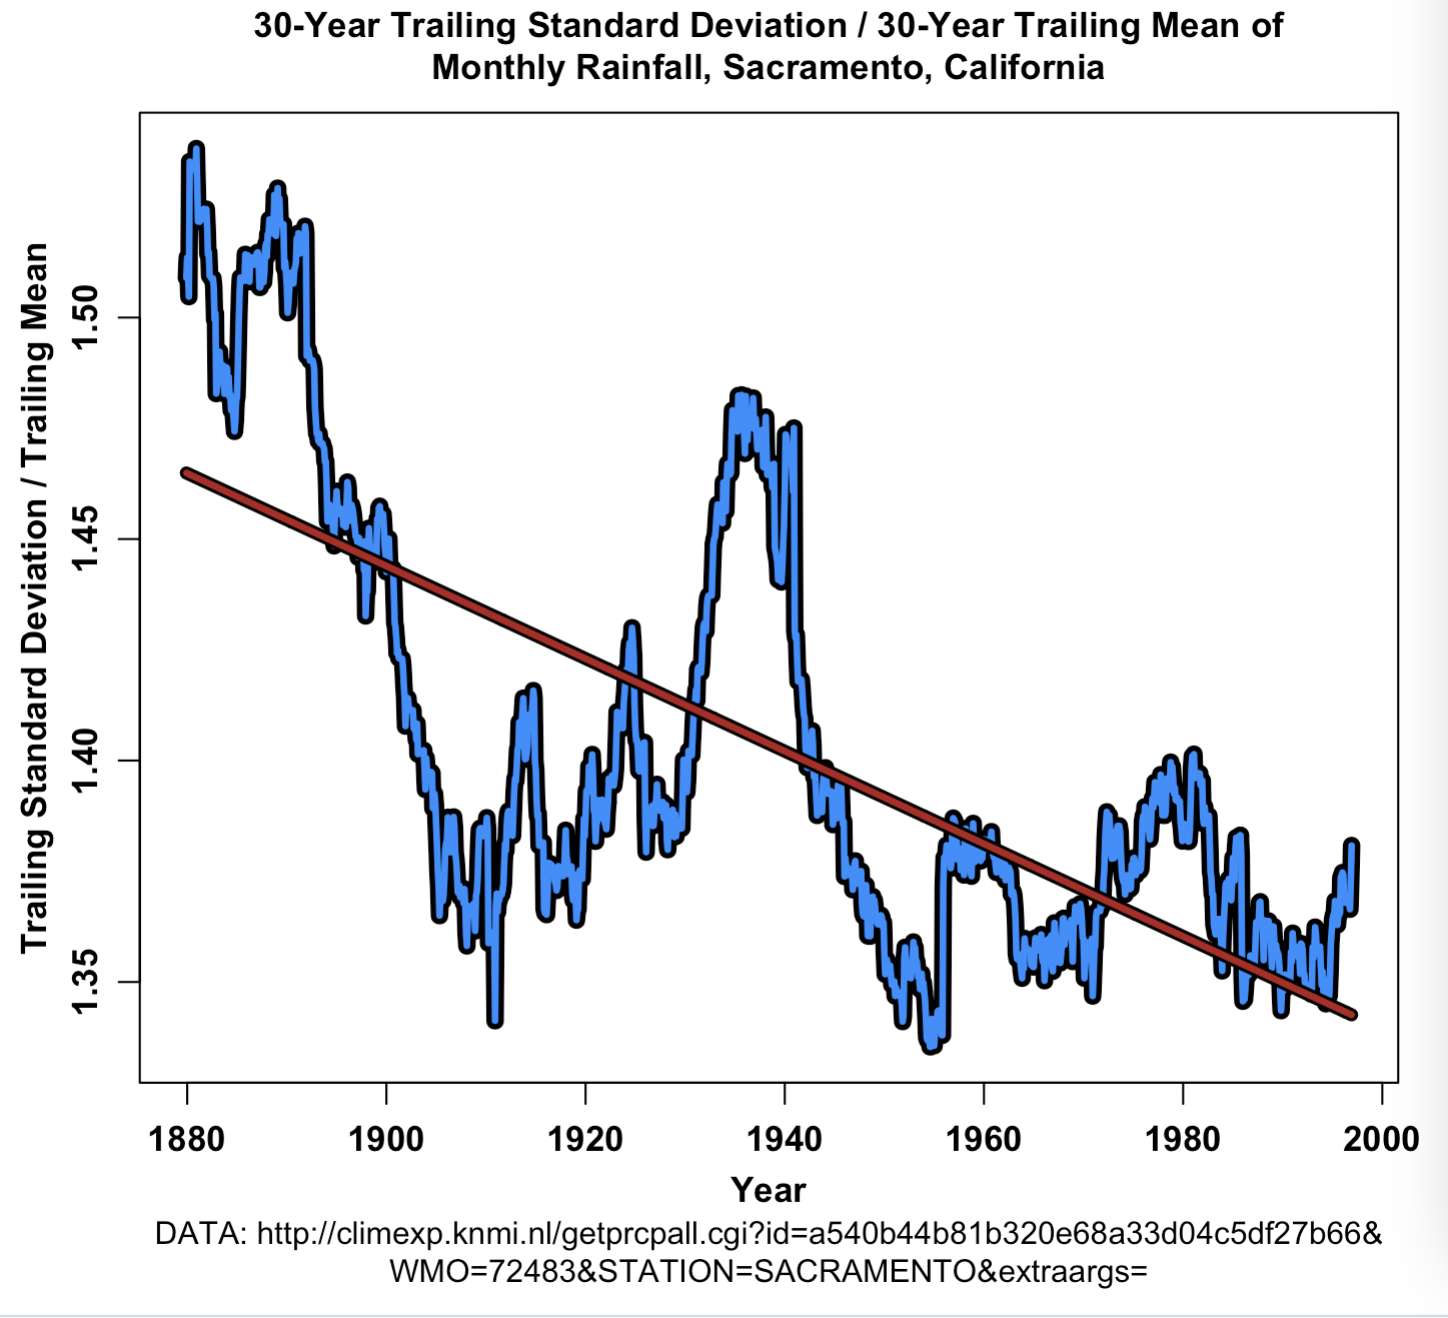
Of course, that kept me tossing and turning the rest of the night, until I got up early and redid my calculations by expressing them as the 30-year trailing standard deviation divided by the 30-year trailing mean (average) of the values. This removes the effects of the change in the mean over time. Here’s that result.

Figure 3. 30-year trailing standard deviation of the monthly rainfall divided by the 30-year trailing mean (average) of the monthly rainfall, Sacramento, California.
So that was encouraging. The shape of the curve changed, but the conclusion of decreasing extremes was unchanged.
Upon seeing that I had another thought, viz, “Well, maybe I’m missing short-term increases in extremes that are masked by looking at a 30-year time span”. So instead, I looked at 6-year trailing standard deviations divided by 6-year trailing means as shown below.

Figure 4. 6-year trailing standard deviation of the monthly rainfall divided by the 6-year trailing mean of the monthly rainfall, Sacramento, California.
Clearly, despite generally rising temperatures and “more energy in the system”, the variations in rainfall in Sacramento have been getting less extreme, not more extreme … go figure.
At some future date I might take a look at some other datasets … any suggestions regarding what data might be revealing gladly accepted, but no guarantees. Ars longa, vita brevis …
California rain is important to me because I live in a redwood forest about six miles inland from the Pacific Ocean, an hour and a half north of San Francisco … and the rain continues to fall. Supposed to rain every day for the next ten days, looks like a real frog-strangler. No complaints from me, though, it fills the water table so our water well will produce in the upcoming summer.
My best to all, wet or dry, housed or un,
w.
As Is My Custom: I ask that when you comment, you quote the exact words you are discussing. This lets everyone know exactly who and what you are discussing, and it avoids many of the misunderstandings that plague the Web.
Of course, a proper green has no idea of what a standard deviation is, and does not care to learn.
A proper green thinks Conservatives are deviant
To a leftist/AGW stall-wart, mathematics is racist, hence irrelevant.
Only what they “feel” is happening, matters.
Climate Howlers and Green Dreamers know all about other “deviations”
‘As the result of an untimely rush of blood to my head, I posted the first comment on an article at PhysOrg entitled “On this flooded island of homeless people, climate change has never been more real“.’
I am familiar with those untimely rushes of blood to my head, as well as the tossing and turning following a less-than-perfect comeback, as I figure out how to make my point even more perfectly, because of course that will convince them. Lately, I realized that the people to whom I address those refutations will never bow to logic or reason. They know only the supremacy of their own words.
Statistically speaking homeless people tend to conglomerate in areas where homes aren’t located. Homes aren’t located in areas where rainfall runoff gathers. But homeless encampments also gather in places where rainfall runoff gathers. The homeless should relocate their encampments to higher ground, perhaps the area surrounding the Governor’s Mansion.
Quite unlike the vast majority here on WUWT, for a period of 2½ years from 2012 to 2015, I was one of those homeless veterans. Finding a place to sleep at night that is somewhat secure yet out of the way is filled with problems. Finding a semi-permanent place is even more difficult.
May be difficult for many to understand, but there are levels in homeless encampments, it’s not just a mass of people situated somewhere. Usually the veterans find the best places that are on higher ground, yet still concealed. The somewhat more stable homeless surround the veterans and rings of progressively less stable form around that core.
While I wasn’t in California, I was in northern Florida where it does rain quite often, so higher ground is much more preferable. But that higher ground is also much more developed which means getting rousted often.
Thanks, derbrix, always good to hear from people with real-world rather than theoretical experience. Having slept on the streets of New York City in my youth, with newspapers wrapped around my legs under my pants, I have at least some understanding of the issues.
w.
That would have been good to include in the original blood-rush reply, as well as a comment that the eco-loons are blatantly exploiting the homeless, poor, racialized, etc., for political gain, yet all their policies make things more expensive and jobs less available.
So the NYT is useful for something?
Plenty of people build in the flood plain due to the perverse incentive of taxpayer-subsidized flood insurance. People build next to rivers and stream, next to the beach, and on barrier islands. In my town, a couple of subdivisions were built inside the local flood control reservoir. Barker reservoir in Houston has levees than extend well into the populated area. These houses are built several feet below the spillway elevation. I can only assume that some palms were greased.
And Pelosi’s back yard.
If the people to whom you address refutations will never bow to logic or reason, then you are writing for the benefit of third parties who may well bow to logic or reason. You are also making it impossible to claim truthfully that no-one has refuted.
Leftists don’t debate
They character attack
A debate in favor of leftist positions can’t be won, that’s why.
That is essentially the approach I used to demonstrate the lack of evidence for increasing heat waves.
https://wattsupwiththat.com/2019/09/06/the-gestalt-of-heat-waves/
Any system will tend towards a steady state with zero extremes unless something within or external to the system causes instability. It matters not how much energy is in the system.
The sun and all stars are great examples of this. Nothing in the universe is more energy packed than a star at some point in its life cycle (from initial birth through maturity and ending in a black hole). Yet stars are extremely stable, with very little variation in the performance of the star in terms of energy content, temperature, energy and matter transfer, and so forth as related to the total energy content of the star (which of course is a function of the fusion process that converts its mass into energy).
Earth’s weather is grotesquely more unstable than the performance of the sun, or any star. Be it on daily weather extremes (temperature, wind speed, precipitation, etc.), or seasonal extremes, or long term climatic extremes. The the vastly higher energy sun just keeps chugging away with very little change … at about the same constant temperature, emitting about the same light energy, and experiencing energetic releases of material across its surface.
“Any system will tend towards a steady state with zero extremes unless something within or external to the system causes instability.”. Now that is a nice clear statement. And that in turn is why I prefer the old Second Law of Thermodynamics (eg. “There cannot be a net transfer of heat from a colder object to a hotter object without work”) to the new law (eg. “the total entropy of a system either increases or remains constant in any spontaneous process; it never decreases”). Funny how it seems to be very difficult now to find any statement of what the Second Law of Thermodynamics actually is. I’m sure that many years ago you could easily find the old definition in a clear single sentence and that a few years ago, you could easily find the new definition in a clear single sentence. Now it seems quite difficult to find any statement of the law in a clear single sentence. eg, Wikipedia‘s page begins with two different statements and neither is the new definition – and I don’t think they got either of them right. Or maybe the new definition has been abandoned? If they have abandoned it, that would be good. Next, they need to abandon the ridiculous “years BP (Before Present)”, which is already 72 years out of date.
An old professor I remember saying that the first 2 laws of thermodynamics are simple: the first law states that regarding energy one can only break even. The second law says you cannot even do that.
Do you have a citation for that claim, or are you claiming to be the authority? I think that should be amended to read “Any system with negative feedback loops …” I seem to remember reading that the B2 stealth bomber was so inherently unstable that it couldn’t be flown by a human and required a computer to make continuous, instantaneous adjustments to the attitude controls to keep it in the air. I would consider the B2 to be a “system.”
Except for a 22-year cycle of varying intensity and spectral output, accompanied by variations in the frequency and intensity of coronal mass ejections and sunspots. Sol apparently brightened significantly in its early years, and can be expected to increase its size to include the orbit of Earth as a Red Giant, before collapsing into a White Dwarf. It is unlikely to become a Black Hole. The point being that a star has such longevity that, compared to human lifetimes, it appears to be stable — until it isn’t. However, viewed in the context of its lifetime, it experiences significant changes without any external influences. Like any living organism, it is born, goes through stages, and eventually dies of old age.
This aerodynamic instability is a typical feature of combat aircraft.
Typical is the inverted V configuration (wrt vertical axis) of the wings compared to a normal V for standard aircraft. This makes them much more maneuverable compared to civilian planes. The pseudo-stability is achieved thanks to computer technology that reacts extremely rapidly to keep the plane under control.
Or as has been said by many cribbage players: You can’t go below zero.
Media and policy extremes have clearly increased–along with debt.
Extremes aren’t increasing statistically speaking. But Extremists definitely are.
I love it when an author uses self-portraits in the text.
Well done, Sir. 🧑🎄😂
Here on the generally/usually bucolic “Gold Coast” (Ventura to San Luis Obispo Counties) we are experiencing rain bordering on heavy rain. Did people think the Santa Clara River with banks a quarter mile apart but also sometimes dry was some ancient artifact?
The local “public” radio station is all over the climate change meme regardless. Somehow they fail to mention they are paid extra to work climate change into any story.
Here in Oz there has been large floods courtesy of a La Nina (Wet season in Oz. El Nino is dry), a negative Indian Ocean Dipole ( more wet from the west and other unusual coincident effects such as net easterl winds on the east coast meaning rain systems stay around for longer in given locations. You know what happened? The flood plains all flooded! Weird but true and obviously caused by CATASTROPHIC CLIMATE CHANGE. Never mind thet the flood plains have formed over the millenia since the last Ice Age caused by …. similar unusual but recurring conicident large scale systems. Fancy that, natural causes which is why (if you listen carefully) you will hear ‘the highest flood level since 1897/1925/1954/1976/1990’ etc.
Greetings from Sacramento, and happy new year to all.
The document at this link https://cepsym.org/Sympro1996/Goodridge.pdf (which has likely circulated amongst this crew many times already) is not ‘proof’ of anything, but is a fun read over a cup of coffee for the alarmist ilk who don’t believe that any extreme rainfall events ever existed in CA before this year (and it does not cover the CA Flood of 1605 which dwarfed the 1861-62 event).
Willis–Interesting dissection; thank you. I was not expecting to see any clear trend at all; bit of a surprise there. Now if we could just get the main ‘dumps’ over the next week to focus on the watersheds for Lake Shasta and Oroville, where there’s still plenty of capacity and a need for more snowpack.
Oroville has been filling up nicely over the last week (faster than 2019 when it filled up last):
https://oroville.lakesonline.com/Level/
Can the homeless people sue based on linear predictions of continued drought and its material cost to living standards and possessions?
“Well, maybe I’m missing short-term increases in extremes that are masked by looking at a 30-year time span”.
Even 30-year spans seem too short to judge climate change. Each data point should be the average at least the prior 60 years or even a century. In my opinion, shorter-term intervals reveal absolutely nothing about climate, only weather.
Agreed. 30 years can only represent a short term trend in weather at best. It is probably chosen because that is the longest with consistently derived data, of sufficient quantity and quality, so that apples are not compared to apples.
Many so called climate scientists are not constrained by this problem and will use mixtures of data to support their claims. I am sure I do not have to name the suspects. They are at best very poor statisticians.
It is too bad we do not have a thousand years or more of satellite data. That is about the shortest period I would trust to show climate variations and trends.
Sorry. Apples compared to oranges
Propaganda, plain and simple. Capture a narrative and push it to the limit and to hell with the facts. “Facts”? “We make the news”.
“make”, as in “manufacture”.
Willis should get with the program. Any unwelcome weather is caused by catastrophic climate change. I have models to prove it.
Any unwelcome thing, or anything that can be twisted into being considered unwelcome, is considered caused by CO2 and global communism and poverty is the only solution.
No one living in saner times and 30-90° N or S would have considered gentle warming of a fraction of a degree per decade a bad thing and certainly not an emergency!
And especially when the “base” used to set the amount of “change” is The Little Ice Age, the coldest period during modern human civilization, and a period of misery, suffering and death.
Warming climate during an INTERGLACIAL period during an ice age is GOOD NEWS, not a “catastrophe.”
Bad weather = climate change
Good weather = just weather
Listen to the recent you tube meeting between Jordan Peterson as interviewer and Richard Lindzen, professor of dynamic meteorology. Do we have to worry about climate change? Yes, says Lindzen, in 5000 years when a new ice age will be emerging.
Well worth the time. Lindzen comes across as too nice to ever go for the jugular in an argument, probably his worst fault.
Actually, it’s an asset.
Not a fault that applies to Mr. Peterson. He shows little hesitancy in expressing what he discerns as truth. Very refreshing, even when you don’t agree with him.
Lindzen has been getting in some insults at Climate Howlers in recent years and he actually advised people to ridicule climate scaremongering. I’ve been ridiculing leftists since 1973.
Thanks for the advice to listen to this interview. I just did, and it is outstanding and well worth the time.
If every weather condition – heat and cold, floods and drought, fierce winds and lulls – are all indicators of climate change then nothing is an indicator of climate change. That is inescapable logic that climate alarmist seem to sorely lack.
Refer to it as climate change AKA global warming to expose some of the hypocrisy. Going along with the tactic of the name change strengthens the alarmist position.
Relative warming increases evaporation; relative cooling increases condensation. What’s worse? i don’t know.
It’s the condensation periods you need to worry about when it comes to excess rainfall and overland flow.
And it’s all relative. The intensity of squeezing out the sponge (cooling/condensation) is proportional to delta T.
absolute temps make little difference, it’s about intensity of variation.
Looking more at the big picture, it should be evident that during periods of global cooling more intense precipitation events are likely. During periods of global warming, more intense drought periods are likely.
The unproven AGW hypothesis, due to emission of trace gas, assumes relative humidity to remain constant. So, the level of saturation of air does not change. A similar “squeeze”, regardless of initial temperature, will result in a similar amount of excess to be precipitated out.
Using this physical explanation, an uptick in heavy precipitation events should be associated with global cooling, not global warming.
Uh, the ice ages are associated with drying. This is usually explained by water locked up in glaciers or less exposed water surface, but the ability of cooler air to hold moisture must have some affect.
during glaciation thousands of metres of ice accumulates on land, until it doesn’t, and deglaciation begins.
Yes. Temperature DIFFERENTIALS increase ‘extreme’ weather, and temperature DIFFERENTIALS are DECREASING with “global warming” because of HOW the increase in AVERAGE temperature occurs.
The tropics remain pretty much the same, the poles and higher latitudes experience the most warming; daytime highs see little change, nighttime LOW temperatures aren’t as cold. All of this DECREASES temperature differentials.
The only thing getting worse about the weather is the HYPE about the weather.
How dare you speak of basic meteorology 101?
That there is real science:
COMING CLIMATE CHANGE CRISIS PROPAGANDA IS SO EFFECTIVE THAT IT PREVENTS MOST PEOPLE FROM ENJOYING TODAY’S WONDERFUL CLIMATE.
U.S. HURRICANES MAKING LANDFALL HAVE BEEN IN A DOWNTREND SINCE THE LATE 1800s.
MAJOR US TORNADOES HAVE BEEN IN A DOWNTREND SINCE THE 1950s.
US HEAT WAVES, DROUGHTS AND FOREST FIRE ACRES BURNED PEAKED IN THE 1930s.
THE 1930s STILL HAVE THE MOST US STATE MAXIMUM HEAT RECORDS OF ANY DECADE, BY FAR.
“”Are Extremes Increasing?””
Only in terms of propaganda, for example…
“”Oceans were the hottest ever recorded in 2022, analysis shows
The records, starting in 1958…””
https://www.theguardian.com/environment/2023/jan/11/oceans-were-the-hottest-ever-recorded-in-2022-analysis-shows
So obvious, aren’t they
I just had to..
Grauniad says 200 Zettajoules in the top 2,000 metres
For the ocean, area= 3.5e14 m2 that becomes 7e23 grams of water
So =0.286 Joules extra per gram
At 4.2 J/g/K I get a temp rise of 0.068 Kelvin (Celsius) or 0.1224 Fahrenheit
Errrrmm, how did anyone measure that?
Grauniad and whoever their source is/are, are lying.
Lying by omission in that they don’t explain their numbers or their context
They will get their reward in due course
Rather you than me!
That’s why they always cry about the energy increase instead of quoting what they actually measure which is the infinitismal temperature increase.
I suspect the check is in the mail
Grauniad journalists are utterly innumerate, and fail to understand that subtracting one huge number with a wide numerical uncertainty like total ocean heat content from another huge number with a wide uncertainty is a completely meaningless exercise.
“”Oceans were the hottest ever recorded in 2022, analysis shows
The records, starting in 1958…””
The accurate records start with ARGO floats about 20 years ago
Funny! I would guess that the rush was diverted to the lower head! Only this explains why waste time in a site such as PhysOrg.
But anyway… Majority of the herds of modern moron slaves DO NOT KNOW anything about Climate and Weather. What they “know” is what they see on the TV set (and most recently on their smartbrainsphones) and if the TV set says that “Climate Change” is a man-made phenomenon than NOTHING you can say/write will change the little piece of brown matter that exists in the Skull of the modern moron slaves. Majority is not able to engage in Critical Thought.
So no surprise the comments written…
One thing I always find funny and have good laughs is when I see the constructions we build in flood plains being flooded after an Raining. Cracks me up.
Without resorting to review of ANY data it is obvious that this complainer doesn’t know his ass from a hole in the ground about science.
More energy in any system has absolutely nothing to do with extremes – as the real world has already shown us. Total energy says nothing about time dependent and spacial dependent distribution of outputs from the system. A perfectly stable system, regardless of its energy state, will have equally stable outputs. A less than perfectly stable system will vary in its performance in accordance with instabilities and the factors that control them.
That’s all you need to tell this idiot.
The idiot part comes from thinking that CO2 and other gasses give the atmospheric system more energy – that can only come from the Sun and the climate priests assure us the Sun is perfectly constant and no feedback loops apply to any of its variations (unlike magical CO2).
At best, CO2 is an insulator and would therefore dampen the system – obviously holding in the heat, slowing down cooling at night, etc. But the CO2 in the air would also catch and re-emit the relevant frequencies of the Sun and spread out the energy, for lack of a better way to put it, given lack of caffeine. Think of the difference in daily extremes of temperature between the dry Sahara, and the Amazon that is insulated by all that water vapour.
Exactly right PC, but if you could convince college ‘educated’ kids that the extremes aren’t increasing, they will simply turn around and start shrieking that we are losing the extremes at an increasing pace because of climate change! Kids in the future won’t know what snow or summer is!!
the “more energy = more extremes” is an argument I hear often. I think they teach it in “how to argue with an evil climate denier 101”
My answer is that clearly then Antarctica has the most pleasantly stable weather on the planet
An alternative way of explaining this is to point out that weather is driven by differences in temperature between zones on Earth, not by absolute temperatures. By warming the Earth, the temperature contrast between the Poles and the Tropics is reduced, leading to diminished extreme weather. Global cooling therefore increases said extreme weather. Evidence for this comes from typhoons and hurricanes, which were both more frequent and more intense during the Little Ice Age.
Thanks for your hard work Willis.
The only way anyone can claim that extremes are increasing is by ignoring past data and evidence from past scientific studies and weather events published in newspapers.
With the hurricane season not meeting expectations and tornado strengths decreasing that leaves them droughts and floods and boy how they are playing up what is going on in California now, despite the fact that it has happened several times before when CO2 levels were considerably lower.
Thanks for doing the work Willis. I was aware that the “increasing extremes” mantra did not hold up to standard deviation analysis. I suspected though, that there must be some areas that were seeing more extremes…..surely the west coast precipitation, for example.
Guess I was just a victim of the steady drumbeat of news. I love your graphs, and saved them to my collection. The graphic of the homeless is great for this forum, but one with a plain background might help when I’m dealing with the other crowd, for whom data must look very official, or be dismissed as fake.
Here you go. We’re a full-service website.
w.
I’m sure Willis knows this, but some may not. That river height in the Sacramento-San Joaquin Delta is a function of the very large drainage area, northwards of 47,000 mi^2 which extends from almost Oregon to Tehachapi, just about every bit of California that is neither coastal nor LA. All that water flows out the very narrow Carquinez Strait. Mix this idea with some Winter Solstice high tides.
This is what it looks like today
These islands of the delta are mostly man-made by early 20th century farmers who built levies in the swamps to take advantage of very fertile peat soils. Willis’ favorite thing guvmet came along and started telling the farmers just how they may-or may not maintain their levees which caused many levees to fail, notice the failed Frank’s Tract on the map near Brannon Island.
I think that ground squirrels and beaver played a role in Frank’s Tract levee failures.
Ground squirrels and beavers cause climate change, scientists say, and it is worse than they thought !
Headline in next day’s newspaper.
I guess we never learn from history. See USGS ArkStorm: https://www.usgs.gov/publications/overview-arkstorm-scenario
https://www.usgs.gov/media/videos/arkstorm
“ArkStorm”
Etymology: a 1,000 (k) year Atmospheric River = ARk Storm
i believe urban outdoorsman is the correct term .
i believe urban outdoorsman is the correct term . …The West Without Water is The book on californias’ history of droughts and floods . not as bad now as in the past.
Garboard,
Thx for the book suggestion.
As to homelessness I suggest Michael Shellenberger’s “San Fransicko”.
It is a current look at homeless policies, mainly in SF & California, but also compares
outcomes/policies elsewhere [including Europe]. I haven’t finished it yet but the
discription of in-fighting among the Progressives on which [ineffective] policies to pursue
was enlightening.
Anyone who lives [or builds] in a river bed [or a flood plan] has some lose screws or is
smoking something, which according to Shellenberger, are the root causes of much of the “unhoused” problem. That and policies that effectively encourage such behavior.
I like your analysis in this article.
I think your most compelling statement is the following:
“If both wet and dry can be blamed on climate change, then EVERYTHING is the result of climate change. And that’s just nonsensical.”
However, logic and data will not change the mind of someone who has their mind made up.
John Steinbeck described California weather very well way before Global Warming / Climate Change / Crisis.
East of Eden – John Steinbeck – Published 1952
Chapter 1 – Description of the Salinas Valley – Paragraph 10
“I have spoken of the rich years when the rainfall was plentiful. But there were dry years too, and they put a terror on the valley. The water came in a thirty-year cycle. There would be five or six wet and wonderful years when there might be nineteen to twenty-five inches of rain, and the land would shout with grass. Then would come six or seven pretty good years of twelve to sixteen inches of rain. And then the dry years would come, and sometimes there would be only seven or eight inches of rain. The land dried up and the grasses headed out miserably a few inches high and great bare scabby places appeared in the valley. The live oaks got a crusty look and the sagebrush was gray. The land cracked and the springs dried up and the cattle listlessly nibbled dry twigs. Then the farmers and the ranchers would be filled with disgust for the Salinas Valley. The cows would grow thin and sometimes starve to death. People would have to haul water in barrels to their farms just for drinking. Some families would sell out for nearly nothing and move away. And it never failed that during the dry years the people forgot about the rich years, and during the wet years they lost all memory of the dry years. It was always that way.”