From Dr. Roy Spencer’s Global Warming Blog
by Roy W. Spencer, Ph. D.
Summary
Comparison of rural with urban temperature monitoring sites across Canada during the summers of 1978-2022 shows the expected average nighttime warm bias in urban areas, with a weaker daytime effect. When applied to the Landsat imagery-based diagnoses of increased urbanization over time, 20% of the temperature trends in a small region encompassing Calgary and Edmonton are found to be due to increasing urbanization. Calgary leads the list of Canadian cities with increased urbanization, with an estimated 50% of the nighttime warming trends across 10 Canadian mostly-metro areas attributable to increased urbanization, and 20% of the daytime warming trends.
Introduction
This is part of my continuing investigation of the degree to which land-based temperature datasets are producing warming trends exaggerated by increasing urbanization (the urban heat island effect, UHI). Current “homogenization” techniques for thermometer data adjustment do not explicitly attempt to correct urban trends to match rural trends, although I would expect that they do perform this function if most of the stations are rural. Instead, they amount to statistical “consensus-building” exercises where the majority wins. So, if most of the stations are affected by increasing UHI effects, to varying degrees, these are not forced to match the rural stations. Instead, the reverse occurs. For example, in the U.S. the Watts et al. analysis of station data showed that the U.S. homogenized dataset (USHCN) produced temperature trends as large as those produced by the stations with the worst siting in terms of spurious heat sources. They further found that use of only well-sited thermometer locations leads to substantial reductions in temperature trends compared to the widely used homogenized dataset.
I consider homogenization to be a black-box approach that does not address the spurious warming in thermometer records resulting from widespread urbanization over time. My approach has been different: Document the absolute temperature differences between station pairs and relate that to some independent measure of urbanization difference. The Landsat-based global dataset of “built-up” areas (which I will loosely refer as measures of urbanization) offers the opportunity to correct for urbanization in thermometer data extending back to the 1970s (when the Landsat series of satellite started).
My main region of focus to start has been the southeast U.S., partly because my co-researcher, John Christy, is the Alabama state climatologist, and I am partly funded through that office. But I am also examining other regions. So far, I’ve done some preliminary analysis for the UK, France, Australia, China, and Canada. Here I will show some initial results for Canada.
The first step is to quantify, from closely-spaced stations, the difference in monthly-average temperatures between more-urban and more-rural sites. The temperature dataset I am using is the Global Hourly Integrated Surface Database (ISD), archived on a continuing basis at NOAA/NCEI. The data are dominated by operational hourly (or 3-hourly) observations made to support aviation at airports around the world. They are mostly (but not entirely) independent of the maximum and minimum (Tmax and Tmin) measurements that make up other widely-used and homogenized global temperature datasets. The advantages of the ISD dataset is the hourly time resolution, allowing more thorough investigation of day vs. night effects, and better instrumentation and maintenance for aviation safety support. A disadvantage is that there are not as many stations in the dataset compared to the Tmax/Tmin datasets.
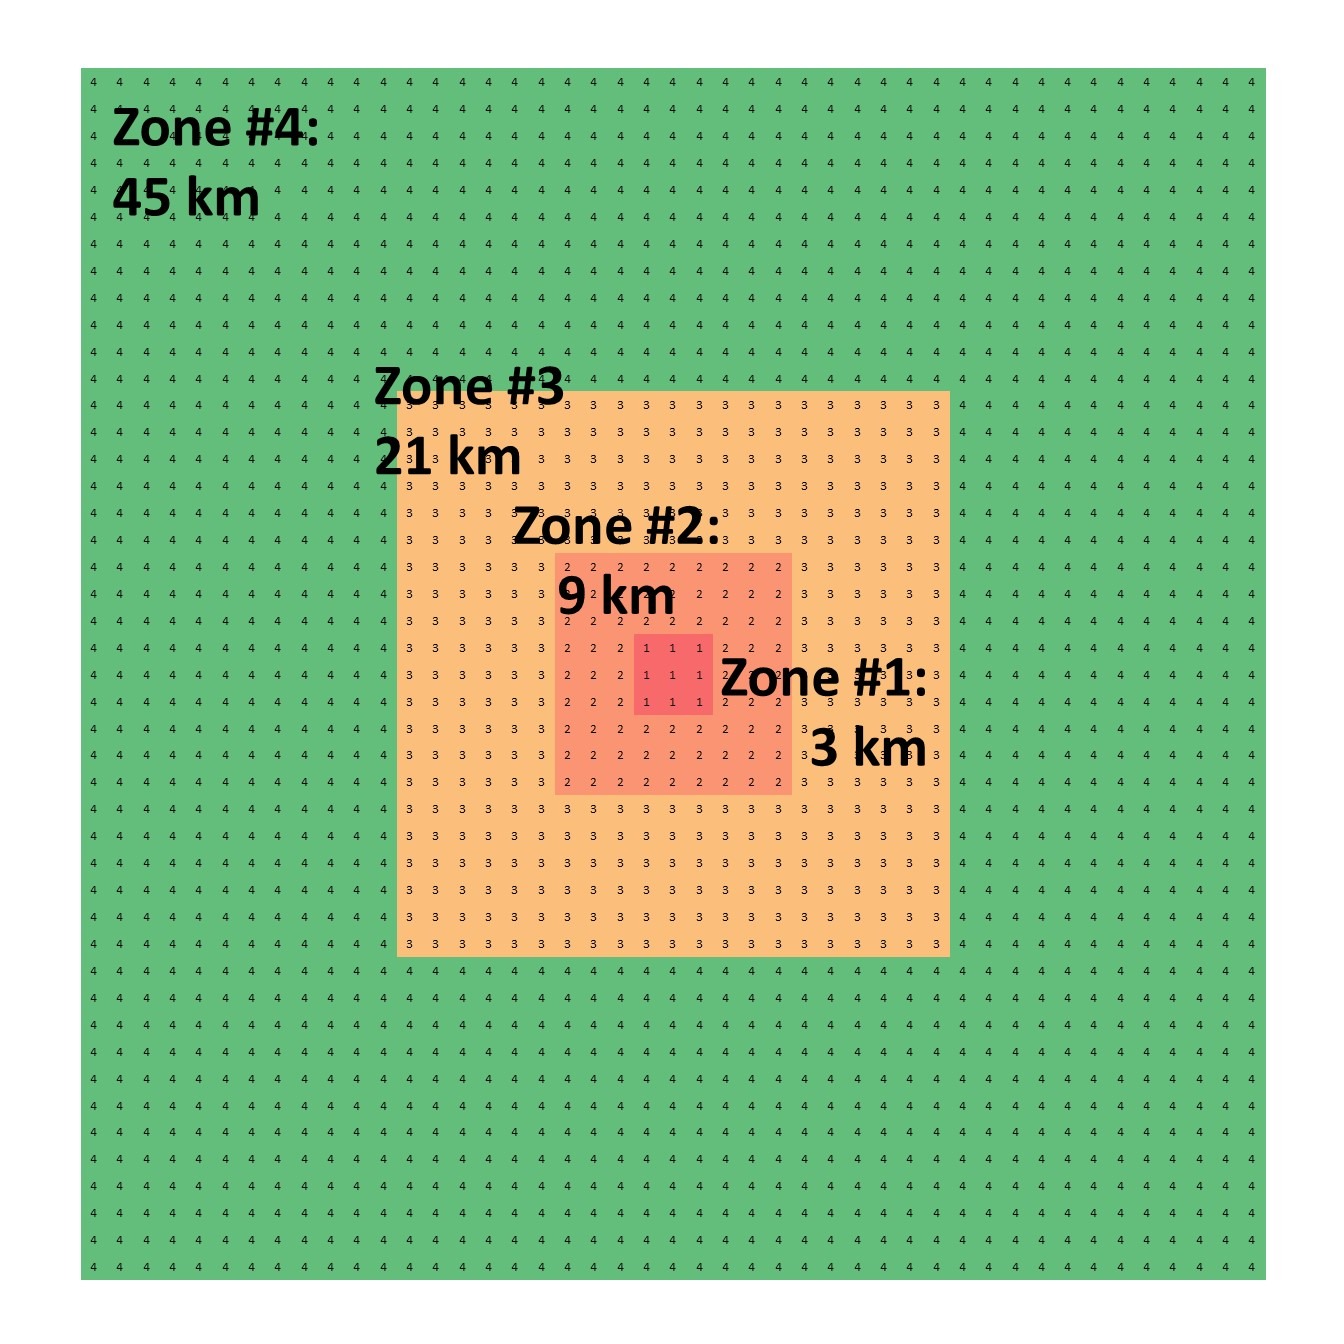
As I discussed in my last post on the subject, a critical component to my method is the relatively recent high-resolution (1 km) global dataset of urbanization derived from the Landsat satellites since 1975 as part of the EU’s Global Human Settlement (GHS) project. This allows me to compare neighboring stations to quantify how much urban warmth is associated with differences in urbanization as diagnosed from Landsat imagery of “built-up” structures.
Urban vs. Rural Summertime Temperatures in Canada
Canada is a mostly-rural country, with widely scattered temperature monitoring stations. Most of the population (where most of the thermometers are) is clustered along the coasts and especially along the U.S. border. There are relatively few airports compared to the size of the country which limits how many rural-vs-urban match-ups I can make.
For 150 km maximum space between station pairs, as well as a few other tests for inclusion (e.g. less than 300 m elevation difference between stations), Fig. 1 shows the differences in average temperature and area-average Landsat-based urbanization values for (a) 09 UTC (late night) and (b) 21 UTC (afternoon). These times were chosen to approximate the times of minimum and maximum temperatures (Tmin and Tmax) which make up other global temperature datasets, so I can do a comparison to them.

As other studies have documented, the UHI effect on temperature is larger at night, when solar energy absorbed into the ground by pavement (which has high thermal conductivity compared to soil or vegetation) is released into the air and is trapped over the city by the stability of the nocturnal boundary layer and weaker winds compared to daytime. For this limited set of Canadian station pairs the UHI warm bias is 0.21 deg. C per 10% urbanization during the day, and 0.35 deg. C per 10 % at night.
Next, if we apply these relationships to the monthly temperature and urbanization data at ~70 individual stations scattered across Canada, we get some idea of how much increasing urbanization has affected temperature trends. (NOTE: the relationships in Fig. 1 only apply in an average sense, and so it is not known how well they apply to the individual stations in the tables below.)
Across approximately 70 Canadian stations, the 10 stations with the largest diagnosed spurious warming trends (1978-2022) are listed below. Note that the raw trends have considerable variability, some of which is likely not weather- or climate-related (changes in instrumentation, siting, etc.). Table 1 has the nighttime results, which Table 2 is for daytime.
TABLE 1: Most Urbanized Nighttime Temperature Trends (1978-2022)
| Location | Raw Temp. Trend | De-urbanized Trend | Urban Trend Component |
| Calgary Intl. Arpt. | +0.33 C/decade | +0.16 C/decade | +0.17 C/decade |
| Ottawa Intl. Arpt. | +0.07 C/decade | -0.08 C/decade | +0.14 C/decade |
| Windsor | +0.20 C/decade | +0.08 C/decade | +0.11 C/decade |
| Montreal/Trudeau Intl. | +0.47 C/decade | +0.36 C/decade | +0.10 C/decade |
| Edmonton Intl. Arpt. | +0.10 C/decade | 0.00 C/decade | +0.10 C/decade |
| Saskatoon Intl. Arpt. | +0.03 C/decade | -0.04 C/decade | +0.07 C/decade |
| Abbotsford | +0.48 C/decade | +0.41 C/decade | +0.07 C/decade |
| Regina Intl. | -0.11 C/decade | -0.17 C/decade | +0.06 C/decade |
| Grande Prairie | +0.07 C/decade | +0.02 C/decade | +0.05 C/decade |
| St. Johns Intl. Arpt. | +0.31 C/decade | +0.27 C/decade | +0.04 C/decade |
| 10-STN AVERAGE | +0.19 C/decade | +0.10 C/decade | +0.09 C/decade |
Calgary, Ottawa, Windsor, Montreal, and Edmonton are the five station locations with the greatest rate of increased urbanization since the 1970s as measured by Landsat, and therefore the greatest rate of spurious warming since 1978 (the earliest for which I have complete hourly temperature data). Averaged across the 10 highest-growth locations, 48% of the average warming trend is estimated to be due to urbanization alone.
Table 2 shows the corresponding results for summer afternoon temperatures, which from Fig. 1 we know have weaker UHI effects than nighttime temperatures.
TABLE 2: Most Urbanized Afternoon Temperature Trends (1978-2022)
| Location | Raw Temp. Trend | De-urbanized Trend | Urban Trend Component |
| Calgary Intl. Arpt. | +0.26 C/decade | +0.16 C/decade | +0.11 C/decade |
| Ottawa Intl. Arpt. | +0.27 C/decade | +0.19 C/decade | +0.09 C/decade |
| Windsor | +0.27 C/decade | +0.20 C/decade | +0.07 C/decade |
| Montreal/Trudeau Intl. | +0.35 C/decade | +0.28 C/decade | +0.06 C/decade |
| Edmonton Intl. Arpt. | +0.42 C/decade | 0.36 C/decade | +0.06 C/decade |
| Saskatoon Intl. Arpt. | +0.18 C/decade | +0.13 C/decade | +0.04 C/decade |
| Abbotsford | +0.45 C/decade | +0.40 C/decade | +0.04 C/decade |
| Regina Intl. | +0.08 C/decade | +0.04 C/decade | +0.04 C/decade |
| Grande Prairie | +0.19 C/decade | +0.16 C/decade | +0.03 C/decade |
| St. Johns Intl. Arpt. | +0.31 C/decade | +0.28 C/decade | +0.03 C/decade |
| 10-STN AVERAGE | +0.28 C/decade | +0.22 C/decade | +0.06 C/decade |
For the top 10 most increasingly urbanized stations in Table 2, the average reduction in the observed afternoon warming trends is 20%, compared to 48% for the nighttime trends.
Comparison to the CRUTem5 Data in SE Alberta
How do the results in Table 1 affect widely-reported warming trends averaged across Canada? Given that Canada is mostly rural with only sparse measurements, that would be difficult to determine from the available data. But there is no question that the public’s consciousness regarding climate change issues is heavily influenced by conditions where they live, and most people live in urbanized areas.
As a single sanity test of the use of these mostly airport-based measurements of temperature for climate monitoring, I examined the region of southeast Alberta bounded by the latitude/longitudes of 50-55N and 110-115W, which includes Calgary and Edmonton. The comparison area is determined by the IPCC-sanctioned CRUTem5 temperature dataset, which reports average data on a 5 deg. latitude/longitude grid.
There are 4 stations in my dataset in this region, and averaging the 4 stations’ raw temperature data produces a trend (Fig. 2) essentially identical to that produced by the CRUTem5 dataset, which has extensive homogenization methods and (presumably) many more stations (which are often limited in their periods of record, and so must be pieced together). This high level of agreement is at least partly fortuitous.

Applying the urbanization corrections from Fig. 1 (large for Calgary and Edmonton, tiny for Cold Lake and Red Deer) lead to an average reduction of 20% in the area-average temperature trend. This supports my claim that homogenization procedures applied to global Tmax/Tmin datasets have not adjusted urban trends to rural trends, but instead represent a “voting” adjustment where a dataset dominated by stations with increasing urbanization will mostly retain the trend characteristics of the UHI-contaminated locations.
Conclusions
Canadian cities show a substantial urban heat island effect in the summer, especially at night, and Landsat-based estimates of increased urbanization suggest that this has caused a spurious warming component of reported temperature trends, at least for locations experiencing increased urbanization. A limited comparison in Alberta suggests there remains an urban warming bias in the CRUTem5 dataset, consistent with my previous postings on the subject and work done by others.
The issue is important because rational energy policy should be based upon reality, not perception. To the extent that global warming estimates are exaggerated, so will be energy policy decisions. As it is, there is evidence (e.g. here) that the climate models used to guide policy produce more warming than observed, especially in the summer when excess heat is of concern. If that observed warming is even less than being reported, then the climate models become increasingly irrelevant to energy policy decisions.
Absolutely on the nippy side, still.
Wow! Thanks for all the work this post implies.
I’m sure those reading will not be surprised by the results.
It is good to have the data and charts for reference, even though
the likes of John Kerry and other world elites won’t care.
On the contrary, they will care and will want to have their fact censors and character assassins on the job asap.
It seems to me that the best plan to prevent all this spurious ‘heating’ is to BAN large metropolitan areas! No more cities! If there are no large concentrations of ‘heat’ then there wouldn’t be any concern about rising temperatures! That would sure poke a hole in the ‘warmist’s’ theories, huh? Also, living out in the suburban environments would be better for all concerned. The city is no place to raise a family.
As commented concerning the previous work (SE US) post, this is actually a BIG deal.
The first run CMIP requires is a 30 year hindcast. The models must be parameterized due to the CFL constraint on numerical solutions to PDEs. The parameters are tuned to best hindcast per the CMIP requirement. BUT if the 30 year temperature history is half UHI rather than AGW, then the climate tuning is high by a factor of two. And the models do run hot by about a factor of 2 (Christy tropical troposphere models vs radiosonde charts, Model vs EBM ECS: 3.4 vs 1.7).
Good point Rud. This work also destroys IPPC’s “proof” that global warming is due to human CO2. They say that they know it is because they don’t see the warming if they run their models without CO2. That was always circular reasoning—if you program a model to show warming with added CO2, it is going to show no warming without CO2—but if much of the measured warming is not due to CO2, then the reasoning is not only circular, it’s also just wrong.
“This work also destroys IPPC’s “proof” that global warming is due to human CO2.”
This work does NOT destroy anything
The fantasy of CAGW continues.
It would continue if historical temperatures were accurate too !
CAGW is barely related to any historical temperature trends.
Sadly, Richard is correct. It’s difficult to imagine anything short of a major astroid strike, or WW III, that would kill the CAGW movement. Even a worldwide fossil-fuel energy crisis just makes them scream still louder. Presumably in an attempt to quell the cacophony of cognitive dissonance that must echo in their otherwise empty skulls.
Yes, this “proof” is so bad that it is effectively fraudulent.
If the models were based on the laws of physics and nothing else, then maybe. But of course they are heavily paramaterized (i.e. fudged) so the only thing they prove is that the models’ creators are totally obsessed by CO2.
Ironically, the greater their CO2 assumption, the greater the “proof”.
These models cannot predict the future. They are a perfect example of “garbage in, garbage out”.
Chris
Of today’s ~ 8,001,015,000 souls inhabiting this planet, I assert that 8,000,000,000 are totally apathetic about the climate “crisis”.
They want the things they said concern them in the UN’s 7-million persons One World survey into what people find most necessary in life.
Climate change comes last of the 16 essentials listed.
My home weather station is 10 miles NNE of the Calgary airport in a rural environment and is fairly consistently 2 or 3 degrees C lower than the official Environment Canada airport reading. This over nearly 2 decades with 3 different home weather stations. Elevation difference about 10 meters. Also Calgary airport used to be outside the city and has since been surrounded by buildings and streets, and it’s weather station has 3 times as many runways and taxiways nearby as it did in the 70’s and an order of magnitude more air traffic.
“rational energy policy should be based upon reality, not perception. To the extent that global warming estimates are exaggerated, so will be energy policy decisions”
Dr Spencer has hit the nail on the head. The biggest problem in addressing the climate issue is dumbed down politicians who display little evidence of the ability to reason coherently, cohesively and cogently. Perhaps all aspiring politicians need to pass an aptitude, language and logic test?
An aside
My engineer son commented on the UHI effect: if large cities have experienced a higher than 3ºC average temperature increase with no discernible deleterious or harmful effect on human, animal or plant life, why the panic?
Nobody listens to engineers….unless something screws up really big…then they wont go near the wreckage until they seek the engineers say-so…odd that…
Has PM Dances-with-Unicorns ordered his ATM card shut down yet? Dangerous man that son of yours!
You’ve got a smart son.
I have been lookin at the USCRN data set every few months to see how long the no-warming-to-present trend was. Then I went back last month and noticed that all the anomalies had changed. What had been an 8.5 year cooling trend was not an 8.5 year warming trend
I emailed NOAA to ask what had changed. They said that anomalies were recalculated based the new 30-year Normals. Previously they had used the 1981-2010 Normal, now they were using the 1991-2020 Normals. But changing the data from which the anomalies are calculated should not change the longterm trend in the data. I emailed NOAA again. They said they would look into it but it’s more than a week with no response.
I just went back to the NOAA site again and found the anomalies had changed again. They look correct. There is no change in the overall trend. So I guess they checked either before or after I emailed them and found a mistake.
I’ll have a look at what the 8.5 year trend is now.
In October of this year the USCRN showed an 8.5-year cooling trend of -0.48 °F per century.
When NOAA changed that data set it became an 8.5-year warming trend of 7.6 °F per century.
The most recent change results in an 8.3-year cooling trend of 1.3 °F per century.
My original post on this subject is here: https://wattsupwiththat.com/2022/11/06/open-thread-40/#comment-3634450.
The NCEI site is here:
https://www.ncei.noaa.gov/access/monitoring/national-temperature-index/.
Firs Rule of Goobermint Climate Science:
— Inconvenient temperature data must be revised
The 1940 to 1975 global cooling was almost “disappeared”.
There is absolutely no doubt that the Urban Heat Island (UHI) is a real thing, and most people are able to understand the concept and just accept it. Would be hard not to, as it is sort of a common sense thing. Weathermen on the nightly news have hammered this point home to casual viewers, about whether the temperature was recorded down town, or at the airport, as everyone knew 40 years ago it was always a few degrees warmer downtown.
Large cities, especially in the mid to tropical latitudes, have a very high UHI especially at night as it takes a long time (all night) for those higher temps to revert to the average mean for the geographic area. So it should be no surprise that people are feeling the ‘heating’ which they think is global, but is really local and due to a completely different effect. And most people live in a city, or highly developed suburban area,so actually experience higher temperatures.
This makes it easy for a lot of nefarious actors to state that this is ‘global heating’ when in reality it is local. And has totally affected the measuring of the historical temperature record. This has to be one of the most significant issues out there that just seems to fly under the radar. And trying to adjust for that is highly variable.
Having lived in both Calgary and Edmonton, can attest to this first hand. Calgary is one of the largest geographic cites per capiia in the world. And has a lot of asphalt and concrete. And is very sunny usually, so does absorb a lot of solar insolation all day. And it isn’t just incoming solar radiation, but thermal heating in winter of all the real estate that introduces water vapor and thermal heat that must also dissipate. Or A/C heat exhaust in many cities in the summer.
The only personal observation I will make is that on a totally crystal clear night, espeally with a wind or a breeze, you can just feel the heat leaving your body (and the city) and trying to heat up the entire universe, so there is some differentials that make adjusting for that very difficult. If it were a cloudy no wind night, the city might stay a lot warmer all night than the surrounding countryside. But when the skies are clear, or a blizzard, things revert to the mean fairly quickly. So this makes things even more complicated to hindcast.
Nice post Earthling2. Spurious warming due to local landscape changes and waste heat from human activity, is not only relegated to urban areas. Anthony’s Surface Station project shows lots of urban sites with weather stations located next to parking lots, AC heat exhausts, heated buildings, trash burn pits, etc. Many of those sources of heat were not there fifty years ago.
Indeed, lots of additional bias, such as 5x-10x more jet traffic at the airport than 30-40 years ago creating a bubble of very local warming with more runways and more thermal heat hanging around. This whole issue really is one the big elephants in the room, regarding the whole temperature record which is really the only scorecard that anyone could use to prove anything. And then the adjustments.
These points do need to get hammered home, as this is what normal folk can understand, and is something a lot of lay folk already instinctively know. These are the people we need to reach to bring some sanity to the whole climate debate.
The oceans are the best long-term temperature record we have. They expand when they warm, and more melt water makes them rise. They show steady and gradual warming, which is mostly beneficial to the biosphere to which we are inextricably linked.
UHI does not cause global warming
A CHANGE in UHI can cause global warming
Of course UHI doesn’t cause global warming, except in the tempature record that uses weather stations placed in the cites, and then corrupted station siting and nfarious forms of external heating, with someone aiming an A/C exhast at the weather station. We have all seen the many pictures. And then the station record which represents the wider geographic area records a higher temapature basised upon the corrupted recording.
It doesn’t even cause real regional warming, but it does cause city warming, and this is now where the majority of many people live. The UHI is something tangible for billions of people living in some major metropolis, and for them it is warmer when Delhi, Tokyo or LA is 4-5 degree C warmer than the majority countryside all around it. Much warmer, but that is only a fraction of a fraction of just the land surface on the good Earth. And then the charlatans come in and say, see, it is much warmer, can’t you feel it? This is straight up a swindle and how to lie with statistics and numbers. Or just outright knowingly lie because it is the result someone wants. Maybe some of it was inocent in the early days but has been known now for some time now.
I still recall the day I got my first x386 computer in the early 1990’s and the first science article I was able to download before even the WEB was a thing, some obscure meteorologist was talking about the difference (latex or oil) in the paint on the white weather station even making a slight difference in the temperature readings. That was a light bulb moment for me and got me to questioning everything.
You also see it in the fall when we can have frost warnings all around calgary but not in the city itself.
All UHI
What a great Reality Check by Dr. Roy. The CAGW Loonies are being pushed, by right in front of them, Reality Checks, and have therefore abandoned Global Warming for Climate Change, and even Climate Weirding. So, the currently record snowfall underway in Buffalo, New York, is just another example of Climate Weirding. So, I will change my depiction of CAGW Loonies to Climate Weirdos. Press On!
I find it amazing how many different temperature readings one can get from a relatively small area. I live about 3 miles outside of a small town in central Maryland and in both summer and winter it is always at least 3 degrees F (if not more, up to 8 degrees in summer at night) warmer in town than where I live (which is mostly rural, with scattered homes, lots of farms and a few small housing developments here and there). And when I go to visit my mom (12 miles to the south, where there is more development and also the elevation is lower) it is often 3-4 degrees warmer.
You are talking an area of less than 25 square miles and temperature variations of several degrees! I have a small weather station, and if my mom had one (she just has an outdoor thermometer), it would report different temps – all just 12 miles apart. The ones in town also report higher temps than mine does. Partly because the one that is used for local news reports surely must be badly sited…. it always reports summer daytime temps nearly as hot as in downtown Baltimore! Especially since it says it’s 97 degrees in town and my weather station is saying it’s 92 degrees. The difference isn’t so pronounced in winter, but it is still higher.
Anyone who has a temp readout in their car can see this sort of variance just by driving around a bit, going from developed areas to less developed ones. And they expect us to believe that there is extreme climate change?!?!
IMO only temp readings in natural areas (i.e. non-developed) should be considered when trying to determine and average out global temperature changes. Not saying there shouldn’t be weather stations in cities and at airports, but simply that their data should not be used for that purpose.
Rational energy policy left the building decades ago and it can’t come back with any new evidence because the political books are closed.
I am starting to run out of my supply of 100 watt incandescent light bulbs. It’s not the light I’m going to miss as LED bulbs are now comparable, but the heat needed for my antique chicken brooder and Kenner 1963 Easy Bake oven.
The fact of the matter is that Urban Heat Islands are proven to exist and therefore are contributing to global warming statistical data, as such data is gathered by thermometers in those areas. This is indeed human caused warming, but cannot be attributed to CO2 back radiation.
Therefore, any claim that such temperature data taken in urban areas is suited for the purpose of determining CO2 driven warming is bogus. It should be discarded as such.
Weather stations are properly sited if the UHI does not increase or decline
That won’t affect the oceans — 70% of the planet.
A rural weather station could have warming from a village growing in the vicinity. Economic growth can affect any land weather station.
Should not be news to anyone:
Measured at 4 °C in Singapore in a 2008 publication. And this is research by the National University of Singapore (NUS) and Building and Construction Authority (BCA) of Singapore.
Thanks for this Dr Spencer
A couple winters ago i was driving in from Canmore in the Rockies one evening, it was very cold, -37C west of calgary according to my car.
Passing through calgary it said -33, but shortly after leaving the city heading east past Strathmore it was -38.
Huge variation all UHI.
Currently I am working on the global paper often quoted by activists that starts its Abstract with the claim that heatwaves are getting longer, hotter and more frequent. Lewis and Perkins-Kirkpatrick 2020. These are two girls from Uni of New South Wales who have made careers from such a claim, which is especially unsafe when projected into the future.
Has any reader here done a critique, or knows of one?
It is a problem similar to the Dr Spencer one above, with the main difference that he uses maximum temperatures while these two girls use a home-made definition of heatwave, a selection of the hottest days of maximum temperatures. UHI is just as significant a consideration.
Progress to date has found several concerns with L&K-P which I hope to correct soon.
Geoff S
Don’t assume the people who are controlling the CAGW push don’t understand the role of UHI. They mostly ignore it, for now, because they are not ready to introduce it yet. CO2? Your ICE engine. C4? Your T-bone. NO2? the rest of your food supply. UHI? Your house and backyard. Everything in its time.
Would like to see a collaborated study using the Anthony Watts station assessment and this analysis method. Perhaps selecting 3 or 4 US areas.
I live in Bellingham WA and our areas Climate Action Plan warns of above normal heating in our area, based on records from a weather station immediately adjacent to, and downwind of, a Waste Water plant with digestor ponds and 2 furnaces. In addition, there is a steep hill downwind of the weather station creating a nice little pocket to trap heat.
There is a steep change in the cities warming rate immediately afte the plant was placed in service.
We need to challenge NOAA/NASA for such poor temperature records management which uses data from such stations.
Here in Victoria BC, Canada we have a fairly long record (at least for N.America) of temperature and sea level information. I’m not stressed at all looking at history, reality, and rate of change of our climate data. Nothing to see here, carry on, business as usual. I’m not sure what dementia has gripped our nation, we used to think a record hot day was wonderful as kids, yet we still all flock south to seek sun and heat. Warm is good!
Temp data goes all the way back to 1914! (click on the 10X-most button to show chart back to 1914) https://victoria.weatherstats.ca/charts/temperature-yearly.html
Sea level data back to 1910! https://sealevel.info/MSL_graph.php?id=822-101