John A. Parmentola
The RAND Corporation
I have been working on Milankovitch Theory for about three years, trying to understand it. In doing so, I have gained some new insights into this theory. I have also discovered that there are some misconceptions about what it is. This brief note summarizes my work while clarifying several aspects of the theory.
Milankovitch Theory is not a complete theory. It’s more of a hypothesis concerning insolation changes over time and the associated recurrence of ice ages. It is also not a climate model, as some assume. The Milankovitch hypothesis represents a set of insolation conditions on the earth’s climate system; however, the earth’s specific climate response to these conditions is not understood. That is a critical unknown factor relevant to predicting the future state of the earth’s climate.
In his original papers [1], Milutin Milankovitch proposed that the obliquity was a dominant factor in ice age occurrences because it affects the insolation at northern latitudes where ice and snow can accumulate on the earth’s comparatively large landmass of the northern hemisphere. Snow and ice accumulation can affect the earth’s albedo and hence its heat engine. It is likely that the earth’s climate response to changes in insolation at northern latitudes involves the extreme cyclonic weather at the poles primarily caused by the Coriolis Force and the dynamic change in the insolation over periods of roughly 10,000 years. These polar regions are each the size of Asia, containing enormous amounts of cold, dense air that is held in check by the jet stream. However, the specific physical mechanism within these regions that responds to insolation changes over extended periods to cause ice ages remains a mystery.
There are three celestial parameters involved in the earth’s motion, namely, the precession, obliquity, and eccentricity. None of these is periodic, as indicated by the following graphs of the eccentricity, precession, and obliquity half-cycles,

While they are cyclical, each of them has no fixed period. Instead, there are cyclical ranges. They are all quasiperiodic functions of time due to effects from other planets and the sun on the earth’s motion. Therefore, there are no fixed frequencies; however, power spectral density analyses of the paleoclimate data reveal certain characteristic frequencies. These are associated with the three celestial parameters and are used to explain certain recurring features in the paleoclimate data, as indicated by the following graphs associated with Vostok ice core data [2],

The shortest cycle of the three celestial parameters is that of the precession, which, over the last 800,000 years, on average, has been about 21,000 years. That of the obliquity has been about 41,000 years and the eccentricity about 94,000 years. However, the variation in these cycles and their half-cycles is quite large. For example, the half-cycles vary for the precession from 7,000 to 15,000 years, the obliquity from 18,000 to 23,000 years, and the eccentricity from 30,000 to 70,000 years. In terms of timescales, the precession sets the scale for the time-dependent behavior of the insolation. The significant quantity is the precession half-cycle, which is about 11,000 years on average.
The insolation is inherently a wave phenomenon; however, this characterization is not acknowledged in the literature. Think of it as analogous to an AM radio wave. Its wave-like nature occurs from the “beating” of the earth’s celestial motions on the solar irradiance (about 1,368 Watts/m2), which results in its complex time-dependent distribution over the earth’s surface, i.e., the insolation. Each of the three celestial motions contributes a wave component to the insolation. Like ordinary waves, they can constructively and destructively interfere. This description begs several questions. How large in magnitude is each of these wave components, and how do they interfere? Does the interference manifest itself in the paleoclimate data, and how? Does the description of the insolation as a wave and its components have any predictive power? My work sheds some light on these questions.
In terms of physical effects, the obliquity primarily affects the insolation distribution over the earth. Its oscillatory behavior shifts the sun’s rays north and south by about 2.4 degrees in latitude or roughly 140 miles. This shift changes the angle the sun’s rays make with the vertical at each illuminated point on the earth resulting in a comparatively small overall effect on the insolation amplitude.
The most significant effect on the insolation amplitude comes from the combination of the precession and eccentricity, the precession index. It’s defined as the precession modulated by the eccentricity. It accounts for insolation minima and maxima. For example, when the earth is at perihelion, the closest distance to the sun, and the earth’s axis points toward the sun, the insolation approaches a maximum for the northern hemisphere. Fast forward about 11,000 years, an average precession half-cycle, the earth’s axis points toward the sun at aphelion, the farthest distance from the sun, and the insolation approaches a minimum for the northern hemisphere. The change from maximum to minimum and vice versa can be quite significant (more than 100 Watts/m2) at northern latitudes during the summer solstice and is driven by changes in the eccentricity over a precession half-cycle.
Over the last 800,000 years, the insolation has transitioned from maxima to minima and vice versa a total of 74 times; however, the number of prominent interglacial periods indicated in paleoclimate data is at best 13. These features are represented by the following graphs of insolation predictions at 65 degrees north latitude during June [3] and EPICA Dome C ice core data from Antarctica rendered through a temperature model over the last 800,000 years [4].

Steep rises and subsequent major temperature declines are comparatively infrequent; however, the timescale of these changes is about 10,000 years, which approximately coincides with the precession half-cycle. What, if any, relationship is there between insolation changes and prominent features in the paleoclimate data? Are there specific insolation changes that are special, or are there trends in the insolation over time that correlate with significant changes in the paleoclimate data? To gain some insight into correlations, one might consider the largest changes in insolation from minimum to maximum and maximum to minimum to see if these influenced the paleoclimate data more than other insolation changes.
Since the obliquity affects the distribution of the solar irradiance over the earth with a comparatively small effect on its amplitude over long periods and the precession index is the primary driver of amplitude variations over shorter periods, the product of the two contributions should well approximate the insolation. This approximation has the added benefit of enabling the partitioning or deconvolution of these two effects in time and allows a time series comparison of the model predictions and the paleoclimate data. In this way, the quasiperiodic nature of the celestial parameters is accounted for explicitly.
Suppose one now calculates the percentage change between maxima and minima and vice versa using this model and interpolates between these extrema. In that case, the result is a complex wave having a beat structure describing the changing trends in the insolation. From the deconvolution model, the obliquity-wave (O-Wave) contribution to the percentage change oscillates quasi-periodically over 800,000 years with a comparatively small amplitude. Over the same period, the precession index contribution to the percentage change takes the form of recurring wave packets (PI-Wave) composed of a precession carrier wave modulated by an eccentricity envelope. The PI wave packet amplitudes, on average, exceed those of the O-Wave by a factor of four, as can be seen by the following graph,

Where the blue curve corresponds to the PI-Wave, the red curve the O-Wave, and the grey curve their total. Therefore, the PI-Wave drives the behavior of the insolation while the O-Wave tends to enhance it through constructive and destructive interference over much longer times scales that are roughly a factor of two greater on average. The sum of the O-Wave and PI-Wave at the extrema points can be shown to have about 1% accuracy based on a comparison with the high-precision insolation computations of Laskar et al. All numerical calculations make use of data generated from this computational tool [2]. The interpolation accuracy between the sparse set of extrema points is unknown.
Because the O-Wave and PI-Wave are time series model predictions, they can be directly compared with paleoclimate time series data. For example, the PI wave packets approximately correlate with the occurrence of interglacial periods, and the temperature trends correlate with the increasing and decreasing PI-Wave amplitudes as indicated by the following graphs,

Note the similarity between the wave packet structure indicated by the vertical lines at the far left and the packet to the far right associated with the Holocene. This similarity enables an estimate of the termination of the current warm period (see below).
From this novel wave description of the insolation, the deconvolution model can account for the following prominent features in the paleoclimate data:
1) The aperiodic recurrence of interglacial-glacial periods over the last 800,000 years approximately coincides with the quasiperiodic PI-Wave;
2) The paleoclimate temperature trends, such as those in the EPICA Dome C data, closely follow rising and declining trends in the PI-Wave contribution to the insolation;
3) All interglacial terminations over the last 800,000 years occur in the same manner through steep declines in the PI-Wave contribution to the insolation enhanced by the O-Wave contribution;
4) The temporal extent of interglacial periods is of two types that are accounted for by the constructive and destructive interference of the O-Wave and PI-Wave contributions to the insolation;
5) and all interglacial inceptions over the last 800,000 years coincide with synchronized constructive interference between the PI-Wave and O-wave contributions to the insolation, except for the timing of two inceptions.
The two inceptions that fail are deep ice cores. However, a detailed temporal comparison of the benthic LR04 data [4] and EPICA Dome C ice core data [3] demonstrate that the most significant timing differences between these data sets coincide with the inception timing disparities from the deconvolution model predictions [6]. This discrepancy suggests that there may be something wrong with the EPICA Dome C ice core data, which is not surprising given its model dependence and the depth of the ice cores.
Finally, through the deconvolution model, interglacial termination periods can be estimated, which all appear to be in the same ballpark in terms of duration. They are all about 11,000 years except for one, Marine Isotope Stage 13c, which is about 15,000 years; however, its greater duration can be understood in terms of the quantitative and qualitative behaviors of the O-Wave and PI-Wave contributions to the insolation.
From the model, the Holocene interglacial will likely terminate within the next 500 years. It’s a low-resolution estimate because the insolation minimum the earth is currently in is very shallow. A very similar interglacial occurred about 787,000 years ago, which terminated in a similar way. The following graphs indicate the shallowness of the Holocene, Marine Isotope Stage 1, and Marine Isotope Stage 19c insolation minima,

The consistency of the deconvolution model with the prominent features of the paleoclimate data suggests a physical description reminiscent of a resonance system; however, proving this is a whole other matter. The following description should be considered speculation or, at best, a hypothesis.
We know from a harmonic oscillator that it is the nature of a resonant system to respond strongly to influences that have frequencies close to its resonant frequency. If a complex, exciting force is applied, such as one having many frequencies, then the system will pick out the components close to its resonant frequency.
For the sun-earth system, the solar irradiance undergoes small percentage changes over time and is evenly distributed along a plane perpendicular to the sun’s rays. The earth’s shape and celestial mechanical motions beat on the solar irradiance with multiple frequencies in a quasiperiodic manner to transform it into the insolation over the earth’s surface. The beating effect is a consequence of gravitational forces on the earth that deviate from a 1/R2 central force law due to the sun, other planets, and its unsymmetrical mass distribution.
This “beating” causes quasiperiodic trends in the insolation primarily due to the precession index (the precession modulated by the eccentricity). The eccentricity through the precession index has amplified and reduced the insolation in a quasiperiodic manner over the last 800,000 years. The climate system’s response to this aperiodic “beating” is quasiperiodic interglacial periods, a resonance response. Simply put, the earth is a sensor that detects and responds to the fundamental rhythms of the solar system.
The interglacial periods are initiated by amplification and terminated by reduction of the insolation due to the eccentricity through the precession index. This effect takes the form of quasiperiodic wave packets with a precession carrier wave modulated by the eccentricity, which accounts for the quasiperiodic recurrence of interglacial-glacial periods. The role of the quasiperiodic obliquity contribution to the insolation is to enhance and diminish the dominant effect of precession index wave packets in initiating and terminating interglacial periods.
That’s it in a nutshell.
About the author
John Parmentola has a Ph.D. in theoretical physics from the Massachusetts Institute of Technology. He has built a highly distinguished career over four decades as an entrepreneur, inventor, innovator, a pioneer in the founding of new fields of research, and leader of complex research and development organizations with broad experience in the private sector, academia, and high-level positions within the federal government and defense community.
Currently, he is a consultant to one of the world’s leading think tanks, The RAND Corporation, where he works on defense, energy, and science and technology assessment, strategy, and planning issues for domestic and foreign government agencies. He also does volunteer work for the National Academy of Sciences.
References
[1] Milankovitch, M.M., 1941. Kanon der Erdbestrahlung und seine Anwendung auf das Eiszeitenproblem. Royal Serbian Sciences, Spec. pub. 132, Section of Mathematical and Natural Sciences, 33, Belgrade, 633 pp., also available in English at https://www.amazon.com/Insolation-Ice-Age-Problem-Milankovic-Milankovitch/dp/8617066199, 1998.
[2] (Petit, J., Jouzel, J., Raynaud, D. et al. Climate and atmospheric history of the past 420,000 years from the Vostok ice core, Antarctica. Nature 399, pp. 429–436, https://doi.org/10.1038/20859, 1999.
[3] J. Laskar et al., IMCCE, Virtual Observatory Solar System Portal, CNRS Observatory, Paris, http://vo.imcce.fr/insola/earth/online/earth/online/index.php, 2018.
[4] NCEI, EPICA Dome C – 800KYr Deuterium Data and Temperature Estimates, https://www.ncei.noaa.gov/access/paleo-search/study/6080, 2007.
[5] Lisiecki, LE. and Raymo, M.E., A Pliocene-Pleistocene Stack of 57 Distributed Benthic d18O Records, AGU Paleoceanography and Paleoclimatology, Vol. 20 (PA1003), pp.1-17, https://agupubs.onlinelibrary.wiley.com/doi/epdf/10.1029/2004PA001071, 2005.
[6] See figure 3, Parrenin, F. et al., The EDC3 Chronology for the EPICA Dome C Ice Core, Clim. Past., Vol. 3, pp. 485-497, Figure 3, pp. 491, https://cp.copernicus.org/articles/3/485/2007/, 2007.
Seems like the interglacial ending will be trouble.
You think?
Shouod I have said that is NCIS sarcasm?
How do you SAY it in writing with the Gibbs stare?
And is would be “Ya think?”
No idea despite fact that as a young undergraduate I spent many hours in the same university ‘amphitheatre’ where professor Milutin Milankovic (Милутин Миланковић) held his mathematics lectures few decades earlier.
HOW ABOUT EXTENDING THE INTERGLACIAL PERIOD BY ADDING A LOT MORE CO2 to the troposphere?
AND building a line of nuclear reactors across central Canada to heat the snow buildup to stop the glaciation.
The Eemian ended while CO2 remained elevated. CO2 will not stop temperatures from falling.
or,
Milankovitch was and still is right.
Chapter 2 deals with this question and the evidence is clearly displayed.
Climate of the Past, Present and Future. A scientific debate, 2nd ed.
My work demonstrates through physical science and mathematics that the precession index significantly influences the earth’s climate. You can see it in the data. Interglacial periods form from steep rises of 10,000-year durations, and the steep terminations are all about 10,000 years, roughly the precession half cycle.
I show computationally that the obliquity enhances and diminishes the effect of the precession index.
With all due respect, your book does not have one equation. Without mathematics incorporating physics, you have no predictive power or a testable theory.
I have not researched the physics of Milankovitch theory, so there is no need for me to come up with new equations. I follow the results from Peter Huybers and Milankovitch himself, that have defined respectively summer energy and caloric half-year insolation with all the required formulas. Thinking that precession controls the glacial cycle is a common mistake.
Huybers, P., 2006. Early Pleistocene glacial cycles and the integrated summer insolation forcing. Science, 313(5786), pp.508-511.
Huybers, P., 2007. Glacial variability over the last two million years: an extended depth-derived agemodel, continuous obliquity pacing, and the Pleistocene progression. Quaternary Science Reviews, 26(1-2), pp.37-55.
Peter Huybers is a genius. I am standing on the shoulders of giants.
They are incorrect, as my calculations demonstrate. No one has deconvoluted the effects of the precession index and obliquity. Until you do this, you have no predictive power.
The eccentricity varies by a factor of 5 over the last 800,000 years. What matters is how much it varies over a precession half-cycle (about 11,000 years on average). It can be shown that in going from insolation minima to maximum the percentage change in insolation it two times the sum of eccentricities for the two orbits. That is a huge effect.
You comment about Huybers being a genius is irrelevant to the validity of his conclusions. Einstein made mistakes as other people have. In science nature deecides,.
In my opinion, you are the one being incorrect. As figure 2.4 in my book shows, the effect of precession on climate is very small despite its large effect on 21st June 65ºN insolation. The Achilles’ heel of precession is Kepler’s 2nd law. The closer the Earth to the Sun on the 21st of June, the faster it moves and the shorter the summer. That’s why Milankovitch’s caloric half-year is a lot superior to your deconvolutions.
Eccentricity has an important effect on climate, but any serious analysis shows that interglacials are always associated with an obliquity oscillation, and as soon as obliquity goes below 23º the interglacial is doomed.
Not much room for precession in there, I’m afraid.
The chart shows precisely the opposite of what you are claiming. There are times when there is no response. There are times when the rise and fall are out of sync.
Do the frequency analysis on the actual data and see how well it bears out your opinion.
The chart shows every interglacial within the envelope of an obliquity oscillation.
That is a much more acute problem for precession, which has an oscillation every 23 kyr on average. And we know the glacial cycle was associated with obliquity before the Mid-Pleistocene Transition.
The causality problem is defined over precession, not obliquity. For MIS 5 and MIS 15c. For MIS 7c the rise in precession takes place so far ahead of the termination that it shows zero effect on climate during the entire rising phase of precession.
For all those problems that you mention, it is much worse for precession.
Precession needs “ad hoc” explanations, like John’s wave packets to explain why the climate almost never responds to a precession oscillation. Obliquity needs some explanation only after the Mid-Pleistocene Transition, as before every interglacial was caused by obliquity regardless of precession or eccentricity. The explanation for obliquity is that the planet got so cold that at some oscillations it fails to produce an interglacial.
You are seeing things in the chart that simply do not exist. Show me the frequency analysis that confirms the 41kyr obliquity cycle.
You need to prove what you are seeing that no one else can see.
Good points! My paper contradicts many papers that claim obliquity dominance. They are focused on the wrong physics. They confuse the precession with the precession index, which is physically much more important. No one has ever deconvoluted the obliquity and precession index contributions to the insolation until my paper. The results are explicit and provide a comparison.
You do not seem to understand physics. It’s not the precession that matters. It’s the precession index, which is a different physical quantity. It’s sometimes referred to as the climate precession. By definition it’s the precession modulated by the eccentricity. It’s responsible for the maxima and minima in the insolation. It’s a huge effect!
I show this in my paper, but the timing is not correct. The timing is fixed when the precession index effects are taken into account. The obliquity needs to be shifted in time. My paper shows that the precession index contribution to the insolation is a factor of four larger in amplitude than the obliquity contribution.
I can show that to a good approximation, the percentage change in insolation from a minimum to a maximum is two times the sum of the eccentricities at the time of the minimum and maximum.
Wrong – I have and have had this same discussion with Javier, who is clueless on the topic.
Wrong about what? Talking about a frequency for any of the three celestial parameters is meaningless. They are quasiperiodic functions of time. That’s not speculation, it’s a fact. Their quasiperiodic nature is fundamental to comparing the obliquity and precession index contributions to the insolation with the paleoclimate data.
The only meaningful comparison is time series to time series. That is what I show in my paper.
It’s not the precession that matters; The precession index (precession modulated by the eccentricity) matters. Its behavior accounts for the insolation minima and maxima. The obliquity makes comparatively small changes to the insolation.
Following someone else’s formulas proves you can follow their formulas. The objective truth could be elsewhere.
Yes – precession dominates the interglacials. The recovery is more likely a multiple of precession cycles than eccentricity because recovery is always linked to rising summer intensity in the NH.
Attached is frequency analysis of the last four glacial episodes. Precession very distinctive. Obliquity not even in the frame.
Well Rick, kudos to you both!
Thank you – I believe I can claim priority and John’s work supports what I have been pointing out for a few years now.
I have been using the precession cycle to reliably forecast temperature trends outside the tropics for some time. I predicted the Southern Ocean cooling due to sunlight reducing before I actually found the supporting evidence in the measured record.
https://wattsupwiththat.com/2022/07/23/ocean-atmosphere-response-to-solar-emr-at-top-of-the-atmosphere/
What data source is being used for this frequency analysis?
Can you explain your frequency analysis in comparison with the one that comes from the Lisiecki and Raymo 2005 paper which shows a very prominent 41K year peak:
Thank you for this.
Eccentricity seems to be almost a non factor since there is so little variation even at its maximum extent. But the dismal state of instruction and base knowledge in natural science is so poor that many, apparently even some, if not many, of those graduating from what are considered the best schools, believe that eccentricity of the earths orbit is the reason for the seasons.
https://youtu.be/JXb7Oq13pjQ
One can hope that this has changed since that video was made but I seriously doubt it. And with such ignorance prevailing, is it any wonder that so many can be misled about “climate change” and convinced that the CO2 concentration in the atmosphere is the “control knob” of that climate.
My niece, who is about to get her Ph.d in some esoteric field in Geology and who does have a far better than average understanding of Natural History and Earth Sciences believes in the all powerful CO2.
Do not despair. Your niece has come from a more brain-washed secondary/tertiary education period than Adolf could ever have imagined.
She’ll come good, particularly as she progresses in geology.
Our education system is being destroyed. It’s traceable to the work of C.P. Snow on the two cultures. The humanities have been eroding the importance of knowledge of how the natural world works for more than a half-century.
The eccentricity varies significantly over the last 800,000 years by a factor of about 5. It’s how much it varies over about 10,000 years that matters. The precession half-cycle sets that timescale, but that half-cycle is not fixed. You can show that the percentage change in insolation between minima and maxima is approximately equal to two times the sum of the eccentricities associated with the orbits at the insolation minimum and maximum. That turns out to be a significant effect.
Discounting eccentricity is a colossal mistake!
Send your niece the link to Propagation of Error and the Reliability of Global Air Temperature Projections, rah.
The analysis hasn’t been falsified. Or even competently challenged. Tell her that if she can’t refute it, then she’ll have to agree that climate models have no predictive value.
No climate models bugling alarm, no evidence that CO₂ is doing anything.
Then she’ll come to understand that the IPCC is run by incompetents and ideologues.
Re. CO2, perhaps your niece is an impoverished student and simply needs the money. That’s how it’s done these days.
She owns a house and has two others students as boarders to help pay the mortgage.
Send her the attached table and ask why there is only one value for energy input for dry air at various temperatures. According to the climate guys and mention here on this site that the CO2 Infrared combination account for maybe 4 C of the GHE. If that were true there would need to be two columns in the tables for dry air and CO2. One column when IR present and one when no IR.
Forgot the table.
“…even at its maximum extent. But the dismal state of instruction and base knowledge in natural science is so poor that many, apparently even some, if not many, of those graduating from what are considered the best schools, believe that eccentricity of the earths orbit is the reason for the seasons.”
Yes, I’m convinced we have to abandon even what were once great schools and simply create new ones with very high entry standards and quality professors that the fallen greats will have to compete with for good students. The lefty damage done can’t be fixed by direct means.
The Poison Ivy League, and Collapsed Oxbridge types would have to cut Wifty-Poofty information-free faculties and clean out the incompetents in the faculties they keep. Science asterisked PhDs would have to requalify (take in depth scientific method studies, code of ethics,… to certify as BScs and go into real further study if they can.) Maybe hire Japanese PhDs as a bridging strategy.
John P,
Thank you for that precise – most appreciated.
I just marvel at the brilliance of the man in an era before ultra-accuracy of measurements and super computers for the grunt work.
Thank you, John Parmentola – how absolutely fascinating.
(I could not help noticing, though, you never mentioned CO2 as a factor!)
LoL and he didn’t mention CH4 either!! 🙂
Not to mention N2O
The global warming Potential Numbers for farts and laughing gas is one giant work of art when it comes to misdirection by abusing arithmetic.
John’s paper has been rejected at least once for the sin of not mentioning CO₂ in an analysis that has no relation to CO₂. So goes modern climatology.
Two different journals rejected it because of no mention of CO2. Milankovitch Theory is not a climate model. Also, we do not understand the specific response (a physical mechanism) the earth’s climate has to insolation changes. Climate models cannot model unknown responses!
John, I think it would be fair to say Climate Models can’t model a chaotic system either. Particularly, when the interconnected features of the chaos are not known and at least one major known component is not even modelled, i.e. clouds.
Good point!
Weather is chaotic. Climate is predictable.
Open ocean surface cannot sustain more than 30C. Ocean water can never be cooler than -1.8C. Very powerful feedback mechanisms control this.
Sunlight and surface temperature are highly correlated outside the tropics. Even where sea ice forms, there is still good correlation. Southern ocean has a correlation coefficient of 93% allowing for the thermal lag of approximately 2 months.
Not surprising at all. Tony Heller was permanently banned from Twitter for posting Pfizer’s own Table 1 of their “Cumulative Analysis of Post-authorization Adverse Event Reports”. for their COVID “vaccine”.
Of course Twitter does not profess to be a “Scientific Journal” but that action is just one of the uncountable examples across the whole spectrum of media suppressing hard factual information that does not support the “scientific consensus” and/or the preferred political opinion.
Thanks for advancing our understanding of orbital effects on climate. If it’s any consolation, your publication here will likely be more widely read than in those journals and receive more intelligent comment. Also, you have reminded the journal editors that they are sell-outs.
I have read about Milankovitch cycles many times, but have not deeply studied them.
The fact that the three controlling parameters ARE NOT periodic is certainly a revelation to me. I always assumed that they looked somewhat like a sine wave and the interference between the three waves was complicated enough to yield the observed variance.
It now makes much more sense (to me) why the glacials and interglacials literally DO NOT look like clockwork!
It makes sense that the periods are not the same since the orbits of the multiple planets that influence the earth could not be expected to be in synchronization.
This is a central point: “… the earth’s specific climate response to these conditions is not understood.” That is we cannot figure out how these incredibly slow changes can cause the fast onset and end of ice ages. Note too that these cycles always exist while periods of ice ages are geologically rare.
These two facts suggest the M-cycle hypothesis may well be false, a statistical coincidence.
It is not fast at all. A glacial termination takes 5,000 years and glacial inception takes 15,000 years. They are actually protracted processes that match very well Milankovitch changes.
And yet we cannot find the mechanism.
We know some things about the mechanism. The M-theory with some adjustments is capable of hindcast every interglacial.
If you are really interested in glacial cycles you can start by reading Peter Huybers’s thesis: Huybers, P., 2004. On the origins of the ice ages: insolation forcing, age models, and nonlinear climate change.
If you say that we cannot find the mechanism is because we don’t want to read the places where it is explained.
It is not explained there. Obliquity is hardly observable. The precession cycle dominates.
A glacial termination takes 5,000 years
So 140m rise in ocean surface over 5000 years:
140,000/5000 = 28mm per year
And here are the IPCC banging on about 1.7mm per year.
You would do yourself a favour and take some time to understand orbital mechanics. You clearly have no clue on the significance of these factors. I doubt you understand what precession means.
Explain why the Southern Ocean has been cooling throughout the satellite era?
Or stated in terms of precession cycle. A quarter cycle to recover from glaciation. Half a cycle interglacial and then a quarter cycle to begin the next cycle of glaciation.
Earth is already into the current cycle of glaciation. It began the last time perihelion occurred before the austral summer solstice; about 500 years ago.
This is really a misconception. The changes in precession cycle are not that slow. The timing of perihelion moves about half a month every thousand years and the variation in solar input, even when eccentricity is low, is significant on centennial scales.
This is the change is intensity at at 40N in April for last and next 500 years:
-0.500 375.423566
-0.400 375.813785
-0.300 376.204330
-0.200 376.594883
-0.100 376.985132
0.000 377.374769
0.100 377.765110
0.200 378.154160
0.300 378.541432
0.400 378.926421
0.500 379.308615
Think of what this is doing in deep oceans where time lags are thousands of years. The Mediterranean will see the impact of this increasing April insolation because it will experience increasing monsoon conditions in August. The insolation over the Southern Ocean has been falling for about 500 years. It shows a sustained cooling trend.
David, you may be right: might it also be possible that the M-cycle hypothesis is a part of the cause of ice ages, moderated by other factor(s)?
One that springs to mind is the configuration of the Planet’s land masses. Closing of the Panama Gap, about 3 million years ago, may be coincidence.
Another that may be involved is longterm (millions of years) variation in the Sun’s luminosity ( for whatever reason).
The science is settled, but we just don’t know the answers!!
Auto
Thank you for this study. I have learned something new having read your overview. I did not realise the extent of the variation in the three parameters that influence insolation was so great.
I am sure the climate models have full awareness of those fluctuating variables and have them modelled perfectly….:)
The central problem is we do not understand the earth’s climate response to these changes in insolation. They likely involve extreme weather at the poles, but we have minimal knowledge of the behavior of the most extreme weather on the planet.
We become aware of it when the polar vortex goes unstable—understanding that instability is an active area of research.
Based on what I have read it seems that there is a component of solar influence.
I wondered what members of the Church had to say on Milankovitch cycles – idle curiosity, I assure you – and I wasn’t disappointed.
From e3sm.org (Climate Model Projections From The Scenario Model Intercomparison Project CMIP6)
“Scientifically Verified Configurations”
https://e3sm.org/model/scientifically-validated-configurations/v1-configurations/
They seem to be translating that into ‘validated models’ as even the url indicates.
They do take a stab at a hydrological cycle…
The Rand corporation?
So this is impressive, to find time in between fulfilling your quota for starting wars worldwide to “extend” America’s racial enemies the Russians and Chinese – on the side to put together this nice analysis of Milankovitch cycles.
So I’m just wondering the Rand angle on ice ages. Will they restrict opportunities for starting proxy wars? I guess land surface covered in ice is harder to push into a war. Other than, I guess, seals against penguins. But how reliable would they be in payback of lend-lease?
Or maybe if an ice age is about to start then it’s OK to start a nuclear war – if the landmass in question is soon going to be iced over anyway? I guess that makes Milankovitch cycles very desirable and promising indeed. A glacial cycle would be about long enough for all those fallout isotopes to decay. Good times!
I led the definitive technical studies for President Clinton to convince the US Senate to sign the CTBT. Of course, he failed, but people who work for RAND are diverse in their work and opinions like anyone else.
And what about Reagan’s SDI proposal to make nuclear weapons obsolete, blocked by Andropov and Sir Henry Kissinger?
It went away as soon as the USSR went away. It would have never worked technically, as I pointed out here, https://www.amazon.com/Making-Space-Defense-Work-Superpowers/dp/0080359809.
In 2006, Gerard Roe wrote: “In defense of Malankovitch”
https://agupubs.onlinelibrary.wiley.com/doi/full/10.1029/2006GL027817
More recently Luboš Motl, on his blog called The Reference Frame (TRF), reviewed and discussed Roe’s paper.
Motl closed the blog in April 2022.
I found this sad because he had many good posts with interesting comments. {Not that I was capable of reading them all!}
Thanks John A. P. for your contribution.
A pedantic thing: The word “cycle” and its derivatives such as bicycle and cyclone, are overly used in weather and climate discussions. It won’t happen, but, using “episodic” would be a better choice.
Unfortunately, mathematics owns periodic, aperiodic, quasiperiodic,……..
“The consistency of the deconvolution model with the prominent features of the paleoclimate data suggests a physical description reminiscent of a resonance system; however, proving this is a whole other matter. The following description should be considered speculation or, at best, a hypothesis.”
Author’s hesitancy is justified :
No one has been able to demonstrate a meaningful relationship between glacial cycles and any of the Earth’s 3 orbital parameters obliquity, eccentricity and precession or combination thereof on a linear time scale. A physical causation requires a strong correlation between parameters in the time domain, not the frequency domain!
And they say the science is settled…
However, this short summary shows a correlation between Precession Index Wave packets with glacial cycles. The timing differences are corrected by including the obliquity wave through wave interference. Treating insolation as a wave has physical consequences that have been missed in the literature.
I followed this unbelievably exhaustive Milankovitch discussion with 384 comments back in Jan 2022 :
https://tallbloke.wordpress.com/2022/01/03/ned-nikolov-dispelling-the-milankovitch-myth/#comments
Masses of data and pro-and-con arguments turned up.
Beware – some here get very upset….
No one that you have read, obviously.
Huybers, P., 2004. On the origins of the ice ages: insolation forcing, age models, and nonlinear climate change.
The time domain is the frequency domain, transformed by e.g. Fourier transforms.
does this need explaining?
We are now in a multi-year period of unstable polar vortex in the northern hemisphere.
It would be much better if we understood it in a predictive way using physical science.
The stratospheric polar vortex is a large-scale cyclonic circulation that forms in a cold air mass in the polar region and extends from the middle troposphere to the stratosphere. The polar vortex is implicated in a variety of atmospheric processes, such as the formation of ozone holes, the North Atlantic and the Arctic Oscillations, variations in extratropical cyclone tracks, etc. The results presented in this work show that the vortex plays an important part in the mechanism of solar activity influence on lower atmosphere circulation, with variations in the vortex intensity being responsible for temporal variability in the correlation links observed between atmospheric characteristics and solar activity phenomena. In turn, the location of the vortex is favorable for the influence of ionization changes associated with charged particle fluxes (cosmic rays, auroral and radiation belt electrons) that affect the chemical composition and temperature regime of the polar atmosphere as well as its electric properties and cloudiness state. In this work, recent results concerning solar activity effects on the state of the stratospheric polar vortex as well as its role in solar–atmospheric links are discussed.
https://www.researchgate.net/figure/Left-Solar-activity-effects-on-troposphere-pressure-in-the-Polar-region-60-85-N-and_fig1_362101056
Svetlana Veretenenko has developed a very similar hypothesis to the Winter Gatekeeper on his own independently and published it nearly simultaneously with me.
It is further confirmation that the Winter Gatekeeper hypothesis of solar activity effect on climate is the right one.
“We both say it, so it must be true”?
Bandar-Logic.
Stratospheric Polar Vortex as an Important Link between the Lower Atmosphere Circulation and Solar Activity
Article
Full-text available
Jul 2022
Svetlana Veretenenko
A sharp weakening of the
vortex near 2000 seems to be a possible reason for the destruction of this correlation.
The obtained results show that the stratospheric polar vortex plays an important part
in the mechanism of solar–atmospheric links, which seems to be due to its capability
to affect troposphere–stratosphere interaction via planetary waves.
The state of the polar vortex may be affected by different solar activity phenomena
contributing to a roughly 60-year oscillation of its intensity. A high-latitudinal location
of the vortex is favorable for the effects of ionization increases associated with charged
particle fluxes (solar and galactic cosmic rays as well as auroral and radiation belt
electrons).
I am sure you noticed the similarity to my Winter Gatekeeper hypothesis, Ren.
In turn, changes in the circulation epochs seem to be related to the transitions be-tween the different states of the stratospheric polar vortex. As follows from theanalysis of the stratospheric data and sea level pressure/temperature oscillationsat polar latitudes, the intensity of the vortex undergoes oscillations with a periodclose to60 years. Under a strong vortex, increases in GCR fluxes contribute to theintensification of extratropical cyclones, whereas under a weak vortex, the effectschange the sign. The intensification of extratropical cyclogenesis associated withGCR increases under a strong vortex regime resulted in a high positive correlationbetween cloudiness and GCR intensity in ~1980–2000. A sharp weakening of thevortex near 2000 seems to be a possible reason for the destruction of this correlation.The obtained results show that the stratospheric polar vortex plays an important partin the mechanism of solar–atmospheric links, which seems to be due to its capabilityto affect troposphere–stratosphere interaction via planetary waves
She gets the polar vortex part of the mechanism correct, but she misses all the other parts of a more general process that involves from ENSO to stratospheric ozone, and the multidecadal oscillation into a single very complex meridional transport effect.
The current cycle of glaciation is 500 years in. We will not see serious ice accusation for hundreds of years but the sequence is in train.
The attached shows how solar EMR is progressing at 30N from the last 520 years and the next 80 years.
The NH is undergoing more extreme conditions; summers will get warmer because spring sunlight is increasing. More ocean will hit the 30C limit and that puts more water in the atmosphere ahead of the lower autumn sunlight that results in cooler winters.
The land temperature lags the sunlight by one month. The ocean lags the sunlight by 2 months. So the land will cool more rapidly than the ocean and the ocean atmosphere has more water. Conditions now favour increasing moist air divergence from oceans to land and more will fall as snow.
Glaciation is underway but the evidence will not materialise for hundreds of hears. It will be more than 500 but less than 1000.
Glaciation is energy intensive as it requires high evaporation. The place only cools down in summer once the ice mountains form. They ice is never warmer than 0C and fresh snow is reflective so does not take in much energy.
All sea level falls in recent glaciation cycles align with the present conditions. And the process is not that complex when you consider what is happening with sunlight and the thermal response of the different surfaces.
I live in central Indiana and have had to bring the potted plants in the last three nights running because of frost warnings. I think Big Joe Bastardi was a bit off this time because Weatherbell’s long range forecast called for warmer than average temps across the northern portion of the US lasting almost through October. They have however forecasted that we will be seeing a colder December than we have experienced in the last several years.
Based on my work, we need to see at least a consistent accumulation of snow and ice of about one foot per year for northern latitudes of 65 degrees or more.
Ice ages/glaciations do not come because of increased winter precipitation but instead progress due to lack of melt.
How do you explain 3 kilometers of ice over northern latitudes during an ice age?
The moisture in the air is removed as the temperature declines through a positive feedback loop driven by changes in the albedo.
Cold times are obviously dryer times. That is quite clear based on the evidence from the Pleistocene.
But the glaciers/ ice sheets would not have been there had there had the accumulation melted seasonally as we have been lucky enough to experience in our lifetimes in the temperate zones.
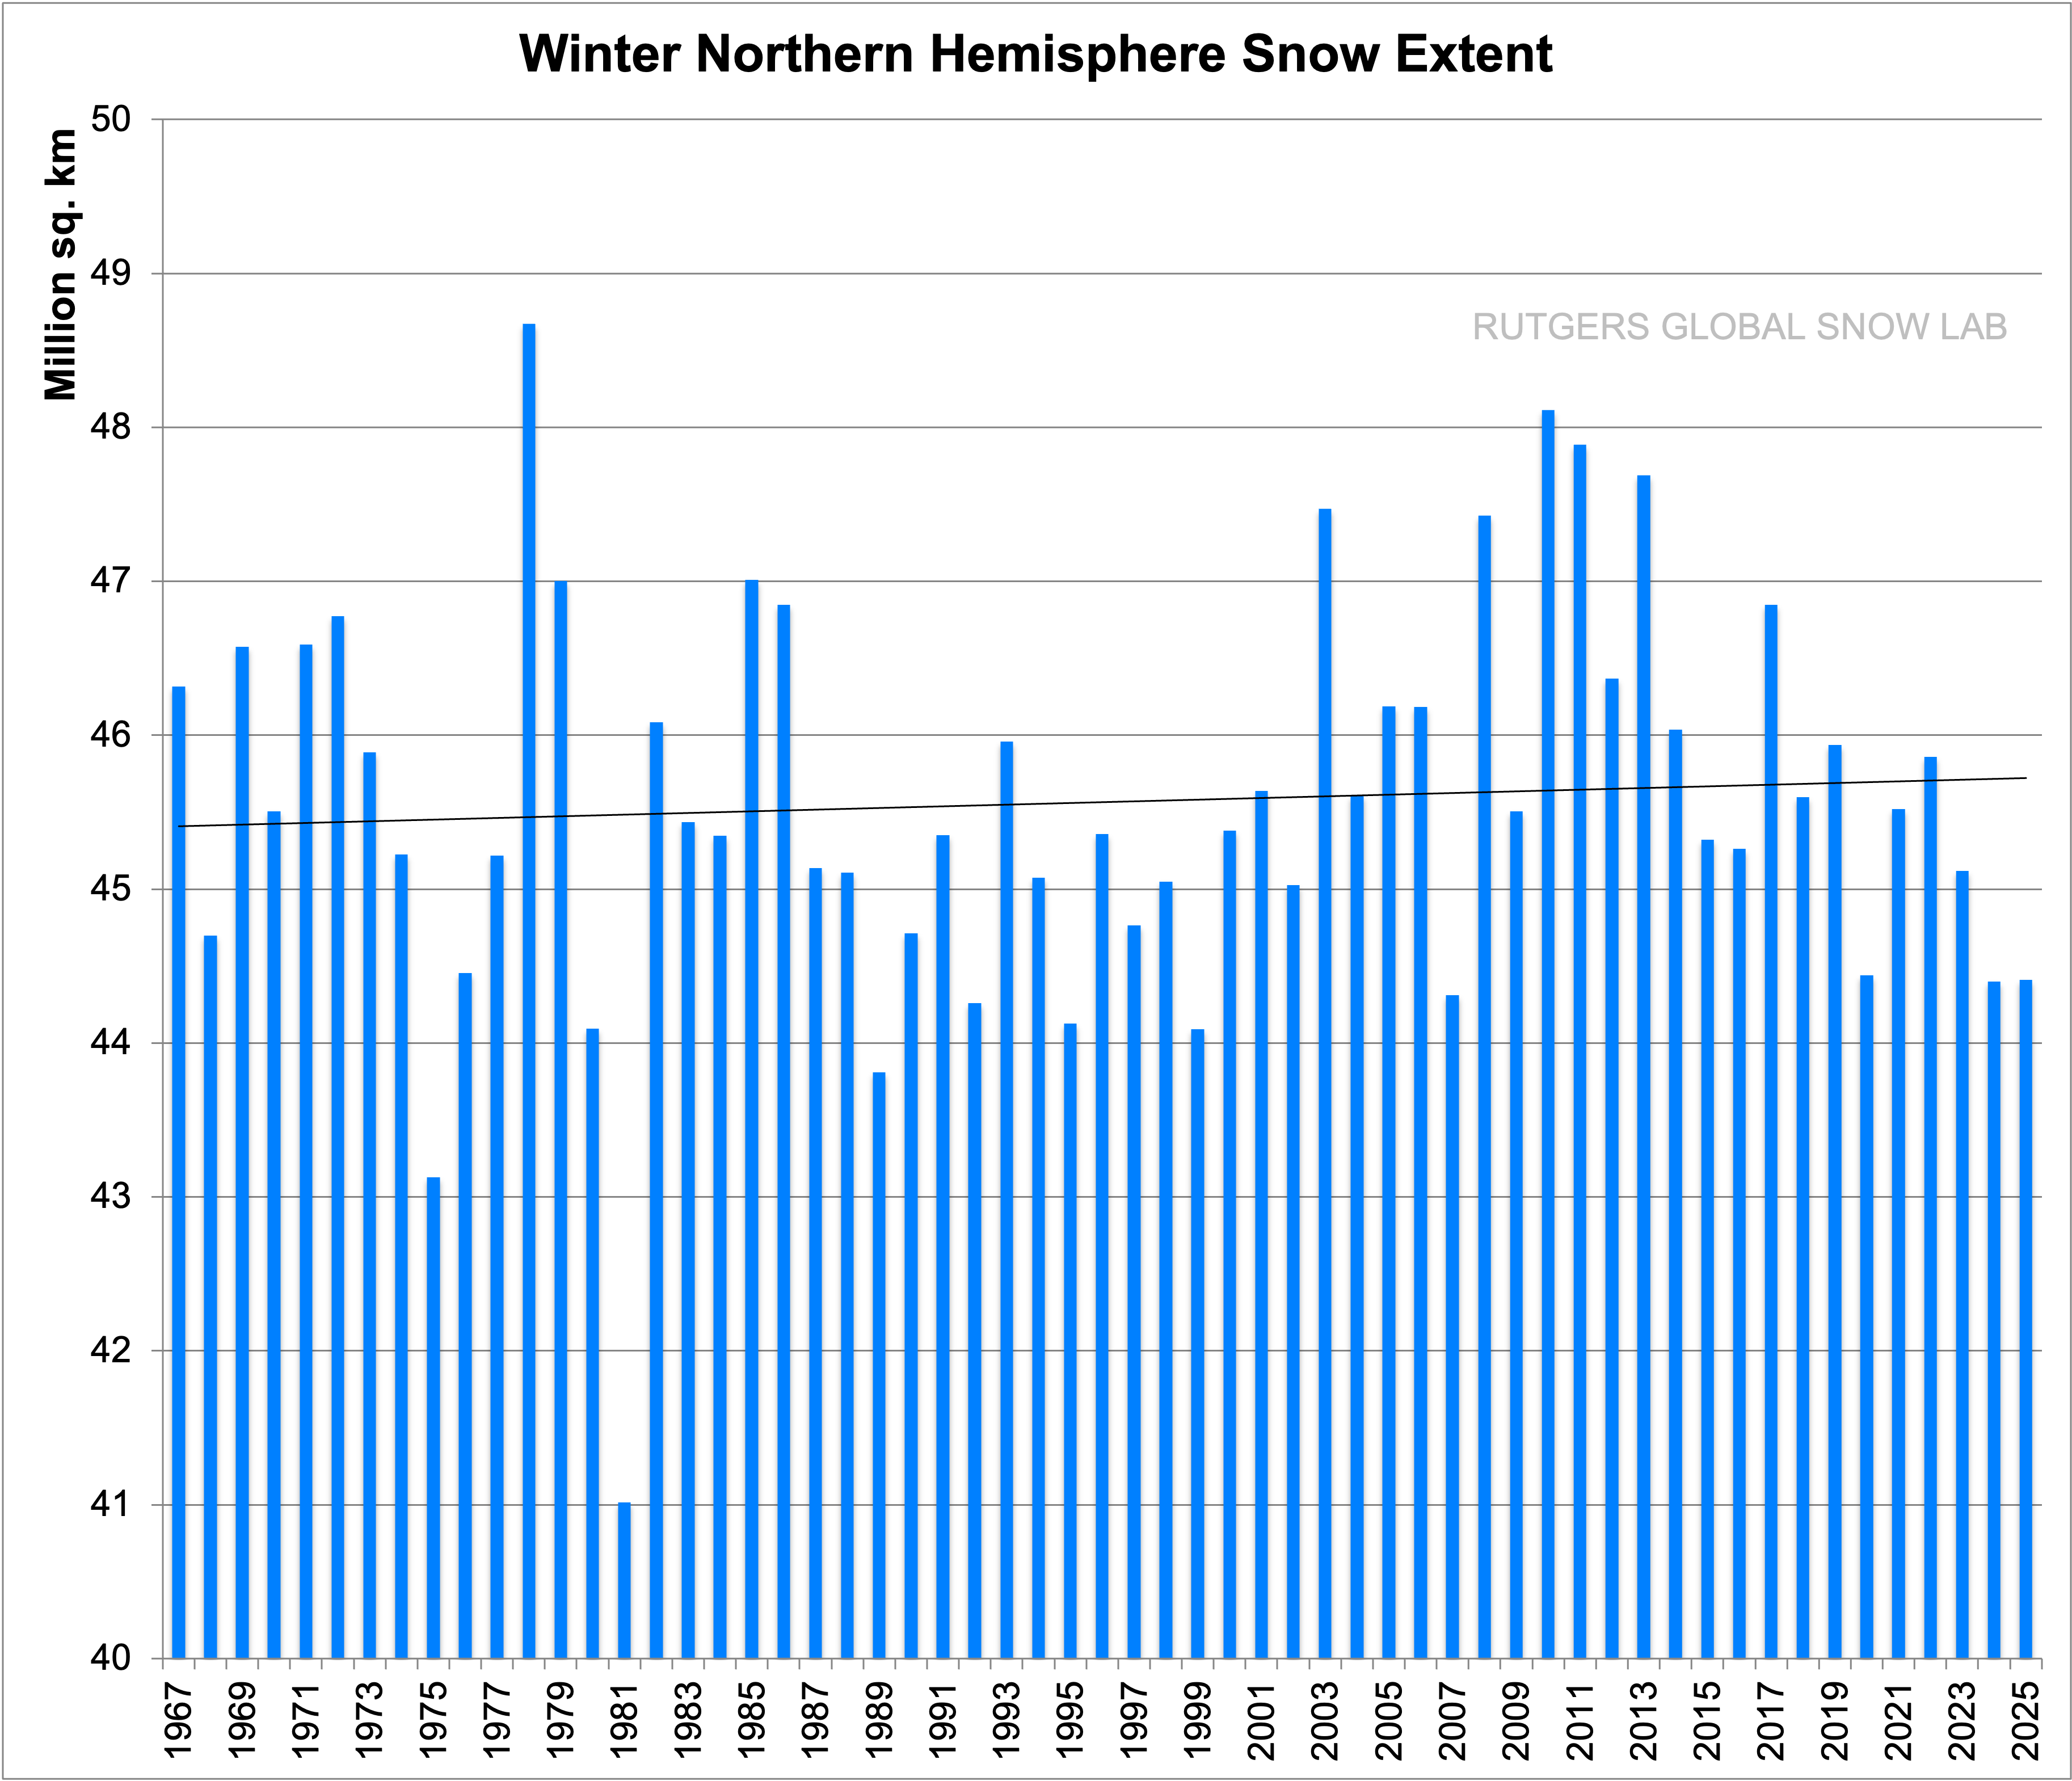
At this time, despite the increased water vapor we have had over the last several years, the data from Rutgers snow lab shows that spring time extent in the NH has been declining.
Winter shows a slight upward trend.
And Fall shows a significant upward trend.
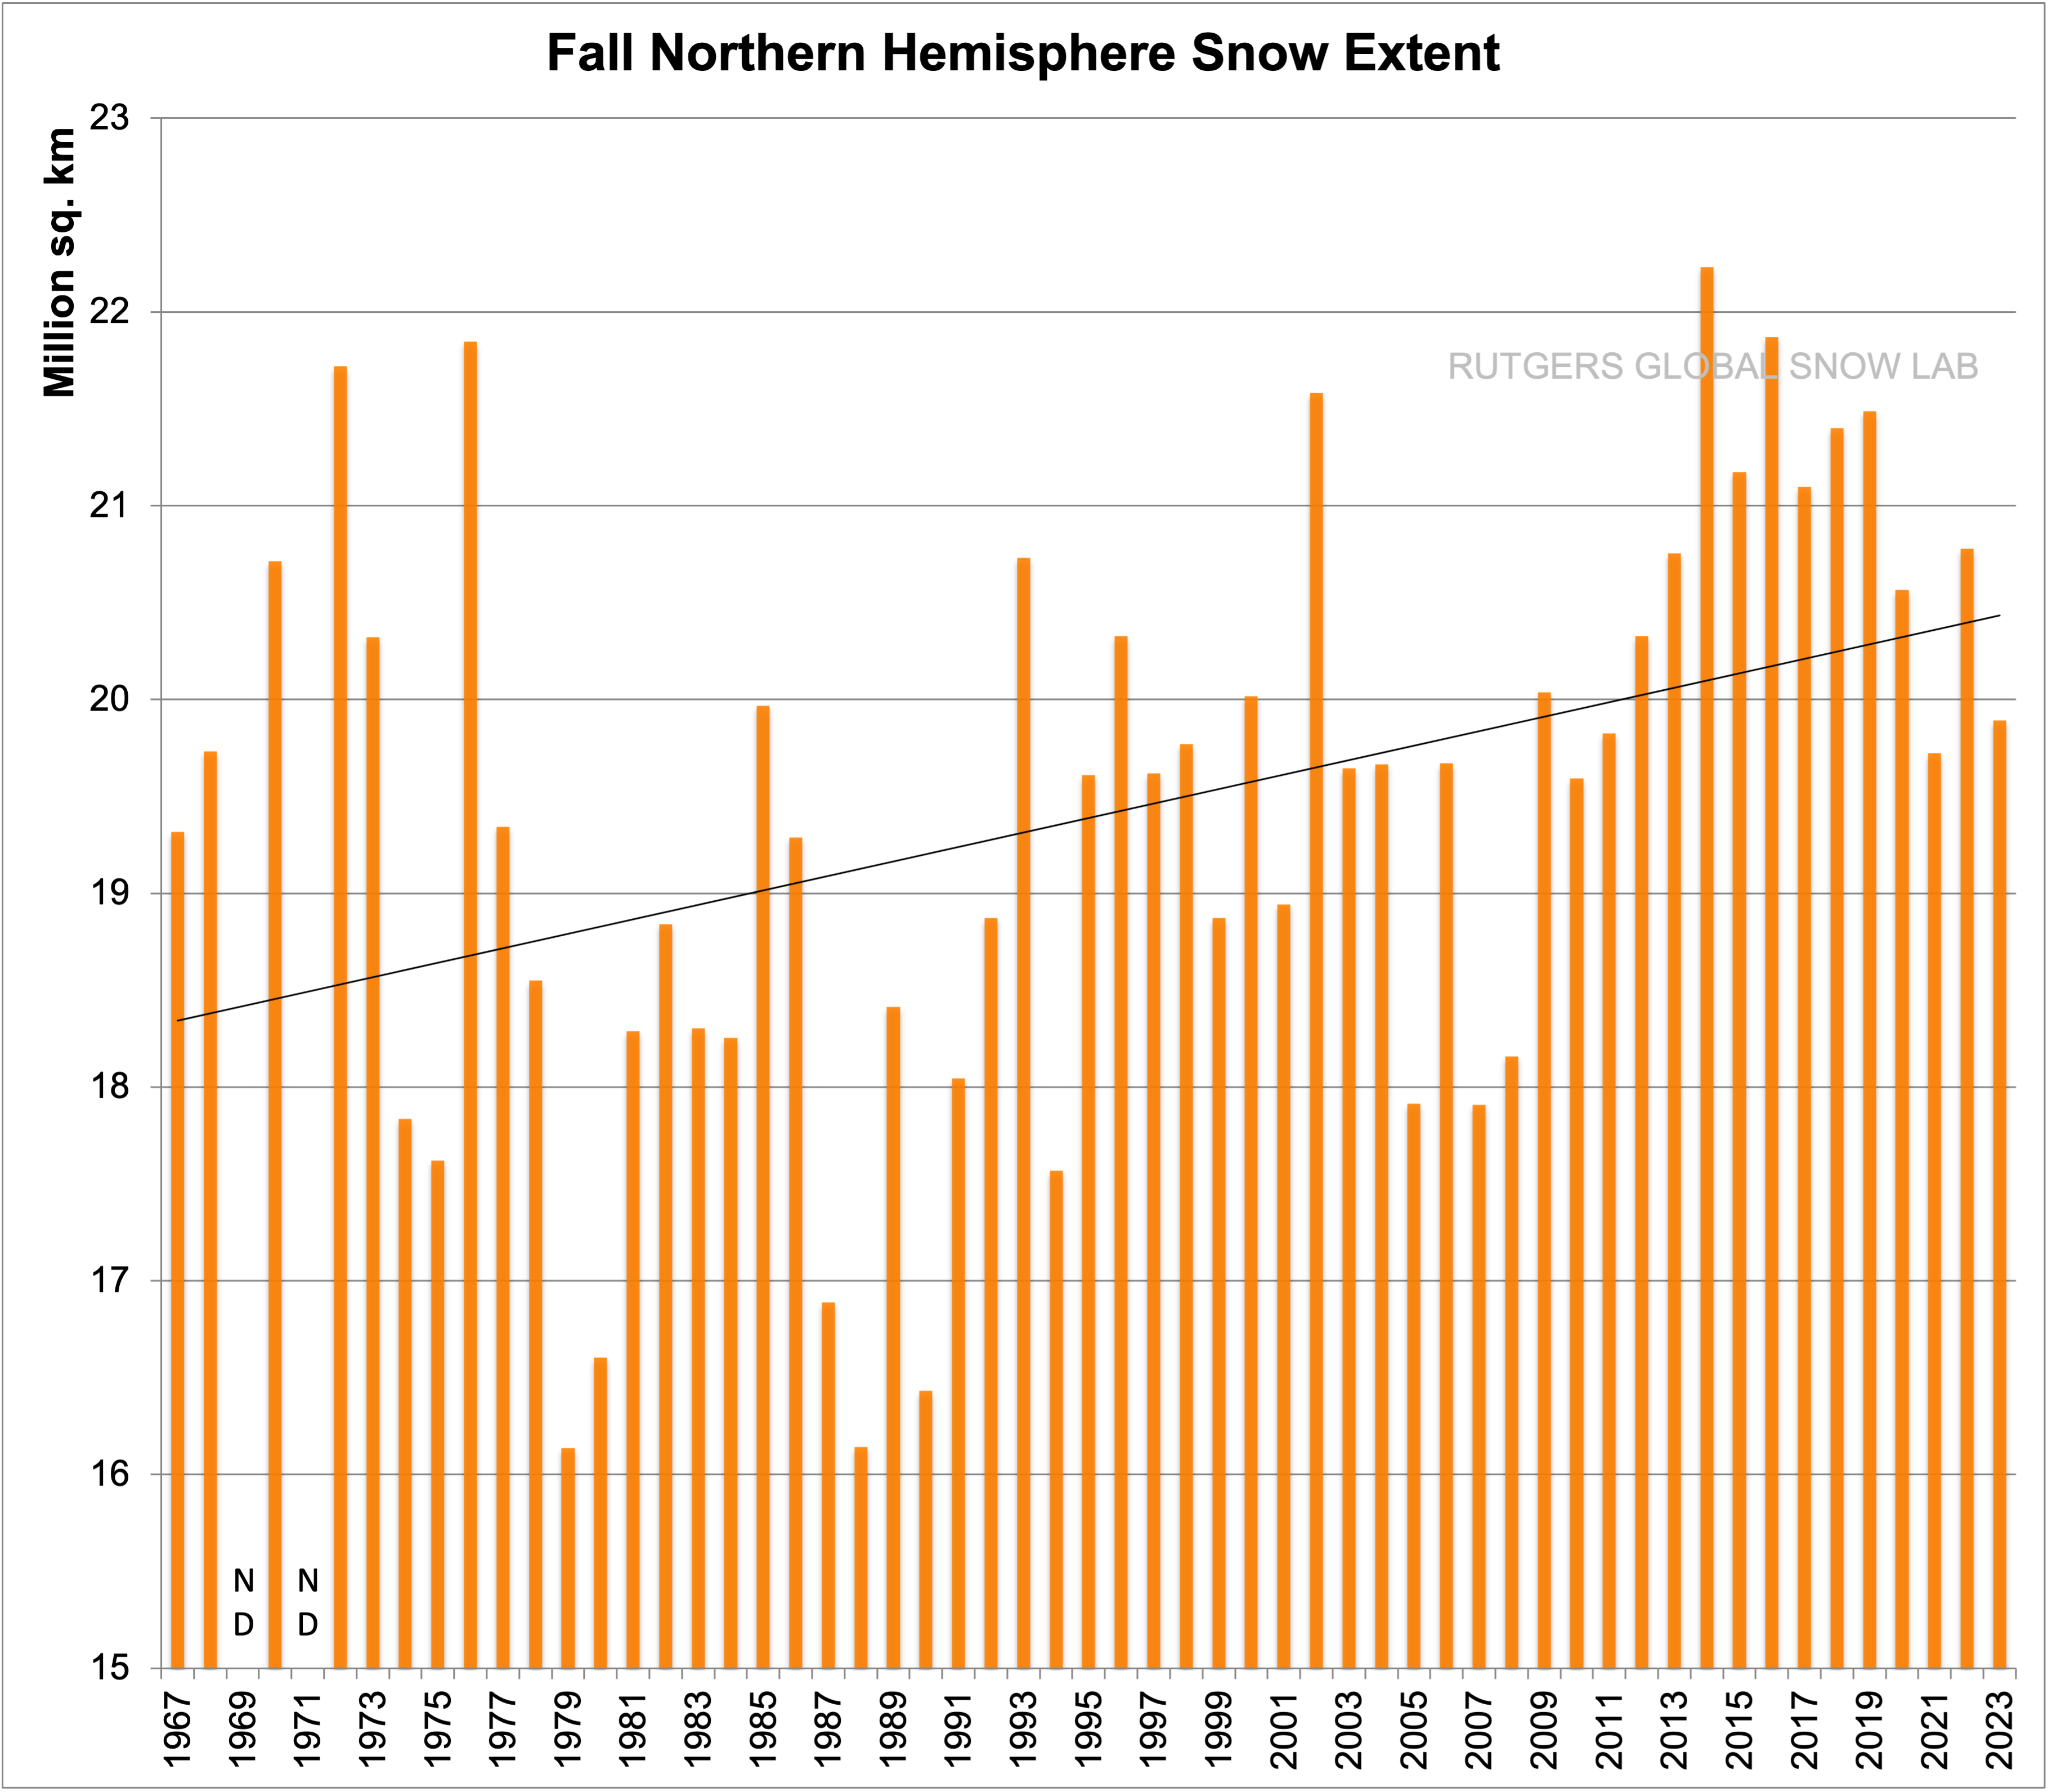
So despite the snow increasing it is melting. When the melting decreases is when things shift as they did during the LIA.
There are two glaciers in Glacier NP that show a bit of growth, the remaining 1,042 remain more or less static from what I have read.
All of the accumulation amounts to nothing more than wetter conditions IF it melts during the warmer months.
l feel that both rah and John make good points, but missing a important factor.
Which is that the onset of the cooling was not evenly spread across the whole of the NH. What l think is key to the building of the huge ice sheets in N America was the fact that the climate in N America grew much colder but the northern Paciffic and Atlantic oceans did not. So the cooling in N America allowed the cooler Springs to form. But the still warm oceans allowed a greater amount of snowfall to fall on a colder N America.
This truck driver is just a guy that has learned some things and not a professional as John is. Math is the language of science and the furthest I progressed was basic calculus. So in reality, I am not fluent in the real language of science and thus cannot be a scientist. John does and is.
I got the idea of the lack of melt being the key factor for the advance of glaciation from the book The Resilient Earth. And it is an idea that I pursued. That book was also the source from which I first learned of the Milankovitch cycles.
The work I have done does not involve calculus. I use sensible physical arguments translated into basic algebraic equations and arithmetic to derive some surprising results. It’s really the physics that matters in my work.
Your using your math. In fact living it. I on the other hand in my work deal in weights and measures and time and distance and these days the GPS takes care of most of the time and distance problems for me.
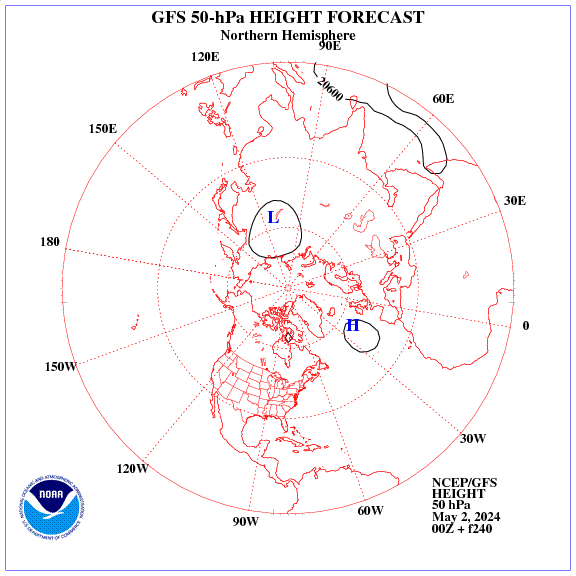
Am just a factory worker who’s had a interest in the weather since childhood, and l think a large part of the cooling is linked to the brake down of the jet stream patterning and how it allows the weather patterning to become less mobile. The weather forecast for +132hours to +180hours over N America helps to show how the weather patterning could cause climate cooling over N America.Should this sort of patterning increase in frequently and become less mobile.
As Joe Bastardi says. Weather is not a point in time. It is a continuing story. The factors that are bringing our current weather to us now are the result of things that occurred weeks or months before.
Yes over the longer term weather becomes climate.
So to allow the huge change in the climate in N America during the ice age, the weather would most certainly have to have change from its current set up. Because the current weather patterning is far too mobile to allow it to have happened.
Thanks for the Rutgers snow charts
When all three seasons are added together the trend appears to be flat.
What you have to consider is the timing of the changes. The current cycle of glaciation began about 500 years ago but the ice has yet to start accumulating.
NH autumns are cooling. Attached shows the trend in NH monthly sunlight at 30N for last 520 years to next 80 years.
The increasing spring sunlight results in more water in the atmosphere by the end of summer and some will fall on cooler land. So snow will increase. At some point it will begin to accumulate again.
The cycle has only just begun. The NH will experience more extreme weather with hotter and drier summers and water/snowier winters until the ice mountains reform and the whole hemisphere cools down.
I suspect your are correct colder times are coming. All of us have had the good luck to live in a period when weather and climate have been relatively benign.
Does anyone here believe they have enough knowledge of the whole complex picture to accurately predict how cold and what the duration will be?
There are people alive in the US that already experienced those very same extremes your describing in the 1930s and I don’t think the Milankovitch cycles had anything to do with that.
The way I see it is factors like the Milankovitch cycles, a better understanding of and ability to better predict solar cycles and variances, and their effects on the various oscillations in our climate cycles that will allow us to more accurately determine the magnitude of the changes and if such changes in weather and climate are to be of a shorter term or longer.
And then of course there is the wild card of Vulcanism.
The solar fluctuations, which appear unrelated to orbit but are close to Jupiter orbit of 12.8 years, do have significant contribution at decadaltime frame.
ENSO is unrelated to solar cycles but ENSO can be enhanced or subdued due to the solar influence. The current La Nina is being enhanced by the last lull in solar intensity. It lags sunspot activity by 31 months. The 2016 El Nino was enanhced by the peak of the last solar cycle. The 2011 El Nino was subdued as it coincided with the previous minimum.
The last section of this paper goes into detail on the Nino34 region response to sunlight and other solar factors:
Temp_EMR_Trends.pdf
Wake me in 500 years and let me know how things are going.
Good educational stuff after I looked up the definition of a half dozen or more words that I was unfamiliar with. I was going to say know and write to your audience or explain as you go. But then realized I am probably the wrong lowly audience here. Lol. Just a BS in chemistry.
think, the next ice age will bring new opportunities to buy beach front property. Lex Luther, eat you heart out!
My investment horizon isn’t that long. That should give you an idea as to what I think about speculations related to events occurring over the next hundreds to thousands of years. That attitude also relates to UN IPCC CliSciFi climate models.
Nice overview on the Milankovitch theory. A question on the fifth figure comparing the Dome C ice core temperature anomalies to the PI wave packet. Instead of using arbitrarily drawn up down arrows above the PI waves, why not use the eccentricity curve?
Your suggestion is correct! The wave packet envelope is the eccentricity. I just thought following the trends with straight lines helps with the visualization.
A fascinating read, John. Regarding other possible effects on insolation that might be enough to add a bit more granularity to results obtained from orbital mechanics, humidity/clouds in their +/- extremes should show in the paleo data. During glacial periods humidity is drawn down fairly rapidly, snowing out to form the ice sheets. Essentially, for much of this period skies would be cloudless.
https://earthobservatory.nasa.gov/images/85843/cloudy-earth
“One study based on nearly a decade of satellite data estimated that about 67 percent of Earth’s surface is typically covered by clouds. This is especially the case over the oceans, where other research shows less than 10 percent of the sky is completely clear of clouds at any one time. Over land, 30 percent of skies are completely cloud free.”
This difference between glacial and interglacial sky coverage should not be a small effect on insolation.
I don’t know how cloud cover would appear in a measurable way in the paleoclimate data.
Yes ferreting this out of the paleo in any precise way would be difficult. But, because present time ⅔ cloud cover definitely reduces insolation, and nearly clear skies in much of the glacial period allowed much greater insolation the effect is non trivial. Of course, this effect would work against the cooling of the the glacial period and the warming of the interglacial, moderating the extremes one might expect from orbital factors alone.
Two things, neither of which is directly linked to insolation or orbital cycles:
First, ice core data shows that temperature changes before CO2 does. CO2 follows temperature changes, therefore it isn’t a cause of climate change, but is an after effect (think cold soda fizzes less than warm soda).
Second, there are probably other things at work besides just orbital parameters and tilt. Post-glacial rebound during interglacials is a biggie (what happens if/when the Baltic Sea and Hudson Bay get cut off, become freshwater lakes, etc.
The rebound out of a glacial period is a result of the close synchronization of both the precession index wave packets and the obliquity wave that constructively interfere and likely dust on the snow and ice that accelerate the melting through absorption of the sun’s rays.
Yes – upswing in NH summer intensity combined with change in snow albedo.
Sea_Level_Hindcast.pdf
The post-glacial rebound I’m referring to is the land rising back up after the weight of the ice pushing it down is removed. The relative sea levels in Canada and the Baltic region is dropping, because the land is rising.
John Parmentola – Is it naive to postulate that your peculiar idea of insolation being a “wave phenomenon” (an idea “not acknowledged in the literature”!) compares somehow with Fred Hoyle’s insight that the carbon nucleus has a specific resonance energy??
Of course you are on about macrocosmic events – whereas Hoyle was thinking microcosmic.
It is a wave. That is not speculation. It’s a time-dependent modulated wave due to the earth’s celestial motions that beat on the solar irradiance.
While I generally agree with what is being said, there are a couple things that could be said additionally.
First of all, these three cycles are interposed on each other, adding together subtracting together, etc. As a 20 year electronics engineer, I had many occasions to mix multiple frequencies to achieve a specific result. To simplify this statement, it can be said that at some point in time, all three cycles will be in the position to most force a climate change to or from glacial. That is the point when all three are additive in their effect.
The way you would be able to emulate it is by using sine wave generators on three channels of an oscilloscope, and adding them, displaying a single ‘wave’. You could use frequencies in the khz range to establish the pattern. That would be (roughly) 20Khz, 40khz and 100khz. That will show the entire patterns over hundreds of thousands of years. Any/all frequencies can be adjusted to show the interaction. That will exclude all the other influences and show what can be expected from the Milankovitch cycles alone.
The other thing that can be mentioned is the ‘barycenter’ of the solar system, which is not stationary, but moves on a cyclic pattern of its own.
What Is a Barycenter? | NASA Space Place – NASA Science for Kids (yes, it is intended to be this simple.)
So, the center of the solar system is always moving around also, due to the planets size and mass and distance. Jupiter doesn’t even circle the sun, it circles the barycenter of the solar system which for Jupiter is outside the sun. The entire point here is that in addition to the earth’s cycles, there is another set of cycles that identify the location of the barycenter of the solar system, and thus how close or far earth is from that barycenter. And each planet has its own set of ‘Milankovitch’ cycles, which would interplay on earth’s, because of the sun’s center not being the solar barycenter.
To get a much more informative lesson on how the solar systems’ barycenter might affect climate, see papers by Landsheidt. Papers by Dr Theodor Landscheidt | Landscheidt Cycles Research (wordpress.com)
For instance:
Abstract: Analysis of the sun’s varying activity in the last two millennia indicates that contrary to the IPCC’s speculation about man-made global warming as high as 5.8° C within the next hundred years, a long period of cool climate with its coldest phase around 2030 is to be expected. It is shown that minima in the 80 to 90-year Gleissberg cycle of solar activity, coinciding with periods of cool climate on Earth, are consistently linked to an 83-year cycle in the change of the rotary force driving the sun’s oscillatory motion about the centre of mass of the solar system. As the future course of this cycle and its amplitudes can be computed, it can be seen that the Gleissberg minimum around 2030 and another one around 2200 will be of the Maunder minimum type accompanied by severe cooling on Earth. This forecast should prove skillful as other long-range forecasts of climate phenomena, based on cycles in the sun’s orbital motion, have turned out correct as for instance the prediction of the last three El Nino years before the respective event.
Obviously, this is testable. All we have to do is wait and see. This prediction was made in 2003.
Regarding your first comment, I agree that the waves associated with the precession index and obliquity interfere constructively (add) and destructively (subtract). This interference is the cause of interglacial inceptions and terminations. All this can be simulated. I did this with physical insight, algebra, arithmetic, and high precision results from a website by J. Laskar et al. that I cite in my paper. Their calculations include all the known effects on the earth’s celestial motions.
That 2003 prediction is already wrong.
The paper states:
So the solar-driven cooling was supposed to start from 1998 which, in 2003, was then the warmest year on record. 1998 is barely in the top 15 warmest years now, according to the surface data sets. Every global temperature data set we have, surface or satellite, shows continued warming after 1998 (+0.2C per decade in the surface data and RSS satellite; +0.1C per decade in UAH satellite).
This is an example, one of many, of someone using the anomalous El Niño warming of 1998 as an excuse to predict that global cooling had started. Rather as they are doing today with the 2015/16 El Niño warming.
There are good reconstruction of ocean level. The precession cycle is clearly defined in the frequency analysis of ocean level – attached.
I have doubts about the long period cycle being linked to eccentricity. Recovery is linked to precession so more likely a multiple of precession than just eccentricity. There is sound evidence indicating rising dust levels due to desertification lead to recovery from deep glaciation.
I expect to see more land ice accumulating around the North Atlantic in the current millennium. It may be as soon as 500 years but more likely closer to 1000 years.
My comparison of precession index wave packet cycles and the EPICA Dome C temperature reconstruction data show a long-term correlation. To improve the correlation, the obliquity wave must be included, which improves the timing.
I agree the precession period dithers due to the influence of the other cycles.
However I did this paper a year or so ago and it is linked on various sites:
Sea_Level_Hindcast.pdf
I was able to recreate the sea level changes to good agreement just using a constant period for precession and fixed obliquity.
I have formed the opinion that recovery from glaciation is not linked to eccentricity but rather a factor of precession cycles.
This is the graph I like (June insolation at 65N vs. 18O):
–AGF
The obvious and simple question:
How much of an effect could orbital variations have on the global average temperature in the next 100 years?
Could the effect reach 0.1 degrees C. ?
Could the effect reach 1.0 degrees C. ?
Would the effect be large enough to measure, or would it be obscured by a reasonable margin of error in the global average temperature compilation?
There are long term trend under way. What is being observed now are due to to the changes in sunlight. The Southern Ocean is cooling at 0.66C per century.
The arctic is warming very fast because the insulating ice is disappearing. This is due to sunlight changes. Once the ice goes then the surface responds much faster and higher temperature range to sunlight change.
Any loss of glaciers causes the land surface to also rapidly warm above 0C, whereas that was the limit when the ice was there. So changes in those located could easily be 5C/century.
Large enclosed bodies of water in the NH will also warm disproportionally as the solar EMR increases because they have shorter time constant than the oceans are are to small for the 30C temperature limit to kick in.
What you find is widely differing response. There is average warming but some location will warm fast and some locations will cool slowly.
Milankovitch Theory is related long duration changes, such as the +5000 years of gradual cooling. In such short time period of 100 years, the changes will be “natural variability”- large scale ocean and global weather pattern. And I guess, any effect from greenhouse gases, and seems rising CO2 levels could be stalling- and not due to any trillions of dollars government wasted, doing stuff which just wouldn’t lower global CO2 emission.
Any estimate of CO2 contribution to forcing is comparable with precession changes for specific locations on Earth.
Doubling of CO2 over a couple of centuries is supposed to increase forcing by a watt or so. There are latitudes with higher monthly variation in solar EMR over the same time scale solely due to changing precession.
Attached shows how solar EMR has and is changing over a 600 year cycle at 30N.
The April increase is 3W/m^2. The September decline is 2.6W/m*2. So a difference between April and September of 5.6W.m*2 over 600 years. Almost 1W/m^2 difference between the two months per century.
All the trends being observed across the globe can be explained by precession and the ocean surface limits of 30C and -1.8C.
No climate model shows the Southern Ocean cooling trend. No climate model shows the Nino34 region as trundles.
There is no calibration of insolation with temperature. To answer your question requires an understanding of the earth’s climate response to insolation changes. We do not understand this phenomenon despite the claim that models accurately account for the earth’s climate.
What the Milankovitch Theory does not explain was the intense cold over N America and NW Eurasia. The only thing that would cause that is the brake down of the smooth zonal flow of the jet stream,and so allowing the weather patterning to become less mobile and forcing more Polar air down across these areas.
So the Milankovitch Theory may show “the why ice ages happen” it will be the weather patterning and its effects to change the climate and the ocean currents what will explain “the how they happen”.
It easily explains it. Any land surface permanently covered with ice never exceeds a surface temperature of 0C. Easily verified by looking at the place on Earth that currently gets the highest daily solar input – the South Pole.
The other factor is the lapse rate. Currently responsible for most of the 6C difference in land temperature to ocean temperature due to average of 800m difference.
When the ice mountains forms, the difference increases by about 440m. So that adds another 4C to the difference between oceans and land.
“Easily verified by looking at the place on Earth that currently gets the highest daily solar input – the South Pole.”
You make an interesting point but I don’t think it is technically correct now (only for sometime in December).
Assuming this site is correct,
https://data.giss.nasa.gov/modelE/ar5plots/srlocat.html
… everywhere on Earth south of 73ºN latitude (87.71 W/m^2) got more sunlight today (October 2) than the South Pole (87.47 W/m^2).
Still, your point is well-taken and very interesting to think about.
Milankovitch had proposed the discrete solar forcing of heat and cold waves, but was denounced as insane by his peers.
Excellent and Very Important Paper (“brief note” perhaps — so please compose the longer version).
The Termination of the Holocene may be no small change but rather a sudden one, much like the sudden end to the Younger Dryas. Or it could be a series of rapid down and up pulses, as with D-O events. Much evidence suggests that Neo-Glaciation is already underway and has been for ~6,000 years.
The onset of the next glacial stadial will have enormous effects on plants, animals, and humans. Those impacts will vastly exceed those of the relatively minor warming we are currently experiencing (or has been predicted to occur by various seers).
Warming is (and will be if it happens) entirely beneficial to Life. Cooling into the next Ice Age stadial will be catastrophically bad.
The warmunists have the problem bass ackwards. The hue and cry over warming is totally misconceived and misplaced. It’s COOLING that threatens the planet.
Which is why this VIP is VI. Dr. Parmentola, I hope your friends at Rand grasp the concepts and can be leaders of the Great Flip Flop vis warming panic.
It is worth noting that there are a lot of explainations of the ice age cycles in the literature.
For example look at:
https://agupubs.onlinelibrary.wiley.com/doi/full/10.1029/2002JD003120
which uses coherent resonances arising in a simple set of delay equations
to approximate the ice age durations without the need for external quasi-periodic forcings.
The explaination here for the ice-ages does not make much physical sense. There appears
to be no physical basis for multiplying the percentage changes of two different time series
and then claiming that it is correlated with global temperature changes. What is needed is
some physical explaination of what this product means.
A side note to Issac, Javier and others. I appreciate that you may have a somewhat different theory/prognostication, but please consider the Bigger Picture.
The Warmunist Cult is using CAGW panic as a weapon to disrupt economies and enslave whole populations. Their stated goal is to End Capitalism and institute Global Authoritarian Communist Elitist Tyranny. Already the West (Europe, the US, Canada, Australia, and various minor countries) is reeling from impositions foisted on us by the Great Resetters. This approaching winter will be catastrophic for the poor and least self-sufficient. There be endless tragedy and suffering, completely unnecessary and avoidable.
If the Panic can be short-circuited by establishing that cooling, not warming, is the global hobgoblin, which is in fact the truth, then maybe their machinations will be quelled. Or maybe not. They might switch horses midstream, and promote a Global Hegemony to battle cooling. I wouldn’t put it past them. But in any case, their flip floppery might go a long ways to exposing their colossal calumny and corruption.
Warmer Is Better, especially better than the unavoidable Return of the Ice Age. Let’s get with that message, and not squabble about the particulars.
“global authoritarian communist elitist tryanny”. The number of ways such a statement is self-contradictory is impressive. And I am curious to know just who
exactly is part of the “warmunist cult” and what power they might have to do
anything?
Why, in the name of global warming the “cult” has all of Western Civilization committing energy suicide in order to destroy Capitalism and irreversibly establish the true religion of Marxist socialism in Europe and America. Don’t you know anything?
–AGF
The physics is described in the paper. The obliquity essentially affects the angular distribution of the sun’s rays, while the precession index (the precession modulated by the eccentricity) affects the amplitude. The product produces the correct dependencies. I have shown that the approximation is valid by comparing the model predictions for the percentage changes between extrema and the precise values for the points calculated from J. Laskar et al. cited in the paper. The accuracy is about 1%.
John,
Like you said you Javier:
“With all due respect, your book does not have one equation. Without mathematics incorporating physics, you have no predictive power or a testable theory.”
There is not a single equation in your post nor is there any physics. Then you state
that “the product produces the correct dependencies”. Which sounds a lot like you
have started with the assumption that the theory was correct then manipulated everything until you found something that looks like it was correlated with past temperatures.
So again what is the climate science that explains why the earth’s temperature responds in a nonlinear fashion to the obliquity and precession? And why is the
response proportional to the product of the precentage change of each?
Finally how does your model compare in terms of accuracy and predictive powers compared to others published in the literature? There are plenty of models out there that claim to do the same thing. I gave one example based on delay equations but there are a lot more.
There are no free parameters in my model! The model is based on physics translated into mathematics. It uses the following tool, http://vo.imcce.fr/insola/earth/online/earth/online/index.php,to determine the values of the obliquity and precession index at a specified time. These are the input to the model, which determines percentage changes in the insolation between maxima and minima and vice versa.
John,
The issue is that you do not present any physics that relates the obliquity and precession indices to the temperature. All you do is torture the different time series until you find something that matches reasonably well the temperature time series. And then when you find that they don’t match you claim the temperature series is wrong.
In essence your model has an infinite number of free paramters since there are an infinite number of functions you could apply to the orbital data to get a time series that looks like the temperature data. So unless you can justify why you use the functions that you did this approach lacks any meaning.
What the author does not appear to discuss is the relative changes in insolation at specific latitudes, specifically high latitude (I recall something like 68 degrees being the magic number).
I am given to understand that this can be far more significant than average global insolation in the formation or loss of (primarily northern) ice sheets.
The conclusions of my paper do not change because of a 3-degree shift.
Why are North American winters harsh? If you look at the distribution of ozone in the stratosphere during the formation of the polar vortex pattern, you can see more ozone farthest north at the Bering Strait. This is where the polar vortex flattens out. This is how air from eastern Siberia descends over North America in winter (you can already see this in the ozone distribution over Canada).


Is there a dependence of ozone distribution on the magnetic field in the north?
In my opinion, a stronger magnetic field repels ozone (see Siberia).
“Ozone is diamagnetic, meaning that its electrons are all paired. In contrast, O2 is paramagnetic, containing two unpaired electrons.”
As a diamagnetic, is ozone also repelled by the stronger magnetic field of the solar wind? So do geomagnetic storms affect the distribution of ozone in high latitudes?
It might seem that ozone can increase the temperature near the surface. Nothing could be further from the truth.
“Stratospheric intrusions are situations in which stratospheric air dynamically descends into the troposphere and can reach the surface, bringing with it high concentrations of ozone that can be harmful to some people. Stratospheric intrusions are identified by very low tropopause heights, low surface heights of 2 potential vorticity units (PVUs), very low relative and specific humidity concentrations, and high ozone concentrations. Stratospheric intrusions often follow strong cold fronts and can extend across multiple states. On satellite imagery, stratospheric intrusions are identified by very low humidity levels in water vapor channels (6.2, 6.5 and 6.9 microns). Along with dry air, Stratospheric Intrusions bring large amounts of ozone into the tropospheric column and possibly near the surface.”
https://www.cpc.ncep.noaa.gov/products/stratosphere/strat_int/
Thanks, John for one of the most interesting posts ever on WUWT.
You are welcome, Tom. John
Glacial maximum 20,000 years ago had near permanent El Nino conditions, the Holocene Thermal Optimum had near permanent La Nina conditions. Are changes in insolation at high latitudes solely responsible for such dramatic changes in atmospheric and oceanic teleconnections?
There are seven regular intervals between interglacials of the last 800kyrs, at 84,600 years, with additional shorter intervals at 31,000 years. There is a mirror image symmetry around 11c, as far as 17c to 5e, but since 5e the sequence has altered with the much longer most recent glacial period.
The red lines are at 369.4kyrs, or 9 obliquity cycles.
Ulric Lyons: “Glacial maximum 20,000 years ago had near permanent El Nino conditions, the Holocene Thermal Optimum had near permanent La Nina conditions.”
WR: Do you have any source for this statement? And what would be the reasoning? All might be important because it would tell us something about the weather conditions at those times driving oceanic behavior and at the same time, about oceanic conditions that drove weather patterns.
Those seriously interested in this question should read Javier Vinós’ new book “Climate of the Past, Present and Future”
Available here for all of $2.99!
Having read it, you will know more than you ever could have wanted to know.
I selected your link and was informed the site can’t be reached.
Can anyone provide a clear technical description (or pointer to such) of how I would compute the “Eccentricity Half-Cycle Durations” shown in the first figure of the article for myself given the eccentricity values over the same time period (e.g. from the Laskar website of the articles reference [3]).
I tried googling for “half-cycle duration” (and variations) but didn’t find anything that seemed to be this concept.
Using a plot of the eccentricity values and restricting myself to areas of the plot that resembled one cycle of a sine wave, I could measure the period, divide by 2, and get a value close to the author’s figure (+/- 2%), but in areas of the plot that were less like a sine wave I have no idea how to even define a “half-cycle duration”.
Googling “half-cycle duration” with quotation marks gives several results that seem related to the concept here but I still haven’t found an actual definition.
Incidentally there are several uses of phrases like “the paper”, “John’s paper”, “my paper”, etc in the above but I don’t see any actual reference or link. Perhaps this is it?
“Celestial Mechanics and Estimating the Termination of the Holocene”
Available at:
https://egusphere.copernicus.org/preprints/2022/egusphere-2022-569/egusphere-2022-569.pdf
(Found by googling “Eccentricity Half-Cycle Durations”.)
You do it the way I did from the tool J. Laskar developed on his website that I cite in my paper. You can specify the time period of interest, the mesh size, and the parameters you want to output. Once you have them in an output table you identify the maxima and minima and the time. That’s where the graphs come from in my paper.
Go to http://vo.imcce.fr/insola/earth/online/earth/online/index.php.
I argued 15 years ago that there has to be a solar variability component to the recent glacial sequence. To explain the irregular inter-glacial intervals, the minor inter-glacial events, and also the noise of D-O events and Heinrich events. And that the periods of planets ordering solar variability would have to coincide over very long periods with the planets dominating Earth’s orbital variations.
The compound intervals between 17c to 15a, 15e to 13a, 9e to 7b, and also with the minor peaks before and after 11c, are at the best long term harmony of the stable cycle of the four planets ordering sunspot cycles and centennial solar minima, at 1726.62 years, with the grand synodic cycle of the four gas giants at 4627.5 years. The latter would be modulating the former. They are at a ratio of 67:25, at 115684 years. Which minus the more regular 84600 year inter-glacial interval, gives around 31080 years for the shorter intervals between 15e to 15a, 7e to 7a, and 5e to 5a.
Then over 369,000 years the fit with obliquity cycles is good,
Figure 2 shows the strongest signal at 100 ky, eccentricity, for almost every component in the record, including CO2. Obliquity signals are more prominent than precession. Only RickWill’s inferred sea level shows precession higher. John, your evaluation discusses precession as a key driver, yet earth’s past records retain this as the weakest signal or influence.
Lastly, eccentricity and obliquity dominance have changed over geologic time often seen in wavelet analysis of oxygen isotopes.
Renee:
“Figure 2 shows the strongest signal at 100 ky, eccentricity, for almost every component in the record, including CO2.”
“John, your evaluation discusses precession as a key driver, yet earth’s past records retain this as the weakest signal or influence.”
WR: Figure 2 is about Vostok ice core data: yearly data. Precession has a strong seasonal signal. Summer heat is supposed to melt the ice caps. Since 800,000 years the rhythm of glacials is about 100.000 years instead of 40,000 years. My guess: the cooling deep oceans play a role. See:
 ?w=1110
Source.
(More info: this post)
Cold deep oceans result in 1-2 million km3 of very cold upwelling deep ocean water, during a glacial possibly even more because of a higher pole to equator temperature gradient. Because of the very low temperatures of the deep oceans, all possible summer warming is needed to cause sufficient melt of ice and snow to escape the glacial situation: with super-cold oceans obliquity isn’t anymore sufficient. Precession is an important factor in summer warming and precession became necessary to get an interglacial during the last 800.000 years. When NH summers are warm, the warm surface layer of the oceans extends further poleward, resulting in a smaller temperature gradient with the equator. The result of a smaller temperature gradient is a diminished wind strength over the oceans, resulting in less mixing of the surface layer with the cold layers below, further raising surface temperatures. Together with temporary high insolation because of precession, this results in much warmer ocean surfaces which cause NH warming and so enhance NH ice and snow melt.
My guess: precession surely plays a large role by changing weather patterns (winds) and oceans and in this way resulting in a higher temperature rise than possible by only obliquity and eccentricity. Some important extras have to be added.
The importance of precession on NH temperatures is clearly shown by the greening of the Sahara which is precession dependent. It is important to understand the greening of the Sahara from a meteorological point of view. What is needed to get the Sahara green is ‘just a little bit more heat’. Think about the situation of present pre-monsoon India (which is even on two sides surrounded by oceans) where nevertheless temperatures have to rise to 45+ degrees Celsius before the relatively dry air over Land causes enough convection to start the monsoon season. After the first rains surface temperatures drop by some 10 degrees: humidity enables high convection at much lower temperatures. Light water vapor molecules enormously diminish the density of the air. Let’s transplant this situation to the dry Sahara.
The actual dry Sahara misses enough moisture to cause strong monsoon rains over the Sahel and more to the north. Without a favorable precession, the Sahara also misses enough heat. Precession has a huge consequence on regional and world climate(s) and also on the average NH temperatures during its short but intense summer warming. The reason is….. the main greenhouse gas water vapor. Humid monsoon conditions over a green Sahara have two main effects:
1. Weather patterns shift worldwide. The higher moisture degree causes more low pressure over the Sahara where we find a higher pressure during drier and colder periods like during present winters. The present summer period (look at the above link for the month of July) shows a strong high-pressure area centered over the North Atlantic Ocean, more especially over the North Atlantic Gyre: well-collecting heat, well evaporating, and well raising the salinity of the upper layer, finally leading to high latitude deep downwelling. Deep downwelling of high saline water at the high NH latitudes causes what is called ‘heat piracy’: in the deep disappearing surface water must be replenished by warm surface water from the SH equatorial Atlantic ocean. SH heat is brought to the NH hemisphere, adding to NH temperatures.
2. A green Sahara results in a much higher moisture degree over the previously dry deserts. While water vapor is the main greenhouse gas, over a large now humid area spaceward surface emission immediately gets absorbed. The same for the whole warming NH: a higher moisture degree results. The high water vapor content considerably diminishes spaceward radiative heat loss over the NH, further enhancing the heating of the glacial NH and further enabling the melt of ice and snow. Etc. etc. A self-inforcing ‘chain of events’, only starting at the highest insolation during the Summer months.
Thanks to precession.
It doesn’t matter too much whether Earth’s periods of orbital change vary
with time at any precise frequency, as far as Milankovitch cycles are
concerned. There are absolutely no changes to the insolation experienced
by the entire earth due to either change in the obliquity of its rotation
axis over time or change (caused by orbital eccentricity combined with
rotational obliquity and precession) in the synchronization of its
perihelion with its tilt axis in relation to the Sun, due to the
precession of that obliquity over time. And changes to the insolation
experienced by the entire earth due to the eccentricity of its elliptical
orbital path around the Sun are insignificant and couldn’t even begin to
account for the vast changes in the temperature of the earth that occur
during an ice age. None of these three things could cause any significant
changes to Earth’s temperature if it weren’t for three key factors (see
below). Also, any changes to Earth’s temperature due to the “extreme
cyclonic weather at the poles primarily caused by the Coriolis Force” have
pitifully nothing to do with Milankovitch’s theory or, for that matter,
with the temperature of the earth in general. And “earth’s particular
climate response to changes in insolation at northern latitudes” is
another red herring (there are no such changes to total Earth insolation
suggesting there should be no GLOBAL temperature change).
The author did come close when he referred to “the insolation at northern
latitudes where ice and snow can accumulate on the earth’s comparatively
large landmass of the northern hemisphere”. But then he kept on
conflating insolation at northern latitudes with general insolation of the
entire earth, and, in his replies, mostly ignored those three key factors.
And once or twice he, though not most commentators (except rah), did
mention those three key factors, but only in passing. And it is those
three key factors that tell, practically, the WHOLE Milankovitch story.
No need to make this complicated. See, for example, Tzedakis, P.C., et
al., A simple rule to determine which insolation cycles lead to
interglacials, Nature 542, 427-432 (2017).
What are those three key factors? They are sufficient amounts of: land,
water, and ice … on the surface of the earth … all the time. Number
one, there is a lot more land in the northern hemisphere where snow, from
precipitation, and ice, can potentially accumulate (and not float into the
oceans and melt). Number two, if summer temperatures on that northern
land, and only on that northern land, and only during its summer, are low
enough, the land ice from the previous winter won’t all melt away before
the next winter begins. Number three, if that land ice doesn’t all melt
away, but instead accumulates, winter after winter, then it eventually
builds so high that it starts to move, as glaciers, south. And the
consequence of those ever-spreading glaciers is very large decreases in
the temperature of the entire earth due to the increased reflectivity of
that ever-growing ice. Voila! We have an ice age. No need to get into a
dither about other “specific physical mechanisms”. And because this is an
example of meteorological positive feedback — more accumulated snow means
more reflectivity means lower temperatures means still more accumulated
snow (a “tipping point”) — we get a doozy of a temperature drop. And
that’s it. None of that other stuff, especially CO2 — just that. Is
anyone listening?
David Solan
Global warming is all about the ocean.
And global warming is all about causing a more uniform global average temperature.
And global cooling is drier global air.
“More than 90 percent of the warming that has happened on Earth over the past 50 years has occurred in the ocean.”
https://www.climate.gov/news-features/understanding-climate/climate-change-ocean-heat-content
I would say recent warming is like all global warming- all global warming involves more than 90% of global warming warming the entire ocean.
Our entire ocean average temperature has average temperature of about 3.5 C.
And our cold ocean is why we are in an ice house global climate.
If our ocean was 2 C warmer, we would still be in an ice house climate, or we still have
a cold ocean with average temperature of about 5.5 C.
But if our ocean had average temperature of about 5 C it would huge effect upon global warming.
No one thinks that ocean got as warm as 5 C in the last million years, but it is commonly said
that our ocean has been 4 C or warmer.
When our ocean is 4 C or warmer during in interglacial period, it is the warmest time of the interglacial period. And it is same time that Sahara desert is green and called African humid
period: https://en.wikipedia.org/wiki/African_humid_period
It’s taught in elementary school the human evolved when Africa had drier periods- trees gave
way to grasslands. Both humans and polar bears evolved during colder periods on Earth.
Anytime we have had global warming, the Sahara Desert becomes most grasslands, and rivers and lakes and some amount of forests, and that is called African humid period which lasts for many thousands of years. And thought such African humid periods are related to human migration to the rest of the world.
And would appear that in order to have a African humid period, one needs ocean of 4 C or warmer.