I keep hearing and reading that there is nothing the President can do to lower the price of gasoline. Not true? The President could lower the price of gasoline by 25-30 cents per gallon by waiving the summer gasoline mandate.
TonyL has it right. Going back to the Trump oil and gas policies would alleviate most of our problems. The supply chain and other problems that are contributing will eventually work themselves out, but if gasoline prices stay high the economy is going to suffer enormously.
The U.S. needs to change policy on oil and gas if we are to be economically viable. We need an all-out effort to find and pump as much oil and gas as possible as quickly as possible using all our tools.
This will not only help with inflation in the U.S. but also in the entire world because the U.S. can increase the world supply substantially and this will lower prices for everyone.
Of course, Joe Biden has no intention of pumping more oil and gas. He is going to do just the opposite and our economy is going to be entering an official recession in the near future as a consequence.
Economic activity is slowing down because gasoline prices are taking everyone’s extra cash out of their pockets so they can’t spend that extra cash at an eating establishment or the local bar or the local flower shop, and those businesses experience less cash flow and so have to lay off some of their workers, and on and on and on.
All because Joe Biden has jacked up gasoline prices outrageously and unnecessarily.
Republicans better do something to fix this problem if they are given the majority. Voters need to help the Republicans to stop Biden’s insane Climate Change plans for the United States.
Everything Biden does harms the United States. He is a disaster for our country and for the world. January 2023 cannot come soon enough.
The lines took so long that I used to get out and do minor maintenance on my IH Scout like making sure the bolts were all tight on my roof rack and washing the windows and side-view mirrors.
NOOOOOOOO! Cars that get more than 35 mpg still drive on OUR roads paid for by gas taxes.
Lets just get rid of all gas and diesel taxes and require a fee for every private vehicle based on GVW and miles driven per year and only for used to build and maintain roads, not bike paths or to subsidize public transportation.
The switch has been turned off with out making sure we have set up the room for our blind public to make its way into the future. He (they) want green at any cost and don’t care what happens if we turn off the other energy systems right now. This is madness and this is the NWO plan to make us all poor and dependent so they can take over as the new saviors of the planet and sit in our 200ft square apts and wonder that the heck happened JUST SAY NO
x-axis: distance from the sun y-axis: temperature blue line: theoretical temperature of a black body at the respective distance blue dots: surface temperatures of planets & some moons, starting with Mercury to the left (taken from Wikipedia, not necessarilly all too accurate) light blue dots: temperature of Venus at 1 bar pressure, and temperature of Jupiter & Saturn at 92 bar pressure (there is about 92bar pressure on the surface of Venus) red line: with a feedback just doubling any forcing, that is the temperature Earth would take on if you moved it clover or further to the sun.
“red line: with a feedback just doubling any forcing”….so you could say double the methane forcing and get the red line ? Maybe explain that again for us picky types….
Well, it is about the nature of forcings and feedbacks. Moving Earth closer or further from the sun is forcing in the context of climate science. As the chart shows planets mostly have the temperature they are “forced” to have.
Climate science however claims there were powerful feedbacks enhancing these forcings. Even if feedbacks just doubled the effect of forcings, then Earth would warm or heat according to the red line.
light blue dots: temperature of Venus at 1 bar pressure, and temperature of Jupiter & Saturn at 92 bar pressure (there is about 92bar pressure on the surface of Venus)
As we can see Venus is just a little bit warmer than a black body there, despite its atmosphere consisting almost entirely of CO2. That is about 950.000ppm! Both Jupiter and Saturn on the other side, at the respective 92 bar pressure levels, are about equally warmer than a black body as the surface of Venus is. In other words, it is not so much about what the atmosphere consists of, but rather how strong it is. https://greenhousedefect.com/about-the-physical-impossibility-of-feedbacks Feedbacks are a conditio sine qua non for the climate crisis narrative. Apparently this “need” is also their origin, rather than physical evidence. Sticking to the latter, we are rather left wondering what this unscientific non-sense is all about. Both on the micro level, based on line by line calculations, as on the macro level as presented here, the evidence not just does not support the claim of significant positive feedbacks, but rather speaks strictly against it. On top of that we can fairly well see not just what went wrong, but also why it did.
IP said: “As we can see Venus is just a little bit warmer than a black body there”
Venus’ blackbody temperature is sblaw(2600 W/m2 * (1-0.77) / 4) = 227 K. It’s surface temperature is 737 K. It is way warmer than a blackbody there. And that is a massive 737 – 227 = 510 K or sblaw(737 K) – sblaw(227 K) = 16579 W/m2 greenhouse effect. Contrast that with Earth’s GHE of 33 K or 155 W/m2.
This “blackbody temperature” used in “climate science” is nonsense. There is no blackbody with an albedo. By definition, a blackbody does not reflect light. The actual blackbody temperature of Venus is then simply ((2600/4) / 5.67e-7)^0.25 = 327K.
For the same reason that of Earth is 278.7K ( =(342/5.67e-8)^0.25 )
Celestial bodies tend to take on this true blackbody temperature, as reflectivity in SW and LW tend to cancel each other. “Climate science” however notoriously denies LW reflectivity so that they can claim anything would emit like a blackbody, while reflecting a lot of SW radiation. This produces erroneous GHEs.
The blackbody temperature is the hypothetical temperature a celestial body would have if it were truly a blackbody in steady-state emitting at the same rate it is actually absorbing. For Venus that is 227 K. It is not a statement that the celestial body is a blackbody. Anyway, NASA confirms this figure on their Venus fact sheet page.
The GHE is defined as the actual near surface temperature minus the SB temperature of the absorbed solar flux. By definition Venus’ GHE is 510 K whereas Earth’s is 33 K.
It is okay to analyze the difference between the actual near surface temperature and SB temperature of the TOA solar flux. But you should probably use a different term other than GHE since that term is already reserved for the definition above.
Another concept worth discussing is the actual near surface temperature minus the SB temperature of the received solar flux near the surface. Based on that definition the hypothetical increase would be 288 K – sblaw(185 W/m2) = 49 K above what it receives from the Sun. But I don’t go around claiming this is the GHE even though it is probably more representative of the net effect at the surface because hijacking an already established definitions like that only leads to confusion in discussions.
The blackbody temperature is the hypothetical temperature a celestial body would have if it were truly a blackbody in steady-state emitting at the same rate it is actually absorbing. For Venus that is 227 K.
Again, this is wrong. The SB law does not lie, nor does the formula. And if you know it, you need no “fact sheet”.
As with Venus:
(650 / 5.67e-8) ^0.25 = 327.2K
(650 * (1 – 0.77) / 5.67e-8) ^0.25 = 226.6K
As with Earth:
(342 / 5.67e-8) ^0.25 = 278.7K
(342 * (1 – 0.3) / 5.67e-8) ^0.25 = 254.9K
The first is the blackbody temperature, with identical absorptivity/emissivity. One could add the term 1/1, but obviously that is pointless.
The second is “climate science” “backbody” temperature, including albedo, but ignoring emissivity.
I never said the SB law lies. In fact, I spent a considerable amount of time trying to convince a WUWT article author and commenters that the SB law is correct a few weeks ago.
Anyway, Venus does not absorb 5.8e24 joules in its year. It only absorbs 1.3e24 joules. 1.3e24 joules / 460e12 m2 / 19414080 s = 150 W/m2. So at steady-state that is sblaw(150 W/m2) = 227 K. By definition that is its blackbody temperature. NASA confirms the 227 K figure here. It has nothing to do with “climate science”.
Similarly, Earth does not absorb 5.5e24 joules in a year. It only absorbs 3.9e24 joules. 3.9e24 joules / 510e12 m2 / 31557600 s = 241 W/m2. So at stead-state that is sblaw(241 W/m2) = 255 K. By definition that is its blackbody temperature. NASA confirms the 255 K figure here (technically 254 K).
Again, this is not a statement that either Venus or Earth are blackbodies. It is statement of the blackbody temperature given a specific amount of energy being absorbed.
And again, a blackbody does not reflect light. So a blackbody at the position of Venus will absorb ~650W/m2, and ~342W/m2 on the position of Earth. A grey body will absorb less, but also emit less.
And it is not an accedemic discussion, rather is highly relevant and a significant error in “climate science”. Here is the example of water showing its reflectivity both over a wide range – from SW to LW.
It turns out water has a higher reflectivity in the LW than in the SW range. It is 0.066 in the SW, but 0.0908 in the LW range, both hemispheric and spectral.
It turns out a water surface would become even warmer than a blackbody, despite absorbing less radiation. And it demonstrates how futile and wrong it is, to only consider SW reflectivity.
Neither Venus nor Earth are blackbodies. And this has nothing to do with climate science. The blackbody temperature of a celestial body is defined as sblaw(ASR). It is a definition. It is neither right nor wrong. It is what it is. If your primary grievance here is the name then lobby science to adopt a new name for that concept. What you definitely should not do is use the already established name for the sblaw(TSI/4) concept because it is going to lead to confusion. Don’t hear what I’m not saying. I’m not saying sblaw(TSI/4) is not an interesting concept worthy of discussion. It is interesting. It should be discussed. But so should sblaw(ASR).
Sticking with the “blackbody temperature” as climate science defines it, the result is ~12K too cold. So the moon then has a “GHE”, which it cannot have.
The true blackbody temperature however is spot on.
Your calculations have a math error both for the ASR and TSI/4 case. Additionally the Moon is not at 394 K everywhere and all of the time. That is not the Moon’s average temperature.
Anyway, the Moon’s blackbody temperature is (1360 / 4 * (1-0.11) / 5.67e-8) ^ 0.25 = 270 K. That is confirmed by NASA here.
The Moon does not have a near surface temperature since it doesn’t have an atmosphere so it technically does not have a GHE by definition. However, you could use the actual surface temperature of 200 K [Williams et al. 2017] as a proxy. The Moon’s blackbody departure with this method is thus 200 – 270 = -70 K. In other words the Moon is 70 K cooler than its blackbody temperature would suggest. This is due to 1) not having an atmosphere and 2) being a significant inhomogeneous radiator.
Earth blackbody delta = +33 K
Venus blackbody delta = +510 K
Moon blackbody delta = -70 K
I order to avoid the averaging issue I did take the maximum temperatures. So please do not try to go this way to dudge the argument. Sorting this out, everything I said above holds true. Your claim over an “error” is futile. Nor could you even explain what that “error” would be.
Btw. pls do not say “confirmed by NASA”. They are hardly an independent source related to “consensus climate science”.
The error is the multiplication of 342 by 4. That is none other than TSI. The Moon neither absorbs nor receives TSI because the Moon is not flat. The Moon is a sphere so you have to either do the full integration down the latitudes or do the divide by 4 shortcut of the TSI to get the spatial flux value. You can’t just use the TSI directly (or TSI/4 * 4 like what you show).
Again, this has nothing to do with climate science. And NASA is only plugging in the ASR flux into the SB law. If NASA is wrong about these figures then it is because the SB law is wrong; not because they are or aren’t independent. For the record…both NASA and I think the SB law is right and nobody has found any significant errors with their Goddard Space Flight Center’s fact sheets.
With maximum temperatures the sun will be in the zenith, thereby radiation 342×4 onto the respective spot at the equator. Should not be hard to understand.
So now we’re doing all of the calculations based on the maximum temperature and zenith flux? Going that route gives 328 K – sblaw(342 * 4 * (1-0.3)) = -33 K or 328 K – sblaw(342 * 4) = -66 K as opposed to +33 K.
The graphics shows how the thickness of the troposphere affects temperature at different latitudes on Earth. There is a constant vertical temperature gradient in the troposphere. The troposphere is not present on planets where the pressure is not significantly higher than 100 hPa. https://www.nature.com/articles/ngeo2020
The observed temperature of Venus at 1 bar is not much higher than that of Earth at 1 bar, despite the completely different composition of the atmosphere.
A pressure of 1 bar occurs on Venus at an altitude of about 49.5 km. At an altitude of 54 km, the temperature is degrees 293 K=20 C and increases downward in proportion to the pressure.
1 bar pressure level is rather at 50km altitude, and the temperature there about 330-340K.
TonyL
May 30, 2022 7:29 pm
I follow Dr. Roy Spencer and the satellite all-Earth temperature data. This is known as the UAH data set.
Temperature series are TLT – temperature lower troposphere.
TMT – temperature mid-troposphere.
Tropopause
Lower Stratosphere
Last month, all except TMT were updated as usual.
Almost June now, and TMT still has not updated.
Anybody know if there is trouble with UAH, Dr. Spencer or TMT.
Or was this just a one-time glitch?
The most telling of the UAH Charts is the S Pole. Chart out each month and you will see there has been no warming since the start of the data set. Antarctica is a natural control for isolating the impact of CO2 on temperature.
5/30/2022 Non-Climate Scientist Forecast. The extended La Nina will allow for excess heat to accumulate in the Pacific Ocean. This will result in an unusually strong El Nino and a temperature spike that will likely exceed 1998 and 2006. CO2 has nothing to do with the warming and everything to do what the clouds over the oceans…which La Ninas reduce.
I notice that the ENSO meter (alongside the comments) has just gone up a fraction , so maybe the La Nina is about to end and a (land) warming El Nino will appear . Sitting here in England, burning electricity and gas i can ill afford , icy rain outside , I can only hope that you are correct.
But the CET is +2.6 C above the average for May (a few days ago) so you must just be imagining the cold. Announcement of warmest May ever coming tomorrow.
“Announcement of warmest May ever coming tomorrow.”
Absolutely not. Current May CET upto 30th is 13.1°C, 2.0 above the 1961-1990 average. In the top 10% of May CET figures, but 2°C below the record from 1833. It’s probably going to be a bit cooler than the last two warm Mays, 2017 and 2018. Still a lot warmer than last year.
I’d just like to second that; we’ve had that icy rain hit us hard and my heating came on – for the end of May/beginning of June this is much colder than usual weather, I’ve not had the heating on at this time of year in the 20 years I’ve lived here. Brrr.
Gilbert K. Arnold
May 30, 2022 7:58 pm
Does anyone remember: the “Moral Equivalent of War” (MEOW)? and Jimmy Carter saying that?
Never thought I’d see the day that Jimmy Carter would seem like an improvement over the current administration. True enough, it’s like the improvement of facing the guillotine instead of being burned at the stake.
This coming year 300,000 children will die, not because of climate change, but due to a lack of clean water.
Climate change doesn’t kill 300,000 children annually
Turn on the tap and instantly there is a flow of clean, parasite-free, we take water for granted.
We are so used to our abundant water, many people turn on the tap to brush their teeth and leave the tap running. We water our gardens, wash our cars, brew beer, and play in our swimming pools without acknowledging this easy access to freshwater is a luxury.
In some parts of the world, safe water is not so easy to access.
The figures make for stark reading.
According to the World Health Organisation:
·In 2017 29% of the global population lack easy access to safe, uncontaminated drinking water. Of these 2.2 billion people, 829,000, including 297,000 children under 5, died from diarrhoea alone.
785 million people lack even a basic drinking-water service, including 144 million people who are dependent on surface water.
Globally, at least 2 billion people use a drinking water source contaminated with faeces.
In the least developed countries, 22% of health care facilities have no water service, 21% no sanitation service, and 22% no waste management service.
Contaminated water and poor sanitation are linked to the transmission of diseases such as cholera, diarrhoea, dysentery, hepatitis A, typhoid, and polio. Absent, inadequate, or inappropriately managed water and sanitation services expose individuals to preventable health risks.
Diarrhoea is mostly preventable and yet we waste billions of dollars every year “fighting” climate change, arguably a fight that has only claimed energy-poor victims. Not a single person has on their death certificate “Cause of Death: Climate Change”.
The demand for more money to fight climate change has risen inexorably to the extent we are projected to spend trillions of dollars on a non-issue, whilst the annual cost of a genuine, fixable issue providing clean, safe water is estimated at $22.6 billion.
I accept recorded temperatures are rising. I don’t accept the mild warming we are experiencing in some parts of the world will be anything but benign.
Our species was born in Africa, only migrating out of Africa around 60,000 years ago when the climate became dryer and colder. We seek warmth, which is unsurprising since we are essentially hairless apes.
My issue with recorded global temperatures being lumped together on an annual basis and presented as a catastrophic road to hell is: I don’t think there is a global average temperature. I’m not even sure if there is a local average temperature. There are local average daytime temperatures and average nighttime temperatures for days, weeks, and possibly months of the year. The concept of a single global average temperature for a whole year seems far-fetched to me.
A global average temperature is a complete red-herring.
Helping the clean water impoverished millions is a relatively cheap and easy task compared with “fighting” climate change, a fight only nature will win.
Redge, I seem to recall reading that for the cost of the ‘Kyoto Protocol’, we could provide every man, woman and child on the planet access to clean drinking water and a roof over their heads.
The obvious problem with that of course, is that within the space of one generation we would +10’s of millions of more people using up Gaia’s finite resources and that would never do.
Andy in his comment nailed it:
There is no money to be made providing clean water
In any case, simply giving it away is not going to do anything but make the problem worse – the folks need to ‘make’ their own water.
Air-Wells are good starts – just don’t squander the stuff by using it to cook rice and corn
Simple as planting a pile of rocks under a tree. Important hint: Do not chop the tree down first
Also: For any dead trees, plants and litter (inc Card, paper, cotton, wool, hessian, jute, coco hulls, coffee grounds, climate reports, ex-NATO office furniture etc etc) you may have, give it a decent burial under one or more Hugenkulture structures using whatever passes for dirt in your locality.
If there are any positive feedbacks inside The Climate System, those are the places to find them
Clean drinking water may be the only good environmental effort Bill Gates has supported.
BTW, the Pilgrims had a daily ration of less potent ale to ensure they had a safe drink. Germans had
less potent beer which the kids could safely drink, too.
Small beer is what it was known as in England – it’s a very low alcohol content brewed drink that is basically a way of purifying the drinking water. Eastern Europeans through to Russia and the steppes had black bread beer which was essentially the same as small beer, known as Kvass or Kvasa.
Food for thought: Since clean water is something everyone supports, you can use your knowledge &
approval of it as a way to encourage Greenies to focus on something that actually does some good.
It’s also a way of letting them know you actually do research & think for yourself & aren’t a right
wing “rubber-stamper” who can’t wait to pave Yellowstone!
“Walk toward the fire. Don’t worry about what they call you.All those things are said against you because they want to stop you in your tracks. But if you keep going, you’re sending a message to people who are rooting for you, who are agreeing with you. The message is that they can do it, too.” – Andrew Breitbart
From a humanitarian point of view I sympathize with the call to provide clean water to the poor. Doing so instead of the economy-crushing net zero nonsense would obviously be a better waste of money.
You object no doubt that I still call it a waste of money. But unless corrupt, socialist kleptocracies are rooted out of the third world, it’s probably not even possible to get enough wells, pumps, and waste treatment systems installed. It would be like bailing the ocean with a sieve. Or handing out hundred dollar bills to grandmas in a gang-infested neighborhood.
The scumbags who run the basketcase countries (Trump had a more colorful adjective of a more scatalogical nature) do not care in the least about their poor. They will never permit money to enter their turf without taking a giant cut.
Empowering those thugs may do more harm to the poor than leaving them alone. I think we already know that colonialism isn’t a perfect solution either. Certainly Bush-Clinton-Bush-Obama nation-building is also a discredited approach.
You object no doubt that I still call it a waste of money.
Not at all. I’m prepared to listen to others’ points of view just in case I’m wrong, and I’m always up for a little education.
You have a point, look at how little that was achieved by LiveAid etc
I think the efforts of One Water etc are targetting small groups of people rather than giving the money to some anonymous official to line his own pocket.
It’s interesting that none of our resident greens has agreed or disagreed with my original comment on this thread.
Dennis
May 30, 2022 10:17 pm
Does anybody have reliable information regarding the average wind turbine operating life and replacement, complete installation including foundations or remove and replace generator unit?
You will have a hard time getting to the truth about the hidden iceberg of running costs. In the seas off the U.K. coast there is an almost constant and carefully unreported programme of replacing damaged cabling, necessitating the use of highly expensive rigs to haul up, cut out damaged runs of cabling, rejoin and relay said cabling. The workmen also say that even relatively new turbine masts develop slight leans requiring realignment or sometimes replacement.
Your chances of getting to the truth about the massive waste of materials and probably epic costs of maintaining offshore turbine money farming are probably well south of zero.
“it is clear that the future rates for offshore WTs are generally higher than for onshore WTs and that this applies to all sub assemblies. Electric control system, generator, blades and hub, and pitch systems all experience high failure rates for both populations and their average failure rate is higher for offshore than onshore. Structure and gearbox follow the same pattern”
“When individual sub assembly data are combined the offshore WT failure rate is roughly three times the weighted average onshore WT failure rate.”
“the stoptime – the duration a turbine does not generate power – are higher in almost every stoptime factor for offshore wind”
‘Wind turbine reliability data review and impacts on levelised cost of energy’
The lifespan was supposed to be 25 years but real world observations show that most turbines will need to be replaced before that. Studies in Denmark show a life expectancy of 15-20 years (10-15 for offshore) with a 10% failure rate per year beginning at around 5 years or so. Because turnover rates for different models of turbine are so frequent, replacement after 5-10 years is impossible, leading to cannibalism of the turbines for spare parts to keep as many as possible going to the end of the wind farms productive lifetime. Because of the problems with keeping wind turbines going, I don’t see how it is possible to extend their operational life beyond 25 years.
So the real cost comparison between coal fired power stations and wind turbine installations must include at least one removal and replacement and probably two replacements during the accountable life of a power station, being 50 years, but well maintained could be much longer operational life.
Kentlfc
May 30, 2022 10:18 pm
Prof Ian Plimer on Sky News Australia’s “Outsider’s” program on Sunday morning let the cat out of the bag with regards to Net Zero in Australia. Australia is already running at Net Zero and has been for a long time. Australia should be demanding money off the UN for our CO2 sequestration. Here’s the article he wrote in The Spectator outlining his points.
Australia exceeded the Kyoto Japan Agreement on emissions reduction target and is one of the very few signatory nations that even achieved their target.
Now Australia is on track to achieve the Paris France emissions target by 2030.
And as Australian Federal Governments indicated, the economy has not been damaged, indeed right now after quickly overcoming the pandemic lockdowns and restrictions recession the economic is growing at 3.5% of GDP and the OECD recently forecast 4.1% of GDP will be achieved soon.
Chindia, with > 100x the population of Australia, is increasing coal use. So whatever Australia does
is overwhelmingly trumped by what they do. What a sad joke!
How many times is is stated round here, half in jest, that Climate Change is insanity.
As I have from the word go on here at WUWT. Initially I thought alcohol but now realise that sugar is the real villain
Thus: here is just one tiny snippet of what is causing Climate Change: Quote: Statins are particularly harmful. In one study from the University of California – San Diego, 90 percent of patients who stopped taking statin drugs reported improvement in cognitive problems in a matter of weeks. In some of the patients a diagnosis of dementia or Alzheimer’s was reversed.
How many minds are being poisoned by Lipitor and Simvastatin = among THE most profitable drugs in Big Pharma’s extensive armoury of poisons.
As A Race/Species, we really are doing things sooooo dumb as to extinguish ourselves – lured on by The Love Of Money
Just one snippet – there are plenty more. From my other ravings, you may already have a clue about what they entail and result from.
🙂
Amid their looming defeat in the Donbas, which even The New York Times and Washington Post have belatedly and reluctantly begun to acknowledge of late, the neo-Nazi Azov Battalion is still struggling to remake its image, given the Western mainstream Media had long ago admitted them as a significant “neo-Nazi threat” – as one BBC documentary bluntly described years ago.
But since the Russian invasion of Ukraine began, the US and EU public have been steadily told that Azov is merely “far right”, or simply “nationalist” in their ideology.
Or even better, the group just has far-right “roots” with images often “misunderstood” and shared “out of context”…
“Many soldiers who surrendered at a steel complex in Mariupol belong to the Azov battalion, a group with far-right roots,” The New York Times , wrote two weeks ago, following the large-scale Ukrainian surrender at Azovstal steelworks plant in Mariupol.
In the same article, we are told this is merely a false “portrayal” the Kremlin propagandists have presented.
And now, in new reporting on Monday, the UK Times assures its readers that “Azov Battalion drops neo-Nazi symbol exploited by Russian propagandists”in its headline.
Below is the Times working overtime trying to run damage control…
From the opening lines we are informed it’s really all just “Russian propaganda” and exploitation
“The Azov Battalion has removed a neo-Nazi symbol from its insignia that has helped perpetuate Russian propaganda about Ukraine being in the grip of far-right nationalism.”
Ah yes… when these fighters proudly display Nazi symbols, the real problem is Russian officials and media pointing it out: avery inconvenient truth!
But Azov upporters can now Rejoice…as the group is busy fixing the issue of all its pesky pro-Hitler, emblems and symbolisms, which have made their enlightened Liberal Western backers squirm just a bit:
“At the unveiling of a new special forces unit in Kharkiv, patches handed to soldiers did not feature the Nazi wolfsangel, a medieval German symbol that was adopted by the Nazis, and which has been used by the Azov battalion since 2014,” the Times writes further.
“Instead, the new patches feature a golden trident,”, which the same symbol used by the Ukrainian armed forces”
But the question has to be asked: “What the myriad of symbols that can’t be so easily whitewashed? What about all those tattoos?
Oh thank heavens for that, they’ve got rid of that damned wolfsangel.
Luckily the yellow trident is devoid of all German ww2 symbology, y’know apart from being the symbol of the 2nd Panzer Division, but at least it’s nothing to do with the SS, right? sarc
Where is the solar lobby group on this? This region (and camps) is the source of about 60 percent of the world’s polysilicon for silicon-based solar panels.
I replied to Mr. Krugman with the attached correction to his chart, but he hasn’t responded. Shifting this graph to the right, as he does in his little exercise reveals the truth that a warming planet increases some risks, but simultaneously reduces other risks.
Pretty funny considering Humming Birds are all over the desert Southwest of the USA
I am looking at one now in my Tucson backyard and see them all summer What a bunch of BS
I’ve ~intensively studied climate science since 1985 and published since 2002. We published the most important correct outcomes back then, in 2002: No real climate crisis, green energy is nonsense, natural cooling will happen circa 2020 causing more crop failures, food price inflation and possible famine.
For twenty years society has been submerged in a swamp of climate-and-green-energy falsehoods, wherein unscientific imbeciles are force-fed a crash diet of woke scary lies to keep them in a constant state of false alarm.
I’m getting really tired of it and so, it seems, are the greens. They’ve now concocted the Covid-19 fraud to replace the climate fraud, and it is all false too. No total death bump in Alberta or Canada to 1July2020 means no real pandemic! The latest scam is to put the World Health Organization in control of our countries – yes, the same fraudsters who brought you the needless Covid-19 lockdowns and the toxic forced “vaccines”.
The average voter is way too stupid, gullible and frightened for self-government – it’s much
too easy for wolves to stampede the sheep. After all these years, these fools deserve what they get – they can delude themselves straight to oblivion – just don’t take me with them.
I spent the last two days repairing the land yacht (Range Rover Megalodon) of a lady friend
who had a petit prang-age – sourcing and replacing body parts – managed to even match the paint! So much more real than this Kafkaesque Klimate Klown Show.
Here’s an idea: Move all the Greens to their own States and Provinces and let them introduce
themselves to exposure and starvation. All in favor say AYE!
SCIENTIFIC COMPETENCE – THE ABILITY TO CORRECTLY PREDICT October 20, 2021. Update May 12, 2022 https://correctpredictions.ca/ “The ability to correctly predict is the best objective measure of scientific and technical competence.” Our scientific predictions on both Climate and Covid are infinitely more accurate than the mainstream narratives, which have been false and baselessly alarmist to date.
jeff corbin
June 1, 2022 8:52 am
With all the doomy predictions that were floated around on WUWT 10 years ago about sunspots disappearing in SC 25 and the sun diving into deep slumber…. well it didn’t happen. So far zero days without sunspots in 2022. I know WUWT that has morphed into a political blog but what is up with solar cycle 25 and next Grand Solar Minimum. I am also aware that predictions often are motivated by trendy and wishful thinking and are soon forgotten unless they pan out and people get book deals….then is is celebration time. Well I am booing those failed predictions, which I am sure will make me hugely popular LOL.
SC 23 in 2008 and “the pause” 2011, forced radical environmentalist propagandists to shift the moniker from Global Warming to climate change. The climate skeptic’s hope that a major down turn of the sun with another mini-ice age closely following would discredit the global warming trojan horse entirely. But who could hope for such a massive natural disaster as a political solution? Now global warming has morphed into an unbeatable climate change hermeneutical phalanx for skewering all who stand in the way. The moon could hurl itself in the sun and the sun become vastly polka dotted but the climate change propaganda machine would say it was due to man consuming the cosmos. Who needs empty ideology in either direction…. no one.
Stanford’s WSO data leaves no illusions. Solar dipoles are weakening. This is most clearly seen in the solar equatorial dipole. Counting weak, inactive spots won’t help. One active spot appears, followed by several weeks of weak spots.
Thank you for a sound scientific reply. The prediction 10 years ago was few or no sunspots. Obviously, that prediction did not pan out. Yet the solar wind’s magnetic field confirms an observable weakening trend seen since SC 23 remains. SC 24 minimum had a pretty good cosmic radiation peak but SC 25 had a high plateau which could have accounted for much of the “Extreme ” weather that climate changers have grabbed onto. It would be nice to see the Oulu Neutron date 9/2021 to 5/2022 to see if there was a steep decline…but I can go look that up.
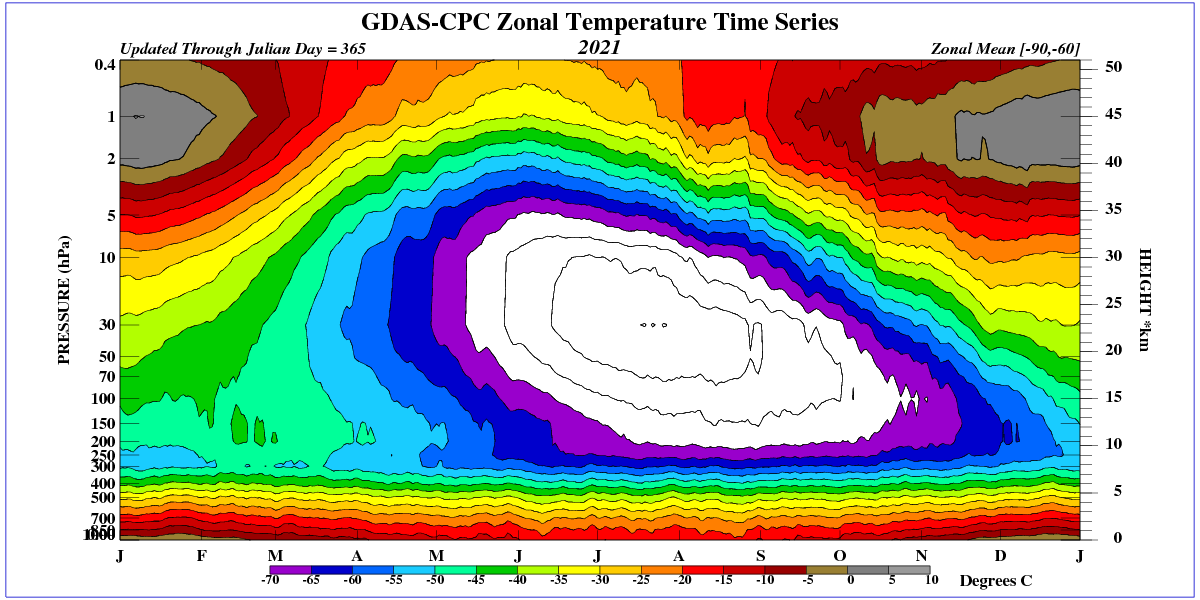
Look at temperature anomalies in the Southern Hemisphere relative to the 1979-2000 average.
niceguy
June 4, 2022 8:34 pm
Why do US schools spend ime doing active shooter drill? Has that ever helped?
Is there any equivalent anywhere?
(Pupils don’t do active fire drills anywhere AFAIK.)
hmmm… quiet before the storm?
I keep hearing and reading that there is nothing the President can do to lower the price of gasoline. Not true? The President could lower the price of gasoline by 25-30 cents per gallon by waiving the summer gasoline mandate.
The president could lower gas prices by $2.00 simply by putting things back the way they were the day before he took office.
TonyL has it right. Going back to the Trump oil and gas policies would alleviate most of our problems. The supply chain and other problems that are contributing will eventually work themselves out, but if gasoline prices stay high the economy is going to suffer enormously.
The U.S. needs to change policy on oil and gas if we are to be economically viable. We need an all-out effort to find and pump as much oil and gas as possible as quickly as possible using all our tools.
This will not only help with inflation in the U.S. but also in the entire world because the U.S. can increase the world supply substantially and this will lower prices for everyone.
Of course, Joe Biden has no intention of pumping more oil and gas. He is going to do just the opposite and our economy is going to be entering an official recession in the near future as a consequence.
Economic activity is slowing down because gasoline prices are taking everyone’s extra cash out of their pockets so they can’t spend that extra cash at an eating establishment or the local bar or the local flower shop, and those businesses experience less cash flow and so have to lay off some of their workers, and on and on and on.
All because Joe Biden has jacked up gasoline prices outrageously and unnecessarily.
Republicans better do something to fix this problem if they are given the majority. Voters need to help the Republicans to stop Biden’s insane Climate Change plans for the United States.
Everything Biden does harms the United States. He is a disaster for our country and for the world. January 2023 cannot come soon enough.
Simply study Reaganomics and the 1980s. Been there done that. Simply drill for more oil it is literally that simple.
I remember those days, Squashed the Carter administration’s energy crisis like a bug.
Remember those gas lines?
The lines took so long that I used to get out and do minor maintenance on my IH Scout like making sure the bolts were all tight on my roof rack and washing the windows and side-view mirrors.
Get rid of the highly subsidized ethanol-from-corn boondoggle.
Provide federal cash backs for gasoline vehicles that get more than 35 mpg
NOOOOOOOO! Cars that get more than 35 mpg still drive on OUR roads paid for by gas taxes.
Lets just get rid of all gas and diesel taxes and require a fee for every private vehicle based on GVW and miles driven per year and only for used to build and maintain roads, not bike paths or to subsidize public transportation.
The switch has been turned off with out making sure we have set up the room for our blind public to make its way into the future. He (they) want green at any cost and don’t care what happens if we turn off the other energy systems right now. This is madness and this is the NWO plan to make us all poor and dependent so they can take over as the new saviors of the planet and sit in our 200ft square apts and wonder that the heck happened JUST SAY NO
Something to discuss..
Let me explain:
x-axis: distance from the sun
y-axis: temperature
blue line: theoretical temperature of a black body at the respective distance
blue dots: surface temperatures of planets & some moons, starting with Mercury to the left (taken from Wikipedia, not necessarilly all too accurate)
light blue dots: temperature of Venus at 1 bar pressure, and temperature of Jupiter & Saturn at 92 bar pressure (there is about 92bar pressure on the surface of Venus)
red line: with a feedback just doubling any forcing, that is the temperature Earth would take on if you moved it clover or further to the sun.
I thought it might be interesting.
PS. dont kill the messenger 😉
“red line: with a feedback just doubling any forcing”….so you could say double the methane forcing and get the red line ? Maybe explain that again for us picky types….
Well, it is about the nature of forcings and feedbacks. Moving Earth closer or further from the sun is forcing in the context of climate science. As the chart shows planets mostly have the temperature they are “forced” to have.
Climate science however claims there were powerful feedbacks enhancing these forcings. Even if feedbacks just doubled the effect of forcings, then Earth would warm or heat according to the red line.
oops ..”warm or cool”
Was this calculated, or measured?
Venus: measured
Jupiter: partially measured/calculated
Saturn: largely calculated
As we can see Venus is just a little bit warmer than a black body there, despite its atmosphere consisting almost entirely of CO2. That is about 950.000ppm! Both Jupiter and Saturn on the other side, at the respective 92 bar pressure levels, are about equally warmer than a black body as the surface of Venus is. In other words, it is not so much about what the atmosphere consists of, but rather how strong it is.
https://greenhousedefect.com/about-the-physical-impossibility-of-feedbacks
Feedbacks are a conditio sine qua non for the climate crisis narrative. Apparently this “need” is also their origin, rather than physical evidence. Sticking to the latter, we are rather left wondering what this unscientific non-sense is all about. Both on the micro level, based on line by line calculations, as on the macro level as presented here, the evidence not just does not support the claim of significant positive feedbacks, but rather speaks strictly against it. On top of that we can fairly well see not just what went wrong, but also why it did.
IP said: “As we can see Venus is just a little bit warmer than a black body there”
Venus’ blackbody temperature is sblaw(2600 W/m2 * (1-0.77) / 4) = 227 K. It’s surface temperature is 737 K. It is way warmer than a blackbody there. And that is a massive 737 – 227 = 510 K or sblaw(737 K) – sblaw(227 K) = 16579 W/m2 greenhouse effect. Contrast that with Earth’s GHE of 33 K or 155 W/m2.
This “blackbody temperature” used in “climate science” is nonsense. There is no blackbody with an albedo. By definition, a blackbody does not reflect light. The actual blackbody temperature of Venus is then simply ((2600/4) / 5.67e-7)^0.25 = 327K.
For the same reason that of Earth is 278.7K ( =(342/5.67e-8)^0.25 )
Celestial bodies tend to take on this true blackbody temperature, as reflectivity in SW and LW tend to cancel each other. “Climate science” however notoriously denies LW reflectivity so that they can claim anything would emit like a blackbody, while reflecting a lot of SW radiation. This produces erroneous GHEs.
The blackbody temperature is the hypothetical temperature a celestial body would have if it were truly a blackbody in steady-state emitting at the same rate it is actually absorbing. For Venus that is 227 K. It is not a statement that the celestial body is a blackbody. Anyway, NASA confirms this figure on their Venus fact sheet page.
The GHE is defined as the actual near surface temperature minus the SB temperature of the absorbed solar flux. By definition Venus’ GHE is 510 K whereas Earth’s is 33 K.
It is okay to analyze the difference between the actual near surface temperature and SB temperature of the TOA solar flux. But you should probably use a different term other than GHE since that term is already reserved for the definition above.
Another concept worth discussing is the actual near surface temperature minus the SB temperature of the received solar flux near the surface. Based on that definition the hypothetical increase would be 288 K – sblaw(185 W/m2) = 49 K above what it receives from the Sun. But I don’t go around claiming this is the GHE even though it is probably more representative of the net effect at the surface because hijacking an already established definitions like that only leads to confusion in discussions.
Again, this is wrong. The SB law does not lie, nor does the formula. And if you know it, you need no “fact sheet”.
As with Venus:
(650 / 5.67e-8) ^0.25 = 327.2K
(650 * (1 – 0.77) / 5.67e-8) ^0.25 = 226.6K
As with Earth:
(342 / 5.67e-8) ^0.25 = 278.7K
(342 * (1 – 0.3) / 5.67e-8) ^0.25 = 254.9K
The first is the blackbody temperature, with identical absorptivity/emissivity. One could add the term 1/1, but obviously that is pointless.
The second is “climate science” “backbody” temperature, including albedo, but ignoring emissivity.
I never said the SB law lies. In fact, I spent a considerable amount of time trying to convince a WUWT article author and commenters that the SB law is correct a few weeks ago.
Anyway, Venus does not absorb 5.8e24 joules in its year. It only absorbs 1.3e24 joules. 1.3e24 joules / 460e12 m2 / 19414080 s = 150 W/m2. So at steady-state that is sblaw(150 W/m2) = 227 K. By definition that is its blackbody temperature. NASA confirms the 227 K figure here. It has nothing to do with “climate science”.
Similarly, Earth does not absorb 5.5e24 joules in a year. It only absorbs 3.9e24 joules. 3.9e24 joules / 510e12 m2 / 31557600 s = 241 W/m2. So at stead-state that is sblaw(241 W/m2) = 255 K. By definition that is its blackbody temperature. NASA confirms the 255 K figure here (technically 254 K).
Again, this is not a statement that either Venus or Earth are blackbodies. It is statement of the blackbody temperature given a specific amount of energy being absorbed.
And again, a blackbody does not reflect light. So a blackbody at the position of Venus will absorb ~650W/m2, and ~342W/m2 on the position of Earth. A grey body will absorb less, but also emit less.
And it is not an accedemic discussion, rather is highly relevant and a significant error in “climate science”. Here is the example of water showing its reflectivity both over a wide range – from SW to LW.
It turns out water has a higher reflectivity in the LW than in the SW range. It is 0.066 in the SW, but 0.0908 in the LW range, both hemispheric and spectral.
((1-0.066)/(1-0.092)*342 / 5.67e-8) ^0.25 = 280,7K
It turns out a water surface would become even warmer than a blackbody, despite absorbing less radiation. And it demonstrates how futile and wrong it is, to only consider SW reflectivity.
Neither Venus nor Earth are blackbodies. And this has nothing to do with climate science. The blackbody temperature of a celestial body is defined as sblaw(ASR). It is a definition. It is neither right nor wrong. It is what it is. If your primary grievance here is the name then lobby science to adopt a new name for that concept. What you definitely should not do is use the already established name for the sblaw(TSI/4) concept because it is going to lead to confusion. Don’t hear what I’m not saying. I’m not saying sblaw(TSI/4) is not an interesting concept worthy of discussion. It is interesting. It should be discussed. But so should sblaw(ASR).
And I am saying this definition is causing the confusion.
There is the excellent example of the Moon. It has an average maximum temperature of 394K at the equator and albedo of ~0.12. Now we can calculate..
(342 * 4 / 5.67e-8) ^0.25 = 394.1K
or
(342 *4 * (1 – 0.12) / 5.67e-8) ^0.25 = 381.7K
Sticking with the “blackbody temperature” as climate science defines it, the result is ~12K too cold. So the moon then has a “GHE”, which it cannot have.
The true blackbody temperature however is spot on.
Your calculations have a math error both for the ASR and TSI/4 case. Additionally the Moon is not at 394 K everywhere and all of the time. That is not the Moon’s average temperature.
Anyway, the Moon’s blackbody temperature is (1360 / 4 * (1-0.11) / 5.67e-8) ^ 0.25 = 270 K. That is confirmed by NASA here.
The Moon does not have a near surface temperature since it doesn’t have an atmosphere so it technically does not have a GHE by definition. However, you could use the actual surface temperature of 200 K [Williams et al. 2017] as a proxy. The Moon’s blackbody departure with this method is thus 200 – 270 = -70 K. In other words the Moon is 70 K cooler than its blackbody temperature would suggest. This is due to 1) not having an atmosphere and 2) being a significant inhomogeneous radiator.
Earth blackbody delta = +33 K
Venus blackbody delta = +510 K
Moon blackbody delta = -70 K
I order to avoid the averaging issue I did take the maximum temperatures. So please do not try to go this way to dudge the argument. Sorting this out, everything I said above holds true. Your claim over an “error” is futile. Nor could you even explain what that “error” would be.
Btw. pls do not say “confirmed by NASA”. They are hardly an independent source related to “consensus climate science”.
The error is the multiplication of 342 by 4. That is none other than TSI. The Moon neither absorbs nor receives TSI because the Moon is not flat. The Moon is a sphere so you have to either do the full integration down the latitudes or do the divide by 4 shortcut of the TSI to get the spatial flux value. You can’t just use the TSI directly (or TSI/4 * 4 like what you show).
Again, this has nothing to do with climate science. And NASA is only plugging in the ASR flux into the SB law. If NASA is wrong about these figures then it is because the SB law is wrong; not because they are or aren’t independent. For the record…both NASA and I think the SB law is right and nobody has found any significant errors with their Goddard Space Flight Center’s fact sheets.
With maximum temperatures the sun will be in the zenith, thereby radiation 342×4 onto the respective spot at the equator. Should not be hard to understand.
So now we’re doing all of the calculations based on the maximum temperature and zenith flux? Going that route gives 328 K – sblaw(342 * 4 * (1-0.3)) = -33 K or 328 K – sblaw(342 * 4) = -66 K as opposed to +33 K.
No. Stop playing stupid. Discussion ends..
The graphics shows how the thickness of the troposphere affects temperature at different latitudes on Earth. There is a constant vertical temperature gradient in the troposphere. The troposphere is not present on planets where the pressure is not significantly higher than 100 hPa.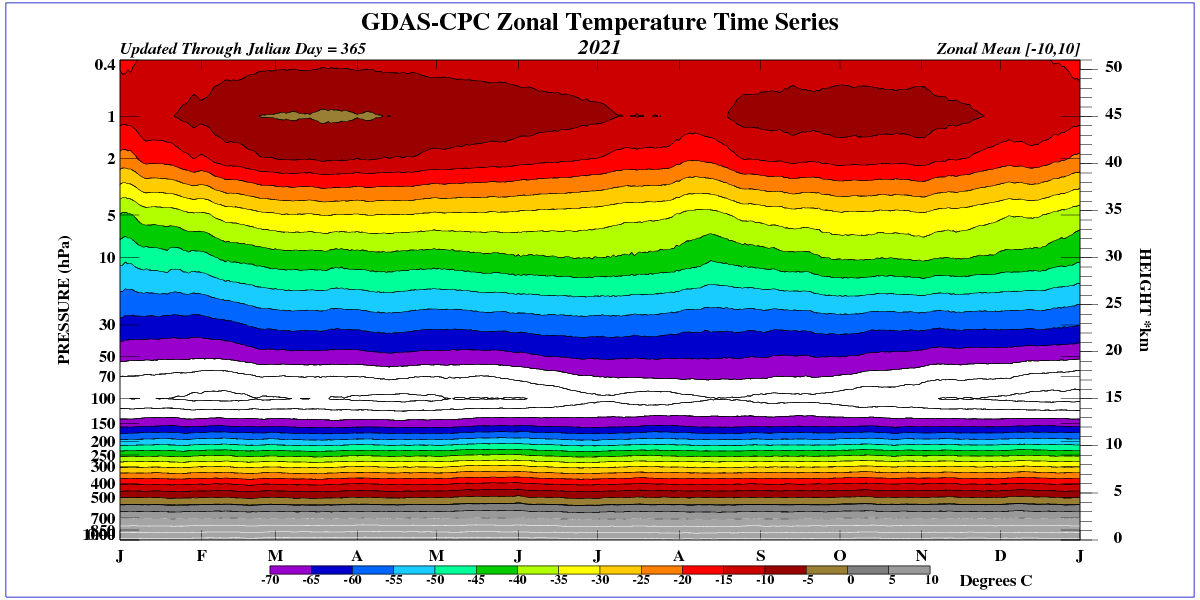
https://www.nature.com/articles/ngeo2020
The question is this: does an increase in CO2 raise the height of the tropopause (like an increase in water vapor) and by how much? Does anyone know?
The observed temperature of Venus at 1 bar is not much higher than that of Earth at 1 bar, despite the completely different composition of the atmosphere.

The only “reason” gas giants don’t have massive “GHEs”, is that we arbitrarilly define their surface to be at 1 bar pressure level.
A pressure of 1 bar occurs on Venus at an altitude of about 49.5 km. At an altitude of 54 km, the temperature is degrees 293 K=20 C and increases downward in proportion to the pressure.
1 bar pressure level is rather at 50km altitude, and the temperature there about 330-340K.
I follow Dr. Roy Spencer and the satellite all-Earth temperature data. This is known as the UAH data set.
Temperature series are TLT – temperature lower troposphere.
TMT – temperature mid-troposphere.
Tropopause
Lower Stratosphere
Last month, all except TMT were updated as usual.
Almost June now, and TMT still has not updated.
Anybody know if there is trouble with UAH, Dr. Spencer or TMT.
Or was this just a one-time glitch?
The most telling of the UAH Charts is the S Pole. Chart out each month and you will see there has been no warming since the start of the data set. Antarctica is a natural control for isolating the impact of CO2 on temperature.
May’s UAH temp’s in now — +.17C for globe. Meh.
5/30/2022 Non-Climate Scientist Forecast. The extended La Nina will allow for excess heat to accumulate in the Pacific Ocean. This will result in an unusually strong El Nino and a temperature spike that will likely exceed 1998 and 2006. CO2 has nothing to do with the warming and everything to do what the clouds over the oceans…which La Ninas reduce.
Why can’t it be both along with other known and unknown factors besides?
I notice that the ENSO meter (alongside the comments) has just gone up a fraction , so maybe the La Nina is about to end and a (land) warming El Nino will appear . Sitting here in England, burning electricity and gas i can ill afford , icy rain outside , I can only hope that you are correct.
But the CET is +2.6 C above the average for May (a few days ago) so you must just be imagining the cold. Announcement of warmest May ever coming tomorrow.
“Announcement of warmest May ever coming tomorrow.”
Absolutely not. Current May CET upto 30th is 13.1°C, 2.0 above the 1961-1990 average. In the top 10% of May CET figures, but 2°C below the record from 1833. It’s probably going to be a bit cooler than the last two warm Mays, 2017 and 2018. Still a lot warmer than last year.
I’d just like to second that; we’ve had that icy rain hit us hard and my heating came on – for the end of May/beginning of June this is much colder than usual weather, I’ve not had the heating on at this time of year in the 20 years I’ve lived here. Brrr.
Does anyone remember: the “Moral Equivalent of War” (MEOW)? and Jimmy Carter saying that?
I wasn’t happy with how Carter managed the presidency, but at least he wasn’t a criminal.
Unfortunately, I can’t say that about Biden. He’s about as corrupt and criminal and leftwing delusional as it gets.
Never thought I’d see the day that Jimmy Carter would seem like an improvement over the current administration. True enough, it’s like the improvement of facing the guillotine instead of being burned at the stake.
This coming year 300,000 children will die, not because of climate change, but due to a lack of clean water.
Climate change doesn’t kill 300,000 children annually
Turn on the tap and instantly there is a flow of clean, parasite-free, we take water for granted.
We are so used to our abundant water, many people turn on the tap to brush their teeth and leave the tap running. We water our gardens, wash our cars, brew beer, and play in our swimming pools without acknowledging this easy access to freshwater is a luxury.
In some parts of the world, safe water is not so easy to access.
The figures make for stark reading.
According to the World Health Organisation:
·In 2017 29% of the global population lack easy access to safe, uncontaminated drinking water. Of these 2.2 billion people, 829,000, including 297,000 children under 5, died from diarrhoea alone.
Diarrhoea is mostly preventable and yet we waste billions of dollars every year “fighting” climate change, arguably a fight that has only claimed energy-poor victims. Not a single person has on their death certificate “Cause of Death: Climate Change”.
The demand for more money to fight climate change has risen inexorably to the extent we are projected to spend trillions of dollars on a non-issue, whilst the annual cost of a genuine, fixable issue providing clean, safe water is estimated at $22.6 billion.
I accept recorded temperatures are rising. I don’t accept the mild warming we are experiencing in some parts of the world will be anything but benign.
Our species was born in Africa, only migrating out of Africa around 60,000 years ago when the climate became dryer and colder. We seek warmth, which is unsurprising since we are essentially hairless apes.
My issue with recorded global temperatures being lumped together on an annual basis and presented as a catastrophic road to hell is: I don’t think there is a global average temperature. I’m not even sure if there is a local average temperature. There are local average daytime temperatures and average nighttime temperatures for days, weeks, and possibly months of the year. The concept of a single global average temperature for a whole year seems far-fetched to me.
A global average temperature is a complete red-herring.
Helping the clean water impoverished millions is a relatively cheap and easy task compared with “fighting” climate change, a fight only nature will win.
So why aren’t we doing it?
All that is needed for it to happen is a way for big corporations to become super rich providing clean water. Any ideas on how to blame CO2?
Carbonated water?
Redge, I seem to recall reading that for the cost of the ‘Kyoto Protocol’, we could provide every man, woman and child on the planet access to clean drinking water and a roof over their heads.
The obvious problem with that of course, is that within the space of one generation we would +10’s of millions of more people using up Gaia’s finite resources and that would never do.
I would not be surprised
Andy in his comment nailed it:
There is no money to be made providing clean water
In any case, simply giving it away is not going to do anything but make the problem worse – the folks need to ‘make’ their own water.
Air-Wells are good starts – just don’t squander the stuff by using it to cook rice and corn
Simple as planting a pile of rocks under a tree.
Important hint: Do not chop the tree down first
Also: For any dead trees, plants and litter (inc Card, paper, cotton, wool, hessian, jute, coco hulls, coffee grounds, climate reports, ex-NATO office furniture etc etc) you may have, give it a decent burial under one or more Hugenkulture structures using whatever passes for dirt in your locality.
If there are any positive feedbacks inside The Climate System, those are the places to find them
redge
I have donated to Water Aid previously who do all the things you outline.
Donate to WaterAid UK today – the UK’s dedicated water charity
Whilst Uk based they take international donations. I would imagine you have a similar organisation in the US?
tonyb
Me too, and I only buy One Water (I’m a Brit)
Clean drinking water may be the only good environmental effort Bill Gates has supported.
BTW, the Pilgrims had a daily ration of less potent ale to ensure they had a safe drink. Germans had
less potent beer which the kids could safely drink, too.
That’s something we can all drink to 😉
Small beer is what it was known as in England – it’s a very low alcohol content brewed drink that is basically a way of purifying the drinking water. Eastern Europeans through to Russia and the steppes had black bread beer which was essentially the same as small beer, known as Kvass or Kvasa.
Food for thought: Since clean water is something everyone supports, you can use your knowledge &
approval of it as a way to encourage Greenies to focus on something that actually does some good.
It’s also a way of letting them know you actually do research & think for yourself & aren’t a right
wing “rubber-stamper” who can’t wait to pave Yellowstone!
Thanks OMW, it’s something I’ve been banging on about for a more than a decade.
I try, but Greenies are so wed to their doomsday predictions they don’t listen
It’s next to impossible to reprogram cult members. Thanks for your post & your
efforts. It’s hard to keep your chin up when things seem pointless!
As our fine host quotes top, right-hand side:
From a humanitarian point of view I sympathize with the call to provide clean water to the poor. Doing so instead of the economy-crushing net zero nonsense would obviously be a better waste of money.
You object no doubt that I still call it a waste of money. But unless corrupt, socialist kleptocracies are rooted out of the third world, it’s probably not even possible to get enough wells, pumps, and waste treatment systems installed. It would be like bailing the ocean with a sieve. Or handing out hundred dollar bills to grandmas in a gang-infested neighborhood.
The scumbags who run the basketcase countries (Trump had a more colorful adjective of a more scatalogical nature) do not care in the least about their poor. They will never permit money to enter their turf without taking a giant cut.
Empowering those thugs may do more harm to the poor than leaving them alone. I think we already know that colonialism isn’t a perfect solution either. Certainly Bush-Clinton-Bush-Obama nation-building is also a discredited approach.
Not at all. I’m prepared to listen to others’ points of view just in case I’m wrong, and I’m always up for a little education.
You have a point, look at how little that was achieved by LiveAid etc
I think the efforts of One Water etc are targetting small groups of people rather than giving the money to some anonymous official to line his own pocket.
IMHO, we have to try.
It’s interesting that none of our resident greens has agreed or disagreed with my original comment on this thread.
Does anybody have reliable information regarding the average wind turbine operating life and replacement, complete installation including foundations or remove and replace generator unit?
You will have a hard time getting to the truth about the hidden iceberg of running costs. In the seas off the U.K. coast there is an almost constant and carefully unreported programme of replacing damaged cabling, necessitating the use of highly expensive rigs to haul up, cut out damaged runs of cabling, rejoin and relay said cabling. The workmen also say that even relatively new turbine masts develop slight leans requiring realignment or sometimes replacement.
Your chances of getting to the truth about the massive waste of materials and probably epic costs of maintaining offshore turbine money farming are probably well south of zero.
Onshore and offshore critical sub assemblies in terms of downtime
Generator onshore 24.3% offshore 33.3%
Blades & Hub 18.2% 22.2%
Gearbox 24.2% 33.3%
Drivetrain 5.2% 11.1%
“it is clear that the future rates for offshore WTs are generally higher than for onshore WTs and that this applies to all sub assemblies. Electric control system, generator, blades and hub, and pitch systems all experience high failure rates for both populations and their average failure rate is higher for offshore than onshore. Structure and gearbox follow the same pattern”
“When individual sub assembly data are combined the offshore WT failure rate is roughly three times the weighted average onshore WT failure rate.”
“the stoptime – the duration a turbine does not generate power – are higher in almost every stoptime factor for offshore wind”
‘Wind turbine reliability data review and impacts on levelised cost of energy’
https://onlinelibrary.wiley.com/doi/10.1002/we.2404
Dave .Thanks, very useful.
Wonder if anyone would buy a car in which the gear assembly needed downtime/ repair 25 per cent of time needed for use ?
It was supposed to be 25 years but expect that to be increased.
The lifespan was supposed to be 25 years but real world observations show that most turbines will need to be replaced before that. Studies in Denmark show a life expectancy of 15-20 years (10-15 for offshore) with a 10% failure rate per year beginning at around 5 years or so. Because turnover rates for different models of turbine are so frequent, replacement after 5-10 years is impossible, leading to cannibalism of the turbines for spare parts to keep as many as possible going to the end of the wind farms productive lifetime. Because of the problems with keeping wind turbines going, I don’t see how it is possible to extend their operational life beyond 25 years.
So the real cost comparison between coal fired power stations and wind turbine installations must include at least one removal and replacement and probably two replacements during the accountable life of a power station, being 50 years, but well maintained could be much longer operational life.
Prof Ian Plimer on Sky News Australia’s “Outsider’s” program on Sunday morning let the cat out of the bag with regards to Net Zero in Australia. Australia is already running at Net Zero and has been for a long time. Australia should be demanding money off the UN for our CO2 sequestration. Here’s the article he wrote in The Spectator outlining his points.
https://www.spectator.com.au/2022/05/australia-is-already-at-net-zero/
Australia exceeded the Kyoto Japan Agreement on emissions reduction target and is one of the very few signatory nations that even achieved their target.
Now Australia is on track to achieve the Paris France emissions target by 2030.
And as Australian Federal Governments indicated, the economy has not been damaged, indeed right now after quickly overcoming the pandemic lockdowns and restrictions recession the economic is growing at 3.5% of GDP and the OECD recently forecast 4.1% of GDP will be achieved soon.
Chindia, with > 100x the population of Australia, is increasing coal use. So whatever Australia does
is overwhelmingly trumped by what they do. What a sad joke!
The green luvvies don’t seem to worry about that! They’re all about “Australia being leaders….leaders in collapsing the economy!
Snowstorm in Idaho and Wyoming.
Can see why in WUWT sea ice website
Water availability is the fatal flaw in a hydrogen mega project being scrapped.
Green hydrogen megaproject in SA discontinued – pv magazine Australia (pv-magazine-australia.com)
Oz not best placed for hydrogen production. Each tonne needs 9 tonnes of water, and you cannot use sea water.
My latest nontechnical education piece for Range Magazine:
“Why we eat and breathe”
https://www.cfact.org/2022/05/22/why-we-eat-and-breathe/
Our place in the carbon cycle.
How many times is is stated round here, half in jest, that Climate Change is insanity.
As I have from the word go on here at WUWT. Initially I thought alcohol but now realise that sugar is the real villain
Thus: here is just one tiny snippet of what is causing Climate Change:
Quote: Statins are particularly harmful. In one study from the University of California – San Diego, 90 percent of patients who stopped taking statin drugs reported improvement in cognitive problems in a matter of weeks. In some of the patients a diagnosis of dementia or Alzheimer’s was reversed.
How many minds are being poisoned by Lipitor and Simvastatin = among THE most profitable drugs in Big Pharma’s extensive armoury of poisons.
As A Race/Species, we really are doing things sooooo dumb as to extinguish ourselves – lured on by The Love Of Money
Just one snippet – there are plenty more. From my other ravings, you may already have a clue about what they entail and result from.
🙂
You might like some of Zoe Harcombe’s postings.
https://twitter.com/zoeharcombe
Both radiative processes and material processes are responsible for energy budgets.
The global climate system represents the integration of solar input through matter.
This, to describe the sun’s heat transfer through the system on its way to space.
For a planetary energy budget, how “diffusive” is the system in response to available solar input.
A function of the thermal properties of the fluid system.
Diffusivity. W m−2 K−1.
An optimization problem for chaotic flows in response to spatially variable solar input.
Atmospheric circulation, ocean currents, and the hydrological cycle.
Fluid density, fluid velocity, heat diffusion, viscous dissipation.
Thermal convection and shear turbulence.
The center of gravity of the atmosphere lifted upward.
Solar input vs Work performed driving the atmospheric and oceanic circulations.
Turbulent heat transfer process and system efficiency.
Temperature and density gradients.
Diabatic and Adiabatic process.
Meridional, zonal, and vertical energy transfer through all matter.
Solar input vs Total Turbulent Flux response in the material system.
Solar input vs Energy Export.
The Biden-teleprompter controllers have committed at least $55 BILLION to Ukraine’s proxy war, to ensure Ukraine wins.
This money should be spent in the US to finance its many needs, such as closing the wide-open, just-walk-in-from-anywhere, southern border.
The Azov military forces are the backbone of the Ukraine Army.
After the surrender at Mariupol, Kiev has decided to clean up their awful public image by changing the shoulder patches on their uniforms.
Mainstream Media Praises Ukraine’s Azov Battalion For Dropping Nazi Patches From Uniform
By Tyler Durden
https://www.zerohedge.com/geopolitical/mainstream-media-praises-ukraines-azov-battalion-dropping-nazi-patches-uniform
Amid their looming defeat in the Donbas, which even The New York Times and Washington Post have belatedly and reluctantly begun to acknowledge of late, the neo-Nazi Azov Battalion is still struggling to remake its image, given the Western mainstream Media had long ago admitted them as a significant “neo-Nazi threat” – as one BBC documentary bluntly described years ago.
But since the Russian invasion of Ukraine began, the US and EU public have been steadily told that Azov is merely “far right”, or simply “nationalist” in their ideology.
Or even better, the group just has far-right “roots” with images often “misunderstood” and shared “out of context”…
“Many soldiers who surrendered at a steel complex in Mariupol belong to the Azov battalion, a group with far-right roots,” The New York Times , wrote two weeks ago, following the large-scale Ukrainian surrender at Azovstal steelworks plant in Mariupol.
In the same article, we are told this is merely a false “portrayal” the Kremlin propagandists have presented.
And now, in new reporting on Monday, the UK Times assures its readers that “Azov Battalion drops neo-Nazi symbol exploited by Russian propagandists” in its headline.
Below is the Times working overtime trying to run damage control…
From the opening lines we are informed it’s really all just “Russian propaganda” and exploitation
“The Azov Battalion has removed a neo-Nazi symbol from its insignia that has helped perpetuate Russian propaganda about Ukraine being in the grip of far-right nationalism.”
Ah yes… when these fighters proudly display Nazi symbols, the real problem is Russian officials and media pointing it out: avery inconvenient truth!
But Azov upporters can now Rejoice…as the group is busy fixing the issue of all its pesky pro-Hitler, emblems and symbolisms, which have made their enlightened Liberal Western backers squirm just a bit:
“At the unveiling of a new special forces unit in Kharkiv, patches handed to soldiers did not feature the Nazi wolfsangel, a medieval German symbol that was adopted by the Nazis, and which has been used by the Azov battalion since 2014,” the Times writes further.
“Instead, the new patches feature a golden trident,”, which the same symbol used by the Ukrainian armed forces”
But the question has to be asked: “What the myriad of symbols that can’t be so easily whitewashed?
What about all those tattoos?
OPEN THE URL TO SEE ALL THE WEIRDO TATOOs
Oh thank heavens for that, they’ve got rid of that damned wolfsangel.
Luckily the yellow trident is devoid of all German ww2 symbology, y’know apart from being the symbol of the 2nd Panzer Division, but at least it’s nothing to do with the SS, right? sarc
Bill Gates “Jumping the Shark?” Bill Gates: Next Pandemic Likely to be Caused by Climate Change – [your]NEWS (yournews.com)
Where is the solar lobby group on this? This region (and camps) is the source of about 60 percent of the world’s polysilicon for silicon-based solar panels.
Forced Labor in China’s Xinjiang Region – United States Department of State
https://www.nytimes.com/2022/05/24/opinion/climate-change-global-warming.html
I replied to Mr. Krugman with the attached correction to his chart, but he hasn’t responded. Shifting this graph to the right, as he does in his little exercise reveals the truth that a warming planet increases some risks, but simultaneously reduces other risks.
Latest climate change induced extinction scare:
Hummingbirds…
Hummingbirds could be wiped out by global warming (msn.com)
“Hummingbirds could be wiped out by global warming, warns a new study.
They will have to move north to seek cooler climes – or disappear, say scientists.”
********
By the time these climate scare (pseudo)scientists are done, there will be no life left on Earth that does not face extinction.
Pretty funny considering Humming Birds are all over the desert Southwest of the USA
I am looking at one now in my Tucson backyard and see them all summer What a bunch of BS
I’ve ~intensively studied climate science since 1985 and published since 2002. We published the most important correct outcomes back then, in 2002: No real climate crisis, green energy is nonsense, natural cooling will happen circa 2020 causing more crop failures, food price inflation and possible famine.
For twenty years society has been submerged in a swamp of climate-and-green-energy falsehoods, wherein unscientific imbeciles are force-fed a crash diet of woke scary lies to keep them in a constant state of false alarm.
I’m getting really tired of it and so, it seems, are the greens. They’ve now concocted the Covid-19 fraud to replace the climate fraud, and it is all false too. No total death bump in Alberta or Canada to 1July2020 means no real pandemic! The latest scam is to put the World Health Organization in control of our countries – yes, the same fraudsters who brought you the needless Covid-19 lockdowns and the toxic forced “vaccines”.
The average voter is way too stupid, gullible and frightened for self-government – it’s much
too easy for wolves to stampede the sheep. After all these years, these fools deserve what they get – they can delude themselves straight to oblivion – just don’t take me with them.
I spent the last two days repairing the land yacht (Range Rover Megalodon) of a lady friend
who had a petit prang-age – sourcing and replacing body parts – managed to even match the paint! So much more real than this Kafkaesque Klimate Klown Show.
Here’s an idea: Move all the Greens to their own States and Provinces and let them introduce
themselves to exposure and starvation. All in favor say AYE!
SCIENTIFIC COMPETENCE – THE ABILITY TO CORRECTLY PREDICT October 20, 2021. Update May 12, 2022
https://correctpredictions.ca/
“The ability to correctly predict is the best objective measure of scientific and technical competence.”
Our scientific predictions on both Climate and Covid are infinitely more accurate than the mainstream narratives, which have been false and baselessly alarmist to date.
With all the doomy predictions that were floated around on WUWT 10 years ago about sunspots disappearing in SC 25 and the sun diving into deep slumber…. well it didn’t happen. So far zero days without sunspots in 2022. I know WUWT that has morphed into a political blog but what is up with solar cycle 25 and next Grand Solar Minimum. I am also aware that predictions often are motivated by trendy and wishful thinking and are soon forgotten unless they pan out and people get book deals….then is is celebration time. Well I am booing those failed predictions, which I am sure will make me hugely popular LOL.
SC 23 in 2008 and “the pause” 2011, forced radical environmentalist propagandists to shift the moniker from Global Warming to climate change. The climate skeptic’s hope that a major down turn of the sun with another mini-ice age closely following would discredit the global warming trojan horse entirely. But who could hope for such a massive natural disaster as a political solution? Now global warming has morphed into an unbeatable climate change hermeneutical phalanx for skewering all who stand in the way. The moon could hurl itself in the sun and the sun become vastly polka dotted but the climate change propaganda machine would say it was due to man consuming the cosmos. Who needs empty ideology in either direction…. no one.
Stanford’s WSO data leaves no illusions. Solar dipoles are weakening. This is most clearly seen in the solar equatorial dipole. Counting weak, inactive spots won’t help. One active spot appears, followed by several weeks of weak spots.

Galactic radiation tracks the strength of the solar wind’s magnetic field and these data confirm the Stanford WSO data.
Thank you for a sound scientific reply. The prediction 10 years ago was few or no sunspots. Obviously, that prediction did not pan out. Yet the solar wind’s magnetic field confirms an observable weakening trend seen since SC 23 remains. SC 24 minimum had a pretty good cosmic radiation peak but SC 25 had a high plateau which could have accounted for much of the “Extreme ” weather that climate changers have grabbed onto. It would be nice to see the Oulu Neutron date 9/2021 to 5/2022 to see if there was a steep decline…but I can go look that up.
Solar wind strengthened in May 2022.

However, let’s look at the forecast.
The prolonged La Niña has to do with the weakening solar magnetic field. La Niña is too weak for a full ENSO cycle to occur. Slowly melting ice this year could signal major climate change.
http://www.bom.gov.au/archive/oceanography/ocean_anals/IDYOC007/IDYOC007.202205.gif
Look at temperature anomalies in the Southern Hemisphere relative to the 1979-2000 average.
Why do US schools spend ime doing active shooter drill? Has that ever helped?
Is there any equivalent anywhere?
(Pupils don’t do active fire drills anywhere AFAIK.)