From Dr. Roy Spencer’s Global Warming Blog
April 2nd, 2022 by Roy W. Spencer, Ph. D.
The Version 6.0 global average lower tropospheric temperature (LT) anomaly for March, 2022 was +0.15 deg. C, up from the February, 2022 value of -0.01 deg. C.

The linear warming trend since January, 1979 still stands at +0.13 C/decade (+0.12 C/decade over the global-averaged oceans, and +0.18 C/decade over global-averaged land).
Various regional LT departures from the 30-year (1991-2020) average for the last 15 months are:
YEAR MO GLOBE NHEM. SHEM. TROPIC USA48 ARCTIC AUST
2021 01  0.12  0.34 -0.09 -0.08  0.36  0.49 -0.52
2021 02  0.20  0.32  0.08 -0.14 -0.66  0.07 -0.27
2021 03 -0.01  0.12 -0.14 -0.29  0.59 -0.78 -0.79
2021 04 -0.05  0.05 -0.15 -0.29 -0.02  0.02  0.29
2021 05  0.08  0.14  0.03  0.06 -0.41 -0.04  0.02
2021 06 -0.01  0.30 -0.32 -0.14  1.44  0.63 -0.76
2021 07  0.20  0.33  0.07  0.13  0.58  0.43  0.80
2021 08  0.17  0.26  0.08  0.07  0.32  0.83 -0.02
2021 09  0.25  0.18  0.33  0.09  0.67  0.02  0.37
2021 10  0.37  0.46  0.27  0.33  0.84  0.63  0.06
2021 11  0.08  0.11  0.06  0.14  0.50 -0.43 -0.29
2021 12  0.21  0.27  0.15  0.03  1.62  0.01 -0.06
2022 01  0.03  0.06  0.00 -0.24 -0.13  0.68  0.09
2022 02 -0.01  0.01 -0.02 -0.24 -0.05 -0.31 -0.50
2022 03  0.15  0.27  0.02 -0.08  0.21  0.74  0.02
The full UAH Global Temperature Report, along with the LT global gridpoint anomaly image for March, 2022 should be available within the next several days here.
The global and regional monthly anomalies for the various atmospheric layers we monitor should be available in the next few days at the following locations:
Lower Troposphere: http://vortex.nsstc.uah.edu/data/msu/v6.0/tlt/uahncdc_lt_6.0.txt
Mid-Troposphere: http://vortex.nsstc.uah.edu/data/msu/v6.0/tmt/uahncdc_mt_6.0.txt
Tropopause: http://vortex.nsstc.uah.edu/data/msu/v6.0/ttp/uahncdc_tp_6.0.txt
Lower Stratosphere: http://vortex.nsstc.uah.edu/data/msu/v6.0/tls/uahncdc_ls_6.0.txt
I would be surprised if we hit the 2016 heights again from now on.
Sssshhhhh
The Adjustment Bureau relishes a challenge.
The Adjustocene Bureau will pull it out of their rectify.
the Adjustment Adjusters will then remove all history of the Adjustment, ensuring Consensus
The six year-long coolling trend could well continue for 12 more years, given the length of time bewteen Super Los Ninos of 1982, 1998 and 2016. But 2016 might also be the peak of the 40-year warm cycle, 1977-2016. In which case, Earth might not enjoy its like again for another 30 or 40 years.
Who can say?
John, you must be a tool of Satan and an Exxon paid DENIER. 🙂 Climate models CANNOT LIE!
It appears from the graph that the thirty years of warming which began in the mid-seventies ended about 2004. If a horizontal line is drawn forward from the 2004 temperature, then it appears that almost all of the yearly temperature measurements after 2004 fall below the temperature for that year. The obvious El Nino periods should not be considered in the temperature comparison. This indicates that the pause in warming is occurring, and it remains to be seen if it lasts until 2034-5 and continues the temperature pattern which probably began in the 1850’s.
Yesterday Arctic sea ice extent was higher than in the seven preceding years on that date.
That’s what we were told after 1998 as well. With a planetary energy imbalance over +0.8 W/m2 [1] and OHC hitting new records [2] it is all but guaranteed that the UAH TLT anomaly will go higher than 2016 likely within 10 years.
Give me a break with your energy imbalance.
From your [2]..
”The increased concentration of greenhouse gases in the atmosphere from human activities traps heat within the climate system and increases ocean heat content (OHC).”
And the hypothesis becomes the fact by declaration.
Who’s “we”? The AMO had just went positive in the mid 90s so we were virtually guaranteed another 30 years of relative warmth. That could be ending soon and the PDO may also get into a longer negative phase.
It appears these ocean cycles reduce clouds allowing in more solar energy. There’s your “energy imbalance”. No enhanced greenhouse effect required.
Ocean surface pollution by oil, surfactant and (nutrient pollution fed) oleaginous phytoplankton will reduce wave breaking and thus salt aerosol CCNs, lower ocean albedo and so increase surface warming. Both reduce cloud cover.
JF
For nearly 40 years you guys have been pushing the CO2 as a control knob narrative and all I have seen is prosperity for humanity along with the same g0d d@amn winters. Your theory is that my winters will slightly warm…I CANT TELL. I am getting closer to becoming a climate refugee.
” Your theory is that my winters will slightly warm… ”
… I’m pleased to confirm. But the price is not zero:
https://wattsupwiththat.com/2022/04/03/uah-global-temperature-update-for-march-2022-0-15-deg-c/#comment-3491126
Btw: no idea where you live, but for example, no one tells anywhere that North America is warming. CONUS’ winter temperatures at night are getting colder and colder since years.
You’re hanging your hat on a one month change?
Are you really that ignorant?
What for a nonsense are you telling here?
Which month are you speaking about?
Where the heck were I speaking about one month?
Are you a blogbot?
Derg said: “For nearly 40 years you guys have been pushing the CO2 as a control knob narrative”
It’s actually 185 years. Pouillet is credited with first hypothesizing CO2 as a control knob in 1837.
Derg said: “Your theory is that my winters will slightly warm”
I think you have me confused with someone. I’ve not made any statements about your winters. I don’t even know where you live.
Is every biased and doom-laden guess taken by armchair pseudoscientists right?, or only he guesses you agree with?
“That’s what we were told after 1998 as well.”
I replied before reading your comment.
1998 was warmer than 2016. 2016 Pacific temperatures were exaggerated by a bogus upward adjustment of Pacific SSTs that also inflated the 2016 elNino from a pretty average one to one with pseudo spectacular amplitude. We have, in reality, been cooling since 2005.
PS said: “1998 was warmer than 2016″
No it wasn’t. 1998 was +0.35 C. 2016 was +0.39 C. You can see for yourself here.
PS said: “We have, in reality, been cooling since 2005.”
No we haven’t. The trend since 2005 is +0.21 C/decade. Compare that with the trend over the entire period of only +0.13 C/decade. Not only has it not cooled, but it has warmed at a pace higher than the pace since 1979.
How did you capture your temperature data? If you believe those numbers, and if you believe that decadal change since 2005 represents a “trend” you are a daydream believer and quite probably a homecoming queen.
BP said: “How did you capture your temperature data?”
I didn’t capture the data. UAH did. I’m just using what they provide.
BP said: “If you believe those numbers, and if you believe that decadal change since 2005 represents a “trend” you are a daydream believer and quite probably a homecoming queen.”
That +0.21 C/decade figure from 2005 to present is literally the trend. It is the output from Excel’s LINEST function. I certainly didn’t make it up while Monkee’ing around on the last train to Clarksville. It’s what the UAH data says.
What is the trend since 1988? That’s a much longer time-period. Cherry picking is fun, but basically a waste of time.
I’m not a fan of cherry-picking start dates either. The trend since 1979 is +0.13 C/decade.
The problem is that your so called energy imbalance is less than a tenth of the confidence interval on that data.
First…it’s not my energy imbalance. Second…the EEI is clearly stated as +0.87 ± 0.12 W/m2. That means the EEI is about 7x the confidence interval.
Compare that to the confidence interval on the size of the incoming and outgoing radiation.
Why would we do that? Note that Schuckmann et al. 2020 does not assess EEI via the Fin – Fout method.
I find it amazing that you think you can take a small energy imbalance figure without knowing what drives it in detail and then assume you know how it will translate to average air temperature in the next 10 years. Observed temperature changes don’t need to depend on addition of energy from outside the system. Exchange of heat from oceans to air and back are enormously more powerful.
It’s just an application of the laws of thermodynamics. When a system accumulates energy its temperature increases. That’s the specific heat formula Q = cmΔT. Or rewritten where F is the EEI flux, t is time and A is area it is ∫ ∫ F dt dA = cmΔT. Since c and m are essentially constant that means ΔT > 0 when F > 0. Note that if a phase change is involved then the enthalpy of fusion must be considered as well. Schuckmann et al. 2020 do consider the enthalpy of fusion in their analysis.
No, it’s your assumption that something that you are observing (a change in a global average temperature that measures no true thing ) is being driven by your assumed energy imbalance. You can have global average temperature go up with no energy added to the system, it’s just that you’re too ignorant to realize what you’re measuring with global average temperature tells you nothing about the energy in the system.
“Since c and m are essentially constant “
bdgwx uses a lot of formulas he’s never actually studied.
Q = cmΔT
c is specific heat.
Specific heat for the atmosphere is dependent on both pressure and absolute humidity. C is *not* constant. And mass is also dependent on pressure and absolute humidity. Mass is not constant.
This also means F is not just a time and area integral.
It’s not an assumption. It’s an observation. And measuring temperature does tell you about the energy in the system. The laws of thermodynamics say so. Literally Q=cmΔT.
Temperature depends on humidity in the atmosphere and energy is dependant on both these.
If humidity is high = relative temperature low
If humidity is low = relative temperature high
A thunderstorm cools the atmosphere significantly during a hot day because the rainfall causes very high humidity.
There is a lot more energy in the atmosphere at 20c with 98% humidity than 29c with 35% humidity.
A record high temperature can occur not from more energy in the location, but less humidity. Record high temperatures can also be prevented by having higher humidity.
Temperatures only are actually a crude way of estimating energy levels and are only accurate when humidity is taken into account equally.
Temperature depends on a lot of things. And there are lot of thermodynamic relationships we could discuss. Scientists are fully aware of this.
“Temperature depends on a lot of things.”
Exactly. So does energy.
TG said: “Exactly. So does energy.”
I know. That’s what I keep try to telling people on here, but it seems like a daily exercise in trying to convince people that CO2 is not the only thing that modulates energy flows into and out of the atmosphere. Maybe you can help me out and remind people of this. Now that I think of it…haven’t I had to explain this to you before?
If CO2 is not the only modulating factor then why is it the only one receiving any attention? It must obviously be a minor factor or it couldn’t be overridden in such a fashion as to cause a pause in temperature increase. Where are those overriding factors in the climate models? What are they? Where are they acting? If they are cooling factors shouldn’t we be focusing on how to increase them?
There are *lots* of things that affect temperatures on the surface and in the atmosphere. Focusing on CO2 as the only control knob, or even an important one, risks getting things catastrophically wrong. We could be *causing* our own demise instead of protecting against it. We could even be starting WWIII as poorer nations rebel against the “elites” trying to prevent them from increasing their standard of living using their own cheaper, highly effective resources.
I am very much of the “don’t tinker with Mother Nature” philosophy. None of the evidence leads to a conclusion that the Earth is going to turn into a cinder in ten years (always ten years from *now*, why is that? That ninth year never seems to get here let alone year ten!). All I see is a multitude of natural cycles that introduce significant natural variation over the years, centuries, and milleniums. The climate scientists can’t even describe these natural cycles let alone model them or include them in their climate models.
A lot of *wow* is being made over the average temp going up a couple of degrees. if that causes the max temps in Kansas to up from 100F to 102F then color me bored. (of course max temps here seem to be going down – yawn). If min temps go up from 0F to 2F then, again, color me bored. Neither will affect life here in any manner at all. My ancestors here made it through the 1800’s without being wiped out by temps. Same for the 20’s and 30’s, they didn’t burn to death from temps higher than they are today. They lived through the floods of the 50’s and 70’s.
Nor am I convinced of the energy flow analyses being done. Most of them assume IR gets sent up from the earth but gets absorbed by CO2 and re-emitted back toward the earth where it remains forever thus raising the temp of the earth. Why doesn’t the downward IR get absorbed and re-emitted back toward space? Hot air rises so why doesn’t heated CO2 rise away from the earth and either emit it energy or lose it as latent heat? You keep using the equation of Q = cmΔT without realizing that c and m are functions and not constants. How do the CGM’s handle this? Since they don’t do clouds very well it is doubtful that they handle energy very well since clouds have a big impact on the energy in the atmosphere, both in location and magnitude.
I have no buy-in into convincing anyone of anything other than showing that seeing that CO2 is the control knob we need to worry about is just plain not supported by the evidence or the climate scientists that ignore measurement uncertainty.
You wrote: “I know. That’s what I keep try to telling people on here”
No you have not. Your reasoning is constantly self contradictory. I have laid out your quotes and so has everyone who’s responded to you.
Only temperature and water vapor needed.
http://hyperphysics.phy-astr.gsu.edu/hbase/Kinetic/relhum.html
“Scientists are fully aware of this.”
But evidently, you are not. I base on your statements. You say stuff, you contradict stuff and then you make a general appeal to other authorities “scientists…” claiming to speak for them as proof of your meandering scattered and mindless statements.
There is no use in arguing with you… perhaps you’re over your head and don’t yet realize it.
Right… plus 1~
which is why temperature goes way up when there is drought… the relatively dry again has much less heat capacity than moist air.
So, the alarmists have it backwards when we have a hot spell, they say, “CO2 done it.”
c is a function of pressure and absolute humidity at the point being measured in the atmosphere. Mass is a function of pressure and absolute humidity at the point being measured in the atmosphere.
c is not a constant. c is a function. c(p,h). Same for mass. m is not a constant. It too is a function, m(p,h).
That means that Q is a function as well. Q(p,h).
Thus ΔT = Q/[c(p,h)m(p,h)]
It’s not a simple calculation for a moving target like the atmosphere.
How much has c and m changed for the UAH TLT layer since 1979?
You just don’t get it. c and m change second to second in time, mm by mm in horizontal distance, and mm by mm in vertical distance.
They are *NOT* constant. That is only a simplifying assumption used by the CAGW scientists in their models because they can’t handle this any better than they can clouds. So they just parameterize them (i.e. make them constants) the same way they do clouds in order to help get the answer they are looking for.
Do you even know what a steam table is?
I’ll ask again…how much has c and m changed for the UAH TLT layer since 1979?
I told you. They are *NOT* constant. They are time and space functions. How much have clouds changed where you live since 1979? They are time and space functions as well. Are *they* constant?
I didn’t ask if they were constant. I asked you how much they have changed. Do you know the answer or not? Don’t deflect. Don’t divert. If you don’t answer the question I will. But because I already researched this before you even started challenging it I know you aren’t going to like the answer. That’s why I chose my words carefully and said “essentially constant” as opposed to just “constant”.
You got your answer. They are CONSTANTLY CHANGING. Pressure changes as you go up in/down in elevation. Pressure changes as weather fronts move through. Absolute humidity changes as you change elevation and as weather fronts move through. The question of “how much” they have changed over long periods of time is irrelevant.
You are trying to rationalize your claim that specific heat and mass in the atmosphere are constants. They aren’t constants, not even close. It truly is that simple.
Essentially constant? What in Pete’s name does that mean? I assure you that the specific heat of the atmosphere on top of Pikes Peak is vastly different than that of the atmosphere at Galveston, TX. So is the mass of a parcel of atmosphere. That means there will be a significant difference in the amount of energy contained in a parcel of air at each point – meaning the temperatures at each point simply can’t tell you what Q is at each location.
Q = c(p,h) * m(p,h) * ΔT
If you think people are going to buy into your claim that the air pressure at Pikes Peak and Galveston are *ESSENTIALLY* the same you are going to be sadly disappointed. Every airplane pilot in the world will have a good laugh at your expense.
TG said: “If you think people are going to buy into your claim that the air pressure at Pikes Peak and Galveston are *ESSENTIALLY* the same you are going to be sadly disappointed.”
Strawman. I never said the air pressure at Pikes Peak and Galveston are essentially the same. You and you alone said it. Don’t expect me to defend your statements especially when they aren’t true. And you know exactly what I mean by essentially constant. You know this because by now you researched just how much c and m in the UAH TLT layer has changed since 1979 and you know it’s not significant.
You said: ““Since c and m are essentially constant “”
Since c and m both dependent on pressure then how can c and m be essentially constant if the pressure isn’t constant?
Again, c and m are space and time functions. They are not constants. Asking if they have changed over time has no answer other than they *always* change over time!
You are still trying to rationalize away your claim that they are “essentially” constant. They aren’t. They are functions.
Trust me, the pressure, and therefore the specific heat at the edge of the atmosphere is *not* the same as the pressure at the bottom of the atmosphere. Therefore c and m are not even “essentially” constant!
TG said: “You are still trying to rationalize away your claim that they are “essentially” constant. They aren’t.”
The UAH TLT pressure hasn’t changed that much. And even big changes in pressure result in only small changes in specific heat capacity. c is essentially constant. It just doesn’t change that much in the UAH TLT layer.
TG said: “Trust me, the pressure, and therefore the specific heat at the edge of the atmosphere is *not* the same as the pressure at the bottom of the atmosphere.”
I never said the specific heat capacity at the edge of the atmosphere was the same as the bottom of the atmosphere. What I said is that c and m are essentially constant in the UAH TLT layer since 1979. They just haven’t changed that much.
Get some basic atmosphere knowledge PDQ.
I’m going to ask you the same the question I asked Tim Gorman. TG declined to answer. Maybe you know the answer. How much has c and m changed in the UAH TLT layer since 1979?
Why did you ignore what he told you?
This is an argumentative fallacy. It is similar to “when did you stop beating your wife”.
You wrote: “How much has c and m changed in the UAH TLT layer since 1979?”
Your question is wrong…
mario lento: “Your question is wrong…”
First…I’m not sure how it could even possible for a question to be wrong.
Second…I suspect the resistance to answering it is because the challengers have now researched the topic and concluded that the mass and specific heat capacity of the UAH TLT has not changed much since 1979.
“I suspect the resistance to answering…”
That you can’t understand the answers to your questions says more about your lack of comprehension than any lack of answers.
mario lento: “That you can’t understand the answers to your questions says more about your lack of comprehension than any lack of answers.”
No one has answered the question of how much the specific heat capacity (c) and mass (m) has changed in the UAH TLT layer since 1979. Remember c is in units of j.kg-1.K-1 and m is kg. No figures in those units have been posted as of the time of my post now.
The question is wrong because of it’s underlying assumptions. You are assuming c & m are constants and are then asking how the constants have changed. They are *NOT* constants this your question is wrong.
What does c(p,h) and m(p,h) mean to you? That c and m are *not* dependent values? That pressure and humidity are constants?
The values you are asking about vary all the time. The mass of a given volume of air varies based on the pressure it is under and the mix of gases it contains which then determines the specific heat value for the volume.
More importantly, UAH is a metric that is calculated from a different base than temperature.
You need to ask this question of the people who do the calculations if they even apply.
JG said: “The values you are asking about vary all the time.”
How much does the mass of the UAH TLT layer vary?
How much does the specific heat capacity of the UAH TLT layer vary?
Do you not understand that water vapor has a large effect on these items. Water vapor changes moment to moment. What you are asking for is what is the mathematical function that describes the variations.
Sorry, dude, that’s beyond my ken.
If it is beyond your ken and you don’t know how much the specific heat capacity and mass of the UAH TLT has changed since 1979 then why are you so insistent that they have changed significantly?
How many times and how many people need to tell you that “c” and “m” of a given volume of air is constantly changing through time.
If UAH has used an average, that is up to them. You need to ask them why they have done so.
JG said: “How many times and how many people need to tell you that “c” and “m” of a given volume of air is constantly changing through time.”
Why not just tell me how much the specific heat capacity and the mass of the troposphere has changed since 1979? If you want to convince me that c and m are not essentially constant then the best way to do it is to say c changed by X j.kg-1.K-1 and m changed by Y kg. If you can’t or won’t do that then I don’t have any choice but to continue to align my position on the matter in accordance with what is already available and which says that c and m have been essentially constant since 1979. It’s that simple.
You keep asking “how much has the constants c &m changed”?
The answer is that they are not constants. For some reason you can’t seem to comprehend that. That is YOUR problem, not ours.
TG said: “The answer is that they are not constants. For some reason you can’t seem to comprehend that. That is YOUR problem, not ours.”
I’m not asking if they are constant. I’m asking how much they changed. I’m asking because you are fervently defending a claim that they have changed significantly since 1979. At this point I have no choice but to dismiss any suggestion that they’ve changed significantly due to lack any attempt whatsoever to show that they have.
The tropopause can exist anywhere between 70 hPa (≈18 km) and 400 hPa (≈6 km), and it is therefore not convenient to use a constant pressure level to describe the tropopause.
It varies believe or not. The amount of water vapor varies which changes the specific heat value.
I asked you once before if you had ever used steam tables. You didn’t answer. It’s obvious you haven’t from your comments.
I have used stream tables. I’ve used specific heat capacity tables. I’ve used all kinds of tables. I even did so before I said the specific heat capacity in the UAH TLT layer is essentially constant. That’s how I know that it is essentially constant. I’ll turn the question around on you. Did you ever both to consult these tables prior to lecturing me about it?
You need to explain your concern as it applies to UAH.
One of the problems with GHG is that it includes a water vapor increase as CO2 increases. That hasn’t occurred for some reason.
Additionally, UAH doesn’t measure these items directly. So the reason for your concern needs to be known if you wish to receive a response explaining your concern.
I don’t have any concerns relevant to the topics being discussed in this subthread other than 1) the rejection of the relationship between energy/heat (Q) and temperature (T) via Q=mcΔT 2) the rejection of the relationship between pressure (P) and volume (T) and temperature (T) via PV=nRT 3) the claim that the specific heat capacity and mass of the troposphere has changed significantly since 1979 4) the claim that the existence of isothermal processes ΔT = 0 means energy and temperature are not related.
Do all the steam tables depend on the same pressure and humidity across all table entries? If so, then why are there so many tables? One would do.
You wrote: “I’ll ask again…how much has c and m changed for the UAH TLT layer since 1979?”
c and m never stop changing on every timescale.
You wrote: “It’s an observation. And measuring temperature does tell you about the energy in the system.”
Again, you do not understand, as Tim Gorman explained. Let me fix this quote for you again.
“And measuring temperature does tell you about the temperature you measured”
Look at the equation and you will see you were confused. Else, you’re simply not telling the truth. So which is it?
mario lento: ““And measuring temperature does tell you about the temperature you measured”
Sure, T = T. But Q = mcΔT as well.
mario lento: “Look at the equation and you will see you were confused. Else, you’re simply not telling the truth. So which is it?”
Maybe you can help me out. How does Q = mcΔT not relate energy (Q) to temperature (T)? What about PV=nRT does pressure (P) or volume (V) not relate to temperature (T) either? Is that what these formulas are saying…that is energy, pressure, and volume are NOT related to temperature?
P and V are not constants either, except in a lab environment where they can be artificially held constant.
Your lack of experience in the real world shines through in everything you say.
TG said: “Your lack of experience in the real world shines through in everything you say.”
Let me get this straight so that I’m not putting words in your mouth. Are you defending the rhetorical proposition that pressure (P) and volume (V) are in no way related to temperature (T)?
Stop throwing crap against the wall hoping something sticks! Quote the formula I gave you showing c & m as functions. You’ll have your answer.
You wrote: “When a system accumulates energy its temperature increases.”
Then you sort of proved that your statement is not accurate –wrt phase changes…
Let me correct your quote:
“When a system accumulates energy its stored energy increases.”
Temperature might go up and it might go down since other things need to happen for temperature to go up.
mario lento said: “Then you sort of proved that your statement is not accurate”
Which thermodynamic law says that temperature does not increase when a system accumulates energy?
It’s called an isothermal process. Did you take any science classes in school?
Yes. I have taken science classes. I have even taken thermodynamics classes specifically. That’s how I know that your defense of the claim that an input of energy into a system cannot increase T is absurd and your use of the concept of an isothermal process in doing so is doubly absurd. That’s not even remotely close to what an isothermal process means. An isothermal process is when ΔT = 0. Even your own everyday experiences should have clued you in on how absurd this claim is. When you add energy to your oven it heats up. When you add energy to your furnace it heats up.
What is latent heat and how does it affect temperature?
Latent heat is the energy released or absorbed during a phase change. This energy is related to mass via Q = mL where m is mass and L is the specific latent heat. Note that just because Q = mL that in no way invalidates Q = mcΔT. And before you start deflecting and diverting again by lecturing me about ignoring latent heat understand that I already told Captain Climate about it being important to consider things like latent heat of fusion when analyzing the energy content of the climate system so let’s save both our times and have you deflect and divert in some other way.
“Q = mL”
Where is delta- T in this equation? It *is* there you know, right?
Correct, an isothermal process where there is no temp increase.
But you then go on to imply that an isothermal process can’t increase energy – i.e. c and m are constants. But c & m are *not* constants, no more than gravity is the same on all planets.
Either your science teacher was bad or you didn’t pay attention. My money is on the latter.
There is no energy imbalance, nor any balance. Have you considered that your ability to look at evidence may be unbalanced?
The 1st law of thermodynamics strongly disagrees.
still no mute button?
Here here.
I remember the same being said about 1998.
It’s a mistake to make the reverse assumption of the warmists. We’ve only gone up a degree since the Little Ice Age. We could easily go up another 0.5 degrees before Planck feedback dominates sea surface albedo.
Yep….
NOAA SST-NorthAtlantic GlobalMonthlyTempSince1979 With37monthRunningAverage.gif (880×481) (climate4you.com)
Was that rectal?
Answer: the type of thermometer you do not put in your mouth.
Lol. It was a joke.
I am posting just to clarify a point I am not clear on. The red line is the centred 13 month average so the latest value must be the average from March 2021 to March 2022 centred on September 2021. Thus the value lags by 6 month as there cannot be a value with March 2022 as its centre. Is this correct or am I missing something?
You’re right. It’s a centred moving average.
ENSO forecast is above 50% to still be in La Nina conditions for JJA. Add in a four-month temperature lag, and 2022 is going to be a cool year.
On the other hand, we’re still deep within the second dip of a double-dip La Nina, yet March 2022 was the joint 8th warmest March globally in the past 44 years, according to UAH. So, relative to past temperatures, it’s not that cool.
La Nina yes, but so weak that only the instruments can detect it.
Past 44 years. For some reason, that seems to really impress you.
When it’s the 8th warmest in 200 years, then you can brag.
PS: 44 years ago was one of the coldest time periods of that century.
MarkW
It’s actually quite a strong La Nina. The threshold is -0.5C over a 3-month running mean. This one was been -1.0C for the last 3 3-month averages. For the latest (JFM 2022) it now stands at -0.9C. So not weak at all, really.
Not so much. The 20th century as a whole was -0.03C relative to the GISS base period. 1979 was +0.17C on the same base. The early 20th century was much cooler than the 1970s globally.
So La Niña is a heat recharging time for the oceans; where-as an El Niño is a heat release ocean cooling phenomena.
Maybe Bob T will comment?
Looks like it. Ocean heat content is hitting record high 3-month averages at both 0-700 and 0-2000m depths.
Not going warm for a little while yet at the earliest.
Depends on this year really, if the La Nina goes on the temperature will slide lower El Nino will be different.
The solar cycle looks to be center of field whatever the consequences of that are but the super solar cycles seem behind us for a bit.
If the temperatures continue to decline we can resume the improvements or the reduction of poverty and well being of the people on earth rather than pretending to build power contraptions that make everyone except some ruling class sycophants poor.
Look for the 2nd pause to continue its slide toward the first pause baseline as ocean cycles appear to be working against the climate alchemists.
An all summer La Nina would certainly drop the 2nd pause trend line.
https://woodfortrees.org/plot/uah6/from:1997/to/plot/uah6/from:1997/to:2014/trend/plot/uah6/from:2015/to/trend
Is your comment a veiled insult of alchemists?
Richard M
I added your two periods of cooling from 1997 together and guess what? They contribute to a clear overall warming trend.
https://woodfortrees.org/plot/uah6/from:1997/to/plot/uah6/from:1997/to:2014/trend/plot/uah6/from:2015/to/trend/plot/uah6/from:1997/trend/plot/none
Yes, the overall period is one of warming. However, we know the cause of that warming in 2014. A reduction in albedo right over the PDO flip. It’s not AGW. Given the trend over 24 of the 25 years shows no warming, the possibility this was anything but natural is minimal.
A polar vortex pattern in the lower stratosphere will provide winter weather in Europe through mid-April.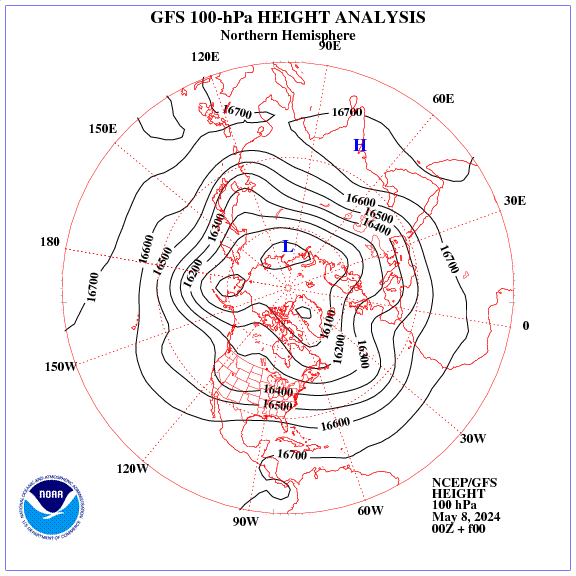
In Germany the winter weather has been back since 1. April (this is not a joke!!!!). 30 cm high snow at elevation of 242 m, up to -7 Centigrades Celsius during the night, etc. All fruit-trees in our garden were damaged, so no any fruits could be expected this year. According to the weather app of Win10 (I think CompuWeather) there has never been so cold at the beginning of April during the last 30 years in our village.
Yes but that is just weather. To be climate change there has to be unusual heat for at least 12 hours…
Dear Mr. Wager, currently we are at about 48 hours…
But not to worry, any unusual cold you experience today will be lovingly removed from the historic record to show your fruit trees were damaged by the heat of the adjustocene.
Last year was the situation very similar, and even in France an “agricultural emergency” had to be declared. And now IPCC writes, that the “mankind is in the last minute to save the climate”. Would these people be mentally OK?
The global average temperature in March is raised only by the anomaly in the Arctic: +0.74 C. In fact, satellites measured the anomaly in the stratosphere (SSW).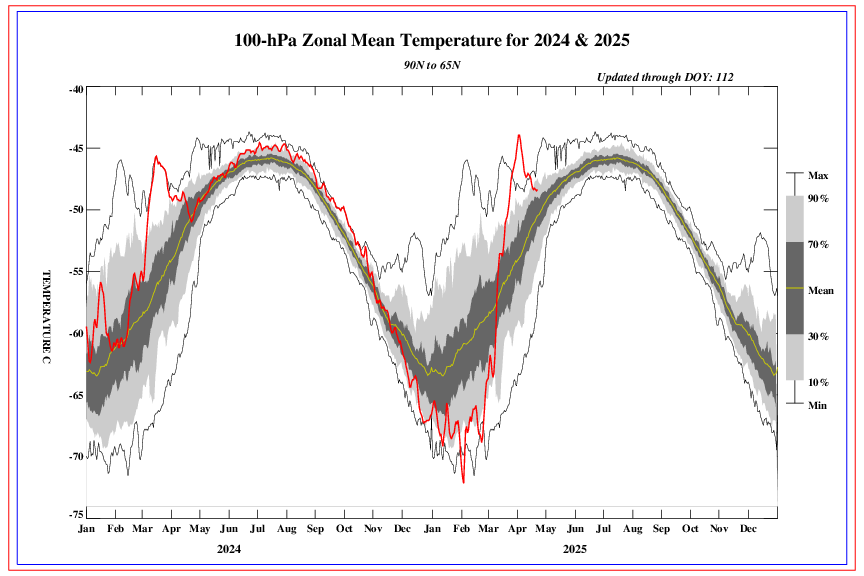
2022 03 0.15 0.27 0.02 -0.08 0.21 0.74 0.02
There can be no global warming during La Niña periods because the average temperature in the equatorial oceans is below average 1981-2000.
Terrifying isnt it. Snow in the UK in early April, coldest March since whenever, the usual wet and windy winter. Utterly terrifying this climate change, this warming….
The question is though, what change? What has actually changed since the 1970s I remember as a kid? Nothing so far as I can tell. It is the same weather we had then, snow at easter, wet and windy winters, the odd hot summer.
” It is the same weather we had then… ”
This I can’t confirm for Northeast Germany where I live since half a century.
Our last, cold ans snowy winter deserving the name was 2010.
Since then, we have unusually warm winters (in the sense of ‘not cold enough’, with some bit of snow) and mostly summers weaker than earlier.
Since 2020, we experience springs cooler than usual. Dito for France.
Unusual is also the increasing amount and strength of westerly winds.
The origin of all that has for me nothing to do with any global cooling.
It is manifestly due to a yearly increase of low pressure areas downwelling over the ocean from the Nortwest Atlantic to Western Europe: it’s as if Berlin had been moved to some North Sea coast.
More: whenever one of these damned, CCW turning LPAs reaches us while at the same time a CW turning HPA stays over Scandinavia, both act together as a giant Arctic air aspirator.
“where I live since half a century”
Are you still on the list and waiting for your Trabant ???
Eben
You behave here exactly like at Roy Spencer’s blog: as an ignorant, polemic dumbass who knows nothing, and therefore has only one thing in mind: to put other people down in a lousy way.
Dear Eben, he/she lives clearly not in the former East Germany, because the people in the former East Germany have not lost common sense. It is felt, that the guy is living in one of the “green (woke) hot spot” of the former West Germany. Note also, that in the former East Block the mathe/physics/chemistry education was rather strong…
Hari Seldon
” Dear Eben, he/she lives clearly not in the former East Germany, because the people in the former East Germany have not lost common sense. ”
I see you not only have a lot of ‘common sense’, but also are terribly knowledgeable about
– the former East Germany
– Northeast Germany
https://www.google.com/maps/place/Diedersdorf,+15831+Grossbeeren/@52.3462819,12.2373545,8z/data=!4m5!3m4!1s0x47a84317462318ff:0xa212048d6822fe0!8m2!3d52.347495!4d13.3599758?hl=en
Perfect, Mr Seldon!
Matthew Sykes
Since 2019, if you’re talking about the UK. Average UK temperatures this March were 6.7C, which is +1.0C warmer than the 1991-2020 average for March.
It was one of the coldest Marches we have had
“Snow in the UK in early April, coldest March since whenever, the usual wet and windy winter.”
March in the UK was well above average. 11th warmest in the Met Office summaries.
You seem to have a very selective memory about recent weather. Much of March was sunny and warm. It only turned cold in the last week, and it’s hardly been wall to wall snow. In the south I saw the occasional flurry of drifting snowflakes, nothing that stayed on the ground for more a minute. This, by the way is the first snow I’ve in over a year.
That should be March was the equal 11th warmest for mean temperatures.
It was a very sunny month, 2nd sunniest on record for the UK. There was quite a range, therefore, between max and min temperatures. It was the equal 6th warmest for max, but only the 34th warmest for min.
In figures
TMean: 6.7 °C
TMax: 11.1 °C
TMin: 2.3 °C
Compared to the 1991-2020 average the anomalies were
TMean: +1.0 °C
TMax: +1.9 °C
TMin: +0.1 °C
It is not true that this solar cycle is stronger than the previous one, as can be clearly seen by the level of galactic radiation compared to previous cycles. The level of galactic radiation that reaches Earth is controlled by the strength of the solar magnetic field, so its systematic increase indicates a weaker solar magnetic field.
http://wso.stanford.edu/gifs/Dipall.gif
Exactly like at Roy Spencer’s blog, I reply to your same comment:
Thus, according to your claim, neither the Sun Spot Number
nor the solar flux
can be considered a valid measure of solar activity.
Interesting point, no doubt!
La Niña in action – a tropical cyclone is approaching the east coast of Australia.
http://tropic.ssec.wisc.edu/real-time/mtpw2/product.php?color_type=tpw_nrl_colors&prod=ausf×pan=24hrs&anim=html5
This is a proxy measurement of part of the atmosphere subject to multiple adjustments and out of step with similar measurements like RSS – how does it have any value at all?
RSS “adjusts” using climate models and ship intakes….. all part of the AGW scam.
It wants to be like GISS, Had etc etc. it wants to “belong”, no matter what they have to do. !
Such a pity the RSS guys couldn’t remain honest !
But you are right… RSS has very little value any more.
b.nice: “RSS “adjusts” using climate models and ship intakes”
No they don’t. See Mears & Wentz 2017 for details.
Ask your friend Micheal M.
Have you incontrovertible proof it’s wrong then?
I hope you’re making the most of today’s incredible performance of wind turbines, a magnificant 36.37% of demand Now that you’re living your life in balance with unpredictable’s output
” magnificant “
I have no idea what this is about!
It does remind me of Johnny Carson’s Carnac the Magnificent,
but I’m sure you were thinking of something or someplace else.
In two days, very cold air from the north will begin to enter the central US. Under the clouds of the low, temperatures will remain very cold. Frontal thunderstorms will occur on the eastern side of the low.
If I focus on the center of the map and sort of squint and cross my eyes, Hunter Biden appears.
Weather Underground 10-day low temp forecast (usually pretty accurate) for Kansas, starting today:
41
41
40
34
28
44
61
53
46
These are typical April low temps. Only one night of possible freeze. It won’t be low enough to affect either my peas or lettuce.
An inch of rain predicted for Wed next week. That’s about it. Not much for thunderstorms over the next 10 days. Will have to water the garden in the meantime.
Well, I am predicting low temperatures, including freezing precipitation.
You can predict whatever you want. I’ll stick with Kansas State University and Weather Underground.
The ten day for Northern California shows a return to night time freezing starting at the end of the week and continuing on for another 5 days. This has been an interesting year this year as spring has started and failed several times now with temps dropping into the mid 20sF at night. There is a warm trend coming in now which is forecast to bring the day’s high up to 83F, night temps almost up to 50F. Then the night temps will drop 20 degrees lower on Saturday. Now that is some real climate change in action.
Cold air from the west will fall into the central US behind a cold front.
It is likely that a loop of cold air will be cut off in the upper troposphere over the central US.
Very surprised to see the Northern Hemisphere at +0.27 and the Arctic at +0.74.
The USA Pacific coast was below average for most of March. The Midwest and New York City had several below average periods, and England and northern Europe had several below average periods.
In the UK? Are you serious?
UK was in March 1 °C above the 1991-2020 average.
Tomorrow I’ll download the March data for Germoney, and I’ll check for your ‘below period’.
Anyway, you seem to be very influenced by CONUS’s weather and climate matters, which heavily differ from Europe’s.
Here is the data for March 2022 in Germoney, downloaded from
ftp://opendata.dwd.de/climate_environment/CDC/observations_germany/climate/hourly/air_temperature/
(from 41 stations in 1941 up to 510 in 2011), and processed to a monthly time series of absolute temperatures.
Absolute values
Coldest March between 1941 and 2022: 1987, -0.9 °C
Warmest: 2017, +6.7 °C
2022: +5.0 °C
Average for 1991-2020: 4.2 °C
Anomalies wrt the average
Coldest March between 1941 and 2022: 1987, -5.1 °C
Warmest: 2017, +2.5 °C
2022: +0.8 °C
The sorted list since 2010:
2013 3 -3.83
2018 3 -2.13
2010 3 -0.66
2016 3 -0.29
2021 3 0.10
2011 3 0.42
2020 3 0.63
2015 3 0.77
2022 3 0.80
2019 3 1.82
2012 3 2.17
2014 3 2.44
2017 3 2.52
Thanks for the data. I get my European weather reports from comments on this website plus Euro-tabloid street photos of pedestrians bundled up in winter clothes in March. As far as the USA, I pay very close attention to the weather data each day. Here in Seattle, we had 10 straight days of colder than average temps, and later in the month, 7 straight days of below average temps. The day I wrote the comment you responded to, our daily high was 47 F, which was 10 F below our 57 F average!
Thanks in turn for the convenient reply.
Yes, in Germany’s South it can be pretty cold even in March.
But if, like in 1986, there is still ice and snow on shady sidewalk corners here in north-eastern Germany at the end of April, then you know that it was really cold.
I had the intention to show most recent data for Scandinavia and Europe, using Meteostat hourly data, but the global download failed.
Yes, CONUS is getting colder and colder since a while.
Some years ago, I collected all GHCN daily data for CONUS and the entire European continent (incl. Ukraina, Belarus and Western Russia):
If I had selected Tmin instead of (Tmin+Tmax) / 2 as I chose here, the difference would have been even greater.
It’s not so long time ago that I saw on the monitor:
Cotton, MN -49 °C end of January.
Who cares? No human being has lived in global average temperature in the history of mankind, and local temperatures vary seasonally by far more than the Warm-mongers deem catastrophic.
Dr. Spencer ==> What is the uncertainty on your global average? +/- how much?
Readers — anyone who knows can answer this, please.
Christy et al. 2003. ±0.2 C (95%) for monthly anomalies and +0.05 C/decade (95%) for the trend.
It might also interest the WUWT audience to point out that per Christy & Spencer 1994, Christy & Spencer 1997, and Christy & Spencer 2000 there are at least 0.23 C/decade worth of adjustments to the data. This does not include the adjustments added in version 5 and 6.
bdgwx ==> Thanks for helping out.
I’ll check their earlier papers as well.
0.2°C uncertainty for a temperature measurement outside of a calibration lab is nonsense.
Remind me what your analysis suggests for the uncertainty.
Bellman ==> There is no analysis that properly gives the true uncertainty given the diversity, varability and the unknown quantity and quality of the original measurement errors for the thermometer record. The satellite record has some chance of coming up with error bars on their individual grid point/altitude measurement but averaging “global temperature” is hopeless for more reasons that will fit in a comment.
So why ask the question?
If all global temperature data is hopeless, why keep posting UAH data, and why give any credence to a “pause”? We just don’t know if global temperatures are going up at all, or if they are going up five times as fast as the data suggests.
KH said: “There is no analysis that properly gives the true uncertainty given the diversity, varability and the unknown quantity and quality of the original measurement errors for the thermometer record.”
Do you think the global average could be anywhere between 0 K and 1.4e32 K?
That’s a serious question because I want to get you thinking about what constraints can be placed on the uncertainty.
When the uncertainty exceeds the values of the data points then you know you an invalid data set. You can keep on accumulating uncertainty by adding more uncertainty but once it masks what you are trying to identify you are just indulging in mental masturbation. Once you can’t tell what is happening you need to stop and redesign your experiment.
bdgwx ==> There is no need “to get me thinking”. I speak of “the true uncertainty” of the thermometer record — not some philosophical but not physical or scientific “then it could be just anything….”.
If you want to know my thinking, read my essays here and at Judith Curry’s.
My essays here are easiest to find using this link:
https://wattsupwiththat.com/?s=%22by%20Kip%20Hansen%22
once you have scrolled to the bottom, the page will lengthen yet again, many times. Last count was over 200 . . . .
Is there a specific essay where you discuss the UAH TLT uncertainty that I can read?
bdgwx ==> No, although many deal with uncertainty in the thermometer record. If you want to discuss details about “the UAH TLT uncertainty”, write to Dr. Roy Spencer.
No need for me to write Dr. Spencer. He is an author on that Christy et al. 2003 publication. I’ve read through it and have no questions at the moment. Their type B evaluation is consistent with the Mears et al. 2009 monte carlo approach and my own type A evaluations. It is also consistent with the timing and magnitude of ENSO and volcanic events. That is if the uncertainty were much higher then we would not be able to discern those events in the UAH TLT timeseries.
It’s been pointed out to you before that monte carlo techniques only work with *random* variables. Anything that has a systemic error is *NOT* a totally random variable and it is not correct to use a monte carlo simulation to represent the data.
It also requires a mathematical formulation that describes the ENTIRE derivation procedure.
Stop whining.
So you don’t know either.
Here’s a quarter, kid, go buy yourself a slide rule.
A sincere question, do you think the uncertainty of UAH is at least ±7 °C?
It would surprise me that it has a +/- 7C uncertainty. The uncertainty of the measurement taken at any one point on the globe at any one time point can certainly have a +/- 0.5C uncertainty due to the presence of clouds, the humidity involved at that point in time and location, and the pressures at that that point in time and location (e.g. low pressure front vs high pressure point), plus probably numerous others.
That uncertainty accumulates as you combine separate individual measurements of different things around the globe. Were all the measurements of the same thing then you could possibly see smaller uncertainties in the average.
Natural variation might be psuedo-random but that doesn’t mean it all cancels out and doesn’t affect any average calculated. It most definitely does. The variation of temps is higher in winter than in summer leading to multi-modal distributions when combining NH and SH satellite measurements. Those don’t cancel out!
Remember, an uncertainty higher than 1C would mask any annual temperature change let alone the differences in the hundredths digit the CAGW advocates are alleging.
Not going to play your silly clown games.
That’s a pity, as you could have corrected my mistake. You actually said the uncertainty was at least ±3.4 °C.
https://wattsupwiththat.com/2021/12/02/uah-global-temperature-update-for-november-2021-0-08-deg-c/#comment-3401727
I’m sorry for exaggerating your figure. But it still seems implausible and I’d really like to know if you have reconsidered since then.
Asked and answered, counselor, move on… /judge
Bellman ==> There is value in asking good questions. There is also value in asking the right people. Asking your next door neighbor’s wife what principles of physics she uses to get to work in her car might help her to seek to learn more about the physical world — thus be valuable. But to assume that because she has no real answer that she is thus unqualified to drive her car is a step too far.
If you were asking a rhetorical question as a teaching tool, a question to which you (or anyone in this instance) could provide a scientifically precise answer, then we would excuse you your rudeness here.
The original question I asked was “What is the uncertainty on your global average?”. That is an important question so others can judge the data and its variability.
Your questions “what your analysis suggests for the uncertainty.” to Carlo. And “So why ask the question?” to me appear to me not asked in sincerity. Nevertheless, I tried to answer the question for you.
The fact that seeking a “global surface temperature average” is scientifically hopeless coupled to the fact that there are many groups around the world spending endless time and untold funds trying to calculate that number is one of the mysteries of our time.
If you wish to truly understand why I say that, you must read at least my series in Averages and my series on Chaos.
If you are just trolling and kicking the hornets nest, that’s just pathetic.
Sorry for asking the questions in an insincere way. The problem is I’ve been arguing with Carl, Monte for ages, and much of the time he just responds with personal insults, such as “stop whining”. I asked the question because I know that in the past he’s insisted the actual uncertainty in UAH is at least ±7 °C, or some such. I didn’t want to just say that as I thought it fairer to make sure he still held that opinion.
I asked you why you’d asked the question because I had assumed you genuinely wanted to know what the estimated uncertainty was, and it seemed odd to turn round and say there was no acceptable uncertainty.
I’ve been arguing about uncertainty for some time, and I do find it strange that some here think all data sets are so uncertain it’s impossible tell anything about what global temperatures have been doing over the last few decades, yet happily accept analysis such as Monckton’s pause if it seems to show warming has stopped.
Bellman ==> The problem with uncertainty is the uncertainty of it all. I didn’t intentionally get in the middle of your long-term argument with Carlo Monte. I had no idea of his proffered uncertainty for GMST. I dont recall him publishing anything hre to that effect (comments do not count, ever)
I asked about Spencer’s uncertainty because it is not included on his graph. That simple.
Of course, it will be Spencer’s stated uncertainty. One would have to do a lot of work to determine if that stated uncertainty in any way represented a real-physical-world estimate of just how wide the uncertainty bands would be. Uncertainty in the numbers do not necessarily carry over to the trends of the data set…that is another topic altogether.
If you are truly serious about uncertainty, then you have to really dig in the data and its origins. You have to ask the question “ The problem with uncertainty is the uncertainty of it all. If you are truly serious about uncertainty, then you have to really dig in the data the and its origins. You have to ask the question "What Are The Really Counting?"” target=”_blank”>What Are The Really Counting?” When things get scientific, then you have to dig in further and ask “Are they counting the thing they say they are counting?” and then ask “How are they counting it?” (measuring it). And then, “how are they analyzing the data they’ve collected?”
It is in those areas that the true uncertainty surfaces. For instance, in the world of Global Mean Surface Temperature one runs into the fact that the idea itself is somewhat unscientific. Physically, one cannot average records of sensible heat -temperature- it is not a physical quality that can be averaged. On the other hand, there are things about incoming solar energy and its effects that could be averaged.
To really get a grasp of this one must first quit thinking thoughts like “some people here.” Not that that isn’t true, but it just isn’t useful. I write a lot of things here that “some people” don’t like and a lot that “almost no one here likes”. That doesn’t change the truth value if what I write.
Take for instance the GMST for the 1890s….there is no reliable data set that tells us anything useful about GMST to a degree or three. There just isn’t such a thing that would pass any sort of scientific muster. It would be great if there was because warming since then seems to be of great interest to a lot of people and that is messing with our national energy policies.
You may argue with Monckton about his “pause” but not with him about the numbers which aren’t his. He just looks at the official numbers and uses them to poke doomsayers with that sharp stick (valid or not — not my call).
If you have something substantive to say on uncertainty, write it up in a thousand words or so and I’ll help you get it published here.
“One would have to do a lot of work to determine if that stated uncertainty in any way represented a real-physical-world estimate of just how wide the uncertainty bands would be.”
I reserve judgement as to how uncertain monthly UAH figures are. I agree that there are many possible sources of uncertainty and any quoted figure is a best a ball-park estimate. I also wish UAH would publish their own estimates.
However I do feel there can’t be that much uncertainty, or else it would be difficult to detect aspects such as ENSO and volcanic activity. Moreover it seems to me the correlation between different temperature records, such as UAH and GISS puts a limit on any uncertainty.
“Uncertainty in the numbers do not necessarily carry over to the trends of the data set…that is another topic altogether.”
That’s something I keep saying. Uncertainty in trends is mostly caused by the variation in the actual temperatures rather than from the measurements. The only uncertainty that will seriously affect the trends is systematic bias changing over time.
“It is in those areas that the true uncertainty surfaces. For instance, in the world of Global Mean Surface Temperature one runs into the fact that the idea itself is somewhat unscientific.”
I agree to an extent, though not for the reasons you say. That’s why it’s better to talk about the change in temperature and anomalies rather than a specific global temperature.
Bellman ==> At “best a ball-park estimate” — yes, absolutely.
“detect aspects such as ENSO” these are dectected in the satellite sea surface temperature record. I’m not sure that volcanic eruptions or their effects are actually detected as such, only slight changes in some data sets – maybe.
Dig in — that is my advice. Your general comments indicate a lack of deeper understanding of the issue involved. I don’t mean this as in insult — it is just so. You still talk as if you are sure that global temperature is a real physical thing and that wildly uncertain data sets can produce detailed, accurate, precise results despite comparatively huge uncertainties in collected and recorded data.
I assure you that it is just not the case — but I cannot give an in depth class here in comments. About 100 of my essays here touch on one or more aspects of these questions. The search tool on this site is quite good. Use it to find stuff of mine about GMST.
all my best,
Kip
Kip—Apparently this lot have some kind of odd or vested interest in making sure the uncertainties of The Trends is as low as possible, but they have no real-world understanding of what is involved in performing uncertainty analysis nor any real metrology experience.
Trying to educate them has proven to be a waste of time; having been provided with page-after-page of pointers, clues, tutorials, etc. by experienced professionals, they have chosen to ignore it all because it doesn’t line up with their gut instincts.
They really don’t care what real temperature measurement uncertainties are, all they do bite the ankles of anyone daring to cast doubt on the official Trends.
“Apparently this lot have some kind of odd or vested interest in making sure the uncertainties of The Trends is as low as possible…”
I do not. I’ve suggested before that you could probably increase any stated uncertainty. There are always unknown unknowns. I just find it implausible that monthly values could have too much of an uncertainty yet show such consistency across so many different methods.
What I have said is that I don’t think the measurement uncertainty is the main issue with any monthly global value, and I don’t think the uncertainty of monthly values is very important in establishing the uncertainty in the trend.
But what I’ve primarily been interested in is trying to fathom why a small group of people here insist that uncertainty of a mean increases with sample size. And I’m interested in that from the statistical side. If you can’t get that right I have little faith in any other expertise you choose to present.
“Trying to educate them has proven to be a waste of time; having been provided with page-after-page of pointers, clues, tutorials, etc. by experienced professionals, they have chosen to ignore it all because it doesn’t line up with their gut instincts.”
You know of course, we think the same about you. The problem is that looking at all these pages and pages of expert material all lead to the same conclusion – sample size does not increase uncertainty.
“…all they do bite the ankles of anyone daring to cast doubt on the official Trends.”
I keep casting doubts on the trends. Especially those that are based on carefully choosing start points and ignoring the context. I keep saying you need to look at the uncertainty of the trend, ask whether a linear fit is best, and compare multiple possibilities.
When I do mention trends it’s usually to explain that some claim is not supported by the statistics, not to claim that the trend is the only correct possibility, or that it will continue into the distant future.
Nice screed, unread.
“I just find it implausible that monthly values could have too much of an uncertainty yet show such consistency across so many different methods.:”
Almost all analyses use the same data and follow the same process and methods. None of the data sets I have ever seen do a good job of estimating uncertainty in individual measurements. Berkeley Earth admits it uses precision for its uncertainty estimates in the raw data – so that follows through in any analysis someone does using their raw data. Precision is *NOT* accuracy, i.e. uncertainty.
“What I have said is that I don’t think the measurement uncertainty is the main issue with any monthly global value, and I don’t think the uncertainty of monthly values is very important in establishing the uncertainty in the trend.”
That’s because you ignore the uncertainty of the data points and just assume that all data points are 100% accurate. Thus the uncertainty of the trend is really just the residuals of the trend line and the stated values. Nothing about uncertainties is included in the analysis of the trend line. The same sort of thing applies to monthly averages. You just assume all errors in the data are random and no systematic error exists in any measurement. That allows you to assume that all errors cancel out and the averages calculated from the stated values are 100% accurate. It’s the same thing all the so-called climate scientists advocating for CAGW do. And it is *wrong*.
“But what I’ve primarily been interested in is trying to fathom why a small group of people here insist that uncertainty of a mean increases with sample size.”
Again, that is because you refuse to believe what the experts like Taylor and Bevington tell us in their tomes. You’ve never in your life had to take personal liability responsibility for a product affecting a client or the public. You think it is just peachy to assume all error cancels out (i.e. it is all random) and everything will come out 100% accurate in the end. You’ve never, ever had to build a beam spanning a foundation – you just assume that when you put all those pieces of lumber together than they will be exactly the right length, no addition of uncertainty from the individual elements making up the beam. You’ve never had to build stud walls in a house. You just assume that if you just nail all the studs together on a frame that the drywall you attach will not have any waves in it because they will all be the average value! You’ve never had to build a multi-story building – you would just assume that if you use the average length for all of the framing studs that each end will wind up at the same height on the top of the third floor and the roof therefore won’t tilt. All those “random” errors in the framing studs will just cancel out!
It’s not a matter of you “can’t” fathom why uncertainties add, it’s a matter of you *won’t* fathom why they add.
“sample size does not increase uncertainty”
That is *ONLY* true when you have nothing but random errors. And for some reason you refuse to accept that both Taylor and Bevington say that isn’t true in almost all cases. You will *always* have some systematic error, the best you can do is minimize it. But there isn’t any way to minimize it in 1000 measurements of different things using different measuring devices. You simply cannot assume that all systematic errors will cancel. If they don’t cancel then they add. It truly is just that simple.
“supported by statistics”
That’s just great coming from someone that assumes that all measurement distributions are Gaussian and that the average is the “true value”. You can’t even admit that combining measurements from the southern hemisphere with measurements from the northern hemisphere give you a multi-modal distribution in which the average value is useless. It describes none of the modes and it doesn’t tell you the standard deviation of the combined modes,
And you speak of using statistics. Uh……
“Almost all analyses use the same data and follow the same process and methods.”
I’m talking here mainly about the difference between satellite and surface data. Two independent ways of measuring temperature.
“That’s because you ignore the uncertainty of the data points and just assume that all data points are 100% accurate. ”
I don’t know how many times you’ve repeated that untruth. We’ve spent so many pointless hours discussing how to propagate measurement uncertainty.
“Thus the uncertainty of the trend is really just the residuals of the trend line and the stated values.”
That’s not the uncertainty of the trend line being discussed here. I think you are talking about the prediction interval, not the confidence interval.
“Nothing about uncertainties is included in the analysis of the trend line.”
As Bigoilbob said sometime ago it is possible to incorporate measurement uncertainties into the trend line uncertainty but it makes little difference. But I also think it’s a pointless task, as any uncertainty is already present in the variation of the values.
“You just assume all errors in the data are random and no systematic error exists in any measurement. That allows you to assume that all errors cancel out and the averages calculated from the stated values are 100% accurate.”
Nobody claims any stated values are 100% accurate. And all data sets assume there is systematic error, that’s why the data is adjusted.
“Again, that is because you refuse to believe what the experts like Taylor and Bevington tell us in their tomes.”
Stop with these untruths.I don’t have to “believe” that Taylor and Bevington are correct. I know they are because it’s just standard statistics. The problem is you refuse to accept you are misinterpreting what they say.
“You think it is just peachy to assume all error cancels out”
I literally do not do that. The whole point of the statistics, whether talking about random sampling and the standard error of the mean or propagating measurement errors is that they do not all cancel out. At least not unless you could take an infinite number of samples and and all errors were random. What’s the point of calulating the standard error of the mean if you think all errors will cancel out?
“That is *ONLY* true when you have nothing but random errors.”
Well that’s progress. Originally you were insisting that uncertainty of the mean increased with sample size for random errors. It’s still nonsense to say that they increase with systematic errors. If you take the mean of an infinite number of samples, you will be left with the systematic error, it won’t be bigger than the systematic error of the individual values.
“That’s just great coming from someone that assumes that all measurement distributions are Gaussian and that the average is the “true value”.”
Untruth upon untruth. Again how many times have I talked with you about different distributions. What I have said is that if you are taking the average of the sample it’s in order to estimate the true value of the average. For some reason you seem to think an average is not a true value if it isn’t the size of a specific thing.
“You can’t even admit that combining measurements from the southern hemisphere with measurements from the northern hemisphere give you a multi-modal distribution in which the average value is useless.”
You just keep asserting that, but never demonstrated what the global temperature distribution is. And remember, we are really talking about anomalies here. However, you are right about one thing – I do disagree that an average of a multi-modal distribution is useless.
Again, and this is where we will have to agree to disagree – a mean does not have to tell you what a particular mode is to be useful. If the question is are two populations the same, then knowing the means are significantly different is sufficient to tell you they are not the same.
“I’m talking here mainly about the difference between satellite and surface data. Two independent ways of measuring temperature.”
This shows a total lack of understanding about the differences in the two data sets. Satellite data is a METRIC. It doesn’t even *try* to identify minimum and maximum temperatures at any specific location. The satellite just floats around gathering snapshots all over the globe which are then repeated the next day and the next day and the next day. All those daily snapshots are then averaged and then all of those averages are averaged again to form a baseline from which anomalies are calculated and averaged again! Then those anomalies are trended. Whether all those averages of averages truly represent a measure of global climate is questionable and whether any trend line deduced from them is even more questionable. And none of them are truly *temperature* measurements.
Surface data? It’s just as bad. No attempt is made to propagate uncertainty properly, it is just ignored or assumed to be the precision of the sensor. It is a conglomeration of multiple measurements of different things using different measurement devices whose uncertainties vary all over the place. Even worse is using measurements from other stations to estimate measurements at another location when the correlation of the components is not known but just assumed to be 100%.
The satellite global temperatures are a metric, so to are surface temperature records. I made no mention of ma and min, I’m just comparing the stated monthly mean values.
Your argument seems to be that you consider both satellite and surface data to be unreliable. But that’s missing my point, which is that two data sets both using completely different measurements and techniques, still show much more agreement month to month than would seem possible if the uncertainty was really in the multi degree range.
“ I made no mention of ma and min”
And yet that is what the data sets are made up of. You don’t even seem to know that!
” stated monthly mean values”
What do you think goes into determining those “stated monthly mean values”. And just what is the uncertainty of those “stated monthly mean values”?
“Your argument seems to be that you consider both satellite and surface data to be unreliable.”
Surface data are *only* reliable when used within their uncertainty limits. Anything outside of that *is* unreliable.
” But that’s missing my point, which is that two data sets both using completely different measurements and techniques, still show much more agreement month to month than would seem possible if the uncertainty was really in the multi degree range.”
If the surface data is unreliable outside its uncertainty range then using it as a standard to compare to the satellite data is useless. And the satellite data does *NOT* show the same magnitude of temperature rise as the surface data shows.
Besides month-to-month change is driven far more by the tilt of the earth then it is by anything else. If the temperature records show a decline from November to December so what? That doesn’t mean they are reliable to determine “global average temperature changes” in the hundredths of a degree!
“If the surface data is unreliable outside its uncertainty range then using it as a standard to compare to the satellite data is useless. ”
Yet somehow you aren’t worried that the two sets agree. How do two independent unreliable data sets both agree so much?
“And the satellite data does *NOT* show the same magnitude of temperature rise as the surface data shows. ”
I’m not talking about the trend, but the uncertainty in monthly values. If there’s a bias in the trend that’s a different question, but it can;t be caused by random or systematic errors in monthly measurements.
“Besides month-to-month change is driven far more by the tilt of the earth then it is by anything else. If the temperature records show a decline from November to December so what? That doesn’t mean they are reliable to determine “global average temperature changes” in the hundredths of a degree!”
Sorry, are you saying it was a tilt in the earth that caused the 2016 El Niño, or the current La Niña?
I’m not saying any data set is accurate to a hundredth of a degree. I’m saying the comparison of satellite data to surface data suggests they are not uncertain to multiple degrees.
Another point that is glossed over/hidden with the satellite measurements is how many times in a month is a given grid location sampled.
“I don’t know how many times you’ve repeated that untruth. We’ve spent so many pointless hours discussing how to propagate measurement uncertainty.”
You can deny it all you want but it *is* the truth. It even carries on to you claiming the fit of the trend line of the stated values is the uncertainty of the trend line. It isn’t. You’ve been provided all kinds of documentation showing that it isn’t. It’s merely the fit of the trend line to the stated values while absolutely ignoring the uncertainties of those stated values.
You even refuse to admit that the uncertainty of a sum, propagated from the individual elements in the sum, reflects on the uncertainty of the average calculated from that sum. You try to claim that the average uncertainty is the uncertainty of the average. It isn’t! Division by a constant does *NOT* change the uncertainty of the numerator. ẟN (the uncertainty of a constant) is ZERO. One more time: if you stack three 2″x4″x8′ boards together to create a beam the uncertainty of the total length is *NOT* the average uncertainty, it is the total uncertainty of the three boards added together. It is the uncertainty of the total, the SUM, that is important, not the average of the uncertainties.
“You can deny it all you want but it *is* the truth.”
I will keep denying it.But I’m more interested in what you think “It even carries on to you claiming the fit of the trend line of the stated values is the uncertainty of the trend line.” means. I don’t think the fit of the trend line is the uncertainty of the trend line. It’s the confidence interval of the trend line that is it’s uncertainty.
“You’ve been provided all kinds of documentation showing that it isn’t.”
You keep imagining you’ve sent me all this documentation that somehow proves your point, but you don’t say what it is.
“You even refuse to admit that the uncertainty of a sum, propagated from the individual elements in the sum, reflects on the uncertainty of the average calculated from that sum.”
Again with the making up stuff you think I’ve said. What I’ve argued is that the uncertainty of the sum does reflect on the uncertainty of the average – you divide the uncertainty of the sum by the sample size to get the uncertainty of the average, hence it is reflected. I have really no idea why you still think this is a controversial idea. It’s one of the main pillars of statistics, it’s how the standard error of the mean is determined, and it’s explained or implied in every text book you ask me to look at.
“You try to claim that the average uncertainty is the uncertainty of the average.”
I’m not sure I’ve ever said that. It doesn’t make any sense. To go back to your first example, 100 thermometers each with a random uncertainty of ±0.5°C. The average uncertainty would be ±0.5°C, but the measurement uncertainty of the average would be ±0.05°C.
“Division by a constant does *NOT* change the uncertainty of the numerator. ẟN (the uncertainty of a constant) is ZERO.”
I really don;t want to waste any more time trying to explain what you are missing here. If you don’t accept the explanations from your preferred school books, you are not going to accept it from me.
But for anyone else mad enough to still be reading this the mistake Tim makes is to ignore the fact that when you multiply or divide values you add the relative uncertainties, not the absolutes as he does here. Hence adding the zero uncertainty of N to the uncertainty of the sum is a red herring – what matters is that the relative uncertainty of the mean is the same as the relative uncertainty of the sum, and as the mean is smaller than the sum it follows that the absolute uncertainty of the mean must be smaller than the absolute uncertainty of the sum.
“if you stack three 2″x4″x8′ boards together to create a beam the uncertainty of the total length is *NOT* the average uncertainty, it is the total uncertainty of the three boards added together. It is the uncertainty of the total, the SUM, that is important, not the average of the uncertainties.”
And finally we come to the familiar misdirection – he’s now talking about the uncertainty of the sum of three boards as if they were the mean.
But it’s particularly daft here as we are not talking about stacking boards, but averaging temperatures. The sum f three wooden boards may be a more useful value than the average of their length. But that makes no sense when talking about temperatures. The sum of 100 thermometer readings is a meaningless value, but the average isn’t. If you add another three boards you might expect the length to double along with the uncertainty. But if you add another 100 thermometer readings to the 1st 100, the sum will double but that doesn’t mean the temperature has increased.
“I don’t think the fit of the trend line is the uncertainty of the trend line. It’s the confidence interval of the trend line that is it’s uncertainty.”
When you calculate the average of the residuals you are measuring the fit of the trend line to the data. That *is* what you have been doing.
The uncertainty of the trend line is related to the uncertainty of the data points, not just the residuals of the stated values vs the trend line. Where in anything you’ve ever done have you translated the uncertainty of the stated values into the anything associated with a trend line? If you had done so you would understand that as long as the trend line is inside the uncertainty intervals of the data elements you can’t determine the validity of the trend line. It could be up, down, or horizontal.
“When you calculate the average of the residuals you are measuring the fit of the trend line to the data. That *is* what you have been doing.”
You do not do that to determine the fit. The average of the residuals is likely to be close to zero. You average the absolute values, or in this case the squares of the residuals. But this is not how you calculate the confidence interval.
“Where in anything you’ve ever done have you translated the uncertainty of the stated values into the anything associated with a trend line?”
See my comments else where where I looked at what the trend line is using Carlo, Monte’s ridiculous uncertainty estimates. It increases the uncertainty of the trend, but not by that much. For realistic uncertainty estimates it will probably have a minimal effect.
“If you had done so you would understand that as long as the trend line is inside the uncertainty intervals of the data elements you can’t determine the validity of the trend line.”
And I’ve explained to you why that is not the case.
HAHAHAHAHAHAHAHAH
YES! I’m stuck in the mind of bellcurveman forever now!
So sad for you, you still have ZERO CLUES about real uncertainty values.
I gave you the opportunity to correct yourself. You went into a sulk.
How magnanimous of you, Your Highness!
“You keep imagining you’ve sent me all this documentation that somehow proves your point, but you don’t say what it is.”
How many times do I have to post this before you actually look at it and understand it?
Some doodle from you does not equate to documentation.
I’ve hazarded a guess as to what you think you are doing with that picture and explained why it isn’t what is meant by an OLS trend. If you want to draw Monckton’s pause like that and use it to determine the uncertainty please feel free to send it to me.
Here’s the Skeptical Science uncertainty range for comparison.
You are hilarious. What do think the “doodle” TG showed you actually does?
Look at the uncertainty shown by your graph. The trend line could vary from “-0.009 + 0.610 = +0.609”, an increase, to -0.619, a decrease. Those are the crossing lines shown in TG’s “doodle”.
The upshot is that you have no idea where the trend line actually should be within the uncertainty interval. That’s what we’ve been trying to tell you for ages. You finally stepped into it and don’t even recognize what you’ve done.
“What do think the “doodle” TG showed you actually does?”
Not what the one I posted does.
The confidence interval is ±0.610°C / decade. It has nothing to do with the measurement uncertainty of the monthly averages. We don;t know what the measurement uncertainties are in the UAH data, it’s just the usual calculation for the confidence interval taking into account autocorrelation.
“The upshot is that you have no idea where the trend line actually should be within the uncertainty interval. That’s what we’ve been trying to tell you for ages.”
Funny, it’s what I’ve been trying to tell Monckton for ages. The pause is meaningless. Temperatures could be increasing at 4 times the previous rate or declining at a similar rate. You simply cannot tell what is happening over such a short interval.
Now look at the uncertainty over a longer period.
Trend: 0.134 ±0.049 °C/decade (2σ)
Could be as much as 0.183 or as little as 0.085°C / decade, but it’s very likely that there has been no warming.
You’re nothing but a disingenuous disinformation agent.
“The pause is meaningless. Temperatures could be increasing at 4 times the previous rate or declining at a similar rate. You simply cannot tell what is happening over such a short interval”
Then the rise is also meaningless.
So which is it? 1. The climate scientist don’t actually know what is happening, or 2. The climate scientists do know.
You can’t have it both ways. Pick one and stick to it.
No, the rise since 1979 is statistically significant. It may be lower or higher than the best estimate, but it’s vanishingly improbable that you would see that much warming just by chance.
SkepticalScience? Great source, nimwit. Exposes what your real agenda is.
Yes, my agenda is to use what ever tools are most convenient. I could have drawn the graph myself, as I usually do, but as this was about confidence intervals I prefer this graph as it gives a large correction for autocorrelation. Given the whole claim is that the uncertainties should be bigger I’m not sure why you don’t want me to use this.
Do you have any specific objection to the presentation of the graph or are you on another attention seeking stalking exercise?
“Again with the making up stuff you think I’ve said. What I’ve argued is that the uncertainty of the sum does reflect on the uncertainty of the average – you divide the uncertainty of the sum by the sample size to get the uncertainty of the average, hence it is reflected.”
NO, you *don’t* do it this way! Again, how many times does this have to be explained before you get it?
If I have a group of 2″x4″x8′ long boards, each with a different uncertainty interval and I calculate the sum of their uncertainty values and divide it by the number of boards I get an AVERAGE UNCERTAINTY. That average uncertainty may or may not have *any* relationship to the actual uncertainty of any specific board just as the average length may or may not have any relationship to any of the boards.
If I use the average length of the boards and the average uncertainty to fasten three of them together using fish plates what is my certainty that they will successfully span the distance I need? Is it 3 x AvgUncertainty? Or is it the sum of the uncertainties of the three boards?
I assure you that if you pick 3 x AvgUncertainty then I want you no where near my construction site! You would be a disaster wasting me time and money and probably a client.
“Again, how many times does this have to be explained before you get it?”
Until you give an explanation that makes sense.
“If I have a group of 2″x4″x8′ long boards, each with a different uncertainty interval and I calculate the sum of their uncertainty values and divide it by the number of boards I get an AVERAGE UNCERTAINTY.”
Yes. Not sure why you’d want to know the average uncertainty, but carry on.
“If I use the average length of the boards and the average uncertainty to fasten three of them together using fish plates what is my certainty that they will successfully span the distance I need?”
You haven’t specified what type of uncertainty.
“Is it 3 x AvgUncertainty? Or is it the sum of the uncertainties of the three boards?”
Trick question, they’re the same.
“I assure you that if you pick 3 x AvgUncertainty then I want you no where near my construction site!”
That’s a relief.
But now lets look at example that is relevant to what you claim. You have 3 pieces of wood, you measure the length of each and add them together. The sum comes to 24′ and you estimate the uncertainty of each measurement to be ±0.1′. You calculate the uncertainty of the sum therefore to be ±0.3′, as you don’t want to assume all the uncertainty is random.
Now you also want to know the average board length, so you divide by 3 to get an average length of 8′ ± 0.3′. (Because you don;t believe in dividing the uncertainty by 3).
So now what is the uncertainty of the 3 boards nailed together? Again assuming these uncertainties may not be random, I assume you would have to say it’s 24′ ± 0.9′.
Maybe that’s not too much of a problem. But now say you repeat that with 100 boards. Sum is 800′, uncertainty of the sum is ±10′, and the average is 8′ ± 10′.
So what is the uncertainty of all the boards stuck together? Is it 800′ ± 1000′?
“I have really no idea why you still think this is a controversial idea. It’s one of the main pillars of statistics, it’s how the standard error of the mean is determined, and it’s explained or implied in every text book you ask me to look at.”
You just can’t seem to get it into your head that the standard deviation of the sample means is a measure of precision not a level of uncertainty!
The smaller the standard deviation of the sample means is it only indicates that the stated values of the component elements are close together so that the various sample means are all about the same. THAT DOESN’T MEAN THAT THOSE STATED VALUES GIVE YOU AN ACCURATE MEAN FOR THE SAMPLES!
One more time — If the uncertainty interval for those stated values have *any*, and I mean ANY, systematic error then the means you calculate simply won’t be accurate. They may all be close together in value but they may be completely off target! How far off target they are depends on how large the systematic error is compared to the random instrumental error. They may give you a small standard deviation of the sample means but the average you calculate from those sample means will just be as inaccurate as all git-out!
Why is this so hard to understand? Every text book I have asked you to look at assumes the stated values are 100% accurate and the only thing causing a standard deviation of the sample means that isn’t zero is the variation in the sampling. None of those textbooks consider that the stated values have an uncertainty interval.
The only references I have given you that do address this are Taylor and Bevington and you just simply refuse to do anything other than to try and apply their rules to *everything* as if everything is made up of totally random error that totally cancels out! That can only happen with Gaussian distributions of random error.
“If the uncertainty interval for those stated values have *any*, and I mean ANY, systematic error then the means you calculate simply won’t be accurate.”
I’ll just deal with this one point.
You keep insisting that the idea of using the standard error of the mean is valid as long as you are measuring the same thing with the same instrument under the same conditions over and over again. All the metrology books say that is OK. Am I right? But multiple measurements only improve precision as you say, and you also insist that all measurements have some systematic error.
So would you say that any measurement made with any instrument is never accurate, no matter how many times you measure it? And if so, would you say that that is a valid reason for not trying to improve the precision?
Should Tim feel honored that you deign to do so?
Oh, and you know absolutely zip about real-world metrology, despite all the reams of blather you generate while trying to paper over your abject ignorance. This idiotic question exposes your bare hindside.
“Should Tim feel honored that you deign to do so?”
It was early morning and I wanted to go to bed, so I decided not to go through every point. Is that OK with you?
1. Go back and reread Taylor and Bebington. I’ve given you their exact quotes on the subject.
2. No measurement is ever perfectly accurate. No measuring device is ever perfect. That is the whole point of the uncertainty interval – to describe how imperfect the measurement is.
Increasing precision doesn’t mean you have increased accuracy. Once again you show your ignorance of metrology. Increased precision MAY help but that isn’t a guarantee. An inaccurate seven digit voltmeter may have higher precision than a four digit one but it may be more inaccurate as well.
“You just can’t seem to get it into your head that the standard deviation of the sample means is a measure of precision not a level of uncertainty!”
This deflection with strawmen is quite tedious.
You say that in calculating the uncertainty of a mean you take the uncertainty of the sum and use that as the uncertainty of the mean. I say that’s wrong, you have to divide the that uncertainty by sample size. I point out that this is very basic statistics and true whether talking about measurement uncertainty or sampling uncertainty and is the basis of calculating the SEM.
Your response is to go about how the SEM may not be a perfect estimate of the uncertainty, none of which I disagree with. But it’s irrelevant to the point. The SEM is derived in the way I’ve said, it gets smaller as sample size increases, just as every text book says, including the ones by metrologists.
There are lots of ways in which a mean may be wrong, including sampling bias, and to a far lesser extent systematic errors in measurements. There are lots of factors to be considered in devising and interpreting a statistical experiment. But none of this removes the fact that in general a larger sample will reduce the uncertainty of your result. And absolutely none of this implies that uncertainty increases with sample size.
Just another load of your usual bullshite.
Bellman. –> “But none of this removes the fact that in general a larger sample will reduce the uncertainty of your result. ”
You are correct that a larger sample size will reduce the uncertainty of the estimated population mean.
But it does nothing to resolve the precision of the mean value. Too many people misinterpret the SEM to say that you can add decimal digits to to the value of the mean. IOW, if the SEM is 0.005 I can carry out the calculation of the mean to 3 decimal digits and then show the uncertainty as 4 decimal digits. Wrong, wrong, wrong.
This is getting confusing. Tim says the SEM tells you the precision of the mean but not the uncertainty, you say the opposite.
Still, you are now saying that increasing sample size will reduce the uncertainty of the estimate, which is what I’ve been arguing for the last year. When you and Tim have been insisting the uncertainty increases. So to be clear, do you now accept the claim the uncertainty increases with increasing sample size is incorrect?
You simply can’t read or you can’t comprehend simple statistics. Standard deviation of the sample means is a measure of how precise the calculated mean is. If it is 60 with a standard deviation of .001 that does not mean the precision of the measurements contributing to the mean has increased to the thousandth digit. You can’t make a micrometer out of a ruler! It only means the spread of the contributing means is small. That doesn’t mean you can increase the number of significant digits in the mean.
Yes, it’s a measure of how precise the sample mean is. Of course it doesn’t make the measurements more precise. It’s the mean that is more precise. If it’s 60 with a standard error of 0.001 than any other sample mean with the same size will likely be within ±0.002 of 60. Why do you think the precision of the measurements is relevant to this? And why do you think you cannot report this to 3 or 4 decimal places?
Because of the uncertainty of the mean! One more time, if all the measurements are off by an inch then their mean will be also! It doesn’t matter how precisely you calculate the mean it’s accuracy can be no better than that of the measurements creating it. And part of that accuracy includes the significant digits in the measurements.
What has being off by an inch got to do with the number of digits. You know the precision of the mean, just guessing there may be some arbitrary systematic error doesn’t affect that precision.
You could apply your logic to anything. Measure one of your precious wooden with a highly precise instrument to 0.001mm, but hay, how do you know it doesn’t have a systematic error of 5m. Best only give your measurement to the nearest 10m just to be sure your not committing fraud.
A *precisely* calculated mean is not the Precision of the mean. You can’t increase precision by calculation. That is unethical and a fraud. No physical scientist or engineer would do such a thing. Sooner or later the fraud would be caught out.
Why must you be taught basic theory? The SEM is not how precise the sample mean is. It is a measure of the interval within which the population mean may lay.
Why an interval? First, lets assume zero uncertainty in any of the data points. Second, assume each and every sample has a large enough size (“N”) to perfectly match the population distribution. Third, the population is a perfect Gaussian distribution.
The Cental Limit Theory predicts that the means of the sample means will accurately predict the population mean. Why?
If the population distribution is Gaussian, then there is a plus point for every minus point from the mean. If the samples duplicate this, all the sample means will be the same value. What is the SEM in this case? It is zero. Guess what? You just absolutely with no error accurately calculated the population mean.
Now none of this ever happens. Populations are never absolutely Gaussian. Samples never accurately represent the whole population. Sample means always have a non-Gaussian distribution. That means there will exist a standard deviation of the sample means and you must assume that the means of the sample means can lay within 1σ, 2σ, whatever interval you choose. Most choose 1σ.
Now let’s analyze. If your sample size “N” is large enough and random enough you can minimize sampling error because the sample will more accurately depict the population distribution. If you take enough samples you minimize sampling error for the same reason. But you can never reach perfection. You can never know just how accurately the means of the sample means is. It could be anywhere within the ±σ interval.
If you have data that is all integer, then the sample data should be all integer and the deviations should be integer. In other words, the measurement resolution defines what the actual mean value should have for Significant Digits. Can you have a mean of sample means of 12 ± 0.001? How about 12 ± 0.000001? Sure. But you still can’t say the mean is 12.001 or 12.000001.
“Why must you be taught basic theory? The SEM is not how precise the sample mean is. It is a measure of the interval within which the population mean may lay.”
Why do you always have to be so patronizing every time you write a long screed demonstrating how much you don;t understand?
Have a word with Tim. He says that SEM is a measure of precision of the mean, not uncertainty. He’s right about that. You for some reason are claiming that it isn’t indicating precision but is measuring uncertainty.
The SEM tells you the precision of the mean, but not the trueness, i.e. it shows the effects of random error but not systematic error. This can come as Time says from having a systematic error in measurements, but more usually and significantly comes from biases in the sampling.
“If you have data that is all integer, then the sample data should be all integer and the deviations should be integer.”
Rubbish. I don;t if any of your “rules” say anything of the sort. Consider a simple six sided die. All integer values. standard deviation 1.708. What possible benefit would there be in pretending that was 2.
“In other words, the measurement resolution defines what the actual mean value should have for Significant Digits.”
I keep telling you, that’s not what any of the metrology guides say has to happen. You determine the uncertainty and report to the same number of decimal places. What you keep describing are the simple rules taught for those who don’t get into the better measurement of uncertainty. They work fine for simple situations but are demonstrably wrong if you use them to argue that means taken from many observations can not be more precise.
“Can you have a mean of sample means of 12 ± 0.001? How about 12 ± 0.000001?”
Theoretically, but I doubt if any real world one would have that small a confidence interval. What is your sample size, what’s the sample standard deviation?
To have a SEM of 0.001, assuming the standard deviation was 1 and your uncertainty range is 2σ, would require a sample size of 4,000,000. To get 0.000001 would require 4,000,000,000,000.
One reason to determine SEM is to decide what is a reasonable sample size. There’s unlikely to be any benefit to taking millions of samples just to get an extra decimal point of precision, especially as the smaller this figure becomes for greater the influence of any systematic bias will be.
“Sure. But you still can’t say the mean is 12.001 or 12.000001.”
I’m not sure if you understand what those ± symbols represent. This isn’t a an equation where ± means both add and subtract that value. It’s simply a short hand way of showing this is an interval.
“One more time — If the uncertainty interval for those stated values have *any*, and I mean ANY, systematic error then the means you calculate simply won’t be accurate.”
Define accurate. Nothing is ever 100% accurate, what you are trying to do is improve accuracy. If I’m taking a sample and measuring them with a systematic error that error will also be present in the mean. This means that larger samples will not improve the trueness, but will improve precision and hence accuracy.
In general this is unlikely to be a problem as any systematic measuring error should be small compared with the sampling uncertainty. And if you are using an instrument that has such a large systematic error that it affects the result of your experiment, that’s more of an issue with your procedures than it is with the statistics.
Get some clues PDQ, please!
“That’s not the uncertainty of the trend line being discussed here. I think you are talking about the prediction interval, not the confidence interval.”
Nope! If the stated values have an uncertainty interval then the residuals will also have an uncertainty. And that uncertainty of the residuals carries over to the uncertainty of the trend line. *YOU*, on the other hand continually want to ignore that uncertainty in the residuals which result from the uncertainty of the stated values.
You were given the attached graph to show this. You were provided several other graphs showing the same thing in more detail. And you just blew them off because they were outside your understanding.
Try one more time to understand.
I have no idea what you thing that doodle has to do with anything. It might make some sense if you are trying to get a rough idea of a trend in a lab, when you only have 3 measurements, it is not how you determine a trend statistically, with hundreds of data points, and variances that have little to do with measurement errors.
I didn’t figure you would be able to understand it. It’s too far outside your limits of knowledge.
In essence it is three data points and their uncertainty intervals. I drew three different trend lines that all stay within those uncertainty intervals. One line has a positive slope, one has a zero slope, and one has a negative slope.
It doesn’t matter how many points you have as long as you can draw a linear line connecting points within their individual uncertainty intervals. It’s only when the stated values are far enough apart that you can no longer draw a straight line through their uncertainty intervals that you can give any credence to the trend line. Temperatures and temperature anomalies simply aren’t spread that far apart from data value to data value.
The *variances* associated with the data values *IS* their uncertainty intervals of the measurements! You can’t even get that right!
I know what you are trying to say, I just don’t think your doodle makes it very clear.
You are using a simplified type of line fitting, appropriate to some simple situations. In particular the assumption is that an exact linear relationship exists, and any deviation of a point from the line is the result of measurement error. Hence it is assumed you should be able to draw a straight line which passes through all uncertainty bars.
This is not usually the case where linear regression is being used. There may be an exact linear relation between the independent and dependent variables, but there is no assumption that all points will exactly fit on that line regardless of how exact the measurement is. That;s because there are other independent factors affecting the dependent variables.
You don’t just guess what the best fit is, you calculate it, and you can also calculate the confidence intervals of this trend. As always this is based on assumptions, and there are many factors, such as autocorrelation, that can affect the confidence.
More blather.
For example, here’s the pause period in UAH with the claimed ±0.2°C monthly uncertainty. I’m not sure how you could determine the trend line from that, let alone the confidence interval, just by drawing a straight line through all the uncertainty bars. Any trend will have to miss the uncertainty bounds by some margin, but that is not becasue the measurements are wrong, it’s because the of natural variance in the actual temperatures.
And here’s the same using Carlo, Monte’s uncertainty ranges. Now you could easily fit a lot of different trends. But if you argue that the uncertainty of the trend is any line you could fit in that area, you would be saying the uncertainty was around ±7°C in the seven and a half years, meaning the true warming rate could be ±9°C / decade.
You just made the best argument anyone could for how valuable linear regressions are when dealing with time varying phenomena.
You would like a straight line so it could be shown to be correlated with CO2 increase. But the issue is that climate has a multitude of cycles. Why would anyone try to use linear regressions to show the temperature that is the result of numerous cycles. There is only one reason, to attempt to show a simplified example of growth regardless of its accuracy. As time goes on, linear regression is going to mean less and less as cycles become more and more apparent. Live with it.
Learn time series analysis techniques.
You attacked me for making predictions based on linear regression, when I’d done no such thing. Now you want topredict the future based on cycle fitting.
You keep referring to “degrees/decade”. That is ok for the data you have. But, you’d better be sure that linear regression truly describes the data when you start traipsing through the future. Very few, if any can see into the future accurately. Those who say we could see 5 degrees or more warming should have to bet their farms on that and forfeit the farms when it doesn’t come true.
Once again, I am not making any prediction about the future from any linear trend. That is simply showing what has happened. I use degrees / decade because that’s a unit of temperature change. Monckton uses degrees / century. It does not mean you expect the trend to continue for that length of time, any more than giving a speed in kilometers / hour means you expect that speed to be maintained for an hour.
You really need to take this up with Monckton. He’s the one who only ever uses linear trends regardless of sense. Either showing a trend over a very short time span and calling it a pause. Or using a linear trend over the past 170 years when the data is clearly not linear.
Any straight line linear trend, or any over linear regression is only an estimate of what is happening. So too is any attempt to fit cycles. Either could be wrong. If you want to test the fit you need to do more rigorous testing, e.g. separating out training and testing data.
But trying to predict the future is better done using an understanding of the climate, not extrapolating from the past.
What do you think those curved blue bars on the graph you posted are for? Draw a line connecting the top left and bottom right, then another line from the top right to the bottom left. That is the uncertainty interval and the trend can lie anywhere within that interval.
Exactly. And it has nothing to do with measurement uncertainty.
Idiot!
“As Bigoilbob said sometime ago it is possible to incorporate measurement uncertainties into the trend line uncertainty but it makes little difference. But I also think it’s a pointless task, as any uncertainty is already present in the variation of the values.”
It makes a BIG difference as the graph I attached in the other message shows. You are *still* looking for a rational for your assumption that the stated values are 100% accurate!
“Nobody claims any stated values are 100% accurate. And all data sets assume there is systematic error, that’s why the data is adjusted.”
*YOU DO!* Every time you claim the uncertainty of a trend line is based on the residuals calculated solely from the stated values with no consideration of the uncertainty of the stated values.
And NO ONE can adjust anything on temperature measurements other than on a station-by-station basis. Hubbard and Liu showed that in their mid-2000 papers on the subject! You *especially* can’t adjust past measurements because you don’t know anything about the past.
“You are *still* looking for a rational for your assumption that the stated values are 100% accurate!”
You really don;t help your case by continuously repeating these false claims.
“*YOU DO!* Every time you claim the uncertainty of a trend line is based on the residuals calculated solely from the stated values with no consideration of the uncertainty of the stated values.”
No I don’t. I assume that measurement uncertainties are unlikely to make much of a difference, that doesn’t mean I assume they don’t exist.
“No I don’t. I assume that measurement uncertainties are unlikely to make much of a difference, that doesn’t mean I assume they don’t exist.”
I just posted a graph to you showing that that the measurement uncertainty DOES MAKE A DIFFERENCE!
I’m sure you will deny ever getting the graph because it just puts the lie to your claim here!
When you ASSume they don’t make a difference then you *are* assuming the stated values are 100% accurate!
Which is just another sign of your idiocy.
“Stop with these untruths.I don’t have to “believe” that Taylor and Bevington are correct. I know they are because it’s just standard statistics. The problem is you refuse to accept you are misinterpreting what they say.”
It is *NOT* standard statistics. It is metrology statistics. I gave you numerous examples from four different statistics textbooks showing that they *ALL* ignore uncertainty of the data values. Not a single one covered how to propagate uncertainties in the real world.
You are living in a textbook world where there is *NO* uncertainty is data values and, in most cases, a Gaussian distribution is assumed.
Nor am I misinterpreting what they say. You’ve been shown that over and over and over again.
“It is *NOT* standard statistics. It is metrology statistics.”
I hadn’t realized metrologists had invented their own version of statistics. Nothing in any of your text books suggests there’s any difference between the two.
Standard statistics texts do *NOT* teach about uncertainty, how to calculate it, how to propagate it, and when different approaches apply. I posted you excerpts from FOUR different statistics textbooks as examples.
The proof is your posting that assumes that all error is totally random and all data/error distributions are Gaussian. You don’t have the slightest idea of how to handle a skewed data set with increasing systematic error, e.g. measuring the diameter of a wire being drawn through a die which wears on the measuring device.
“I literally do not do that. The whole point of the statistics, whether talking about random sampling and the standard error of the mean or propagating measurement errors is that they do not all cancel out.”
Then why do you assume that they *do* all cancel out? Why do you assume that the uncertainty of multiple measurements of different things using different devices doesn’t grow as you add elements to the data set? Why do you assume all the uncertainties cancel out?
“Then why do you assume that they *do* all cancel out?”
Perhaps if you just stopped making stuff up, you would understand better.
“Why do you assume that the uncertainty of multiple measurements of different things using different devices doesn’t grow as you add elements to the data set?”
Do you understand that there can be a big set of options between “everything cancels out” and “everything keeps growing”?
“Why do you assume all the uncertainties cancel out?”
Why do you assume they faked the moon landings?
“Perhaps if you just stopped making stuff up, you would understand better.”
Troll answer. You didn’t address the question!
“Do you understand that there can be a big set of options between “everything cancels out” and “everything keeps growing”?”
Another troll answer. Provide some examples and references!
“Troll answer. You didn’t address the question!“4
The answer to your fatuous question “Then why do you assume that they *do* all cancel out? ” is “I do not think they all cancel out.”
Is that sufficiently non-trollish answer, or are you again ask me to justify things I don’t believe?
“Another troll answer. Provide some examples and references!”
Really? You need examples and references to the idea that there is something between everything cancelling out and uncertainty increasing as you add more things?
OK. Example, 100 thermometers each with an entirely random measurement uncertainty of ±0.5°C. The measurement of the uncertainty is ±0.05°C. This is smaller than any individual uncertainty, but it is not zero. So all uncertainties have not cancelled out, but neither has it grown as we add elements.
You fool. When I put this idiocy to the grave by increasing the number of measurements, you and bozo-x denied reality.
And now you are back to the same nonsense claim!
Priceless.
What are you whining about now? It’s difficult to keep up with all your nonsense, but when did you put this to the grave?
A PeeWee, how quaint.
He can’t.
I did.
“What’s the point of calulating the standard error of the mean if you think all errors will cancel out?”
The standard deviation of the sample means is a measure of how precisely you have calculated the mean. It is *NOT* a measure of the uncertainty of the calculated mean – unless you assume all uncertainty cancels, which you claim you don’t do!
If all the measurements have the same systematic uncertainty, ẟx, and you pull multiple samples from that universe of measurements then you can calculate all the means of the samples you want, combine them, and get a very small standard deviation of those sample means. It can be calculated *very* precisely. But it won’t be accurate because of the ẟx’s involved.
If your measurement device is an inch too long then that mean you calculate from the sample means will reflect that and it won’t be accurate. It will *never* give you a true value of any kind.
Yet *YOU* always assume it will.
“The standard deviation of the sample means is a measure of how precisely you have calculated the mean. It is *NOT* a measure of the uncertainty of the calculated mean – unless you assume all uncertainty cancels, which you claim you don’t do!”
You are so missing my point. You claimed statisticians assume all random errors cancel out, I brought up the standard error of the mean to illustrate that they don’t assume that.
“If all the measurements have the same systematic uncertainty, ẟx, and you pull multiple samples from that universe of measurements then you can calculate all the means of the samples you want, combine them, and get a very small standard deviation of those sample means.”
And continuing to miss the point. This was you claiming that statisticians thought that random errors completely cancel out, but now you shift to systematic errors, which of course don’t even partially cancel out.
“If your measurement device is an inch too long then that mean you calculate from the sample means will reflect that and it won’t be accurate. It will *never* give you a true value of any kind.
Yet *YOU* always assume it will.”
Stop fighting against strawmen. It’s embarrassing when they keep beating you.
Show me one comment where I have claimed that if you measure something with ruler that is an inch too long, that it will give you a true value.
“You are so missing my point. You claimed statisticians assume all random errors cancel out, I brought up the standard error of the mean to illustrate that they don’t assume that.”
And once again, you demonstrate your fundamental lack of knowledge about the subject.
Write this down 100 times in large, printed letters.
PRECISION IS NOT ACCURACY!
The standard deviation of the sample means is only a measure of how precise you can calculate their average. It is *NOT* a measure of the accuracy of that mean unless you assume all error is random and cancels. Any text that you have that says the standard deviation of the sample means is the uncertainty of the mean has assumed that all random errors cancel out. And that is *exactly* what you assume – every single time.
“And continuing to miss the point. This was you claiming that statisticians thought that random errors completely cancel out, but now you shift to systematic errors, which of course don’t even partially cancel out.”
No shifting at all! As both Taylor and Bevington say, all measurements contain some systematic error. There are simply no perfect measuring instruments in existence in this universe!
Thus, when you assume that the stated values of a measurement have no uncertainty you *are* ignoring that basic fact of life!
The *ONLY* way to assume the standard deviation of the sample means determines the ACCURACY of the mean, as almost all statisticians do – including you – is to also assume that all error is random, Gaussian, and that it all cancels out!
You simply cannot run away from that. It is part and partial of everything you post.
You are just incapable of holding onto an argument here. You said “You think it is just peachy to assume all error cancels out (i.e. it is all random) and everything will come out 100% accurate in the end.”
I pointed out that is not something I believe and brought up the example of the standard error of the mean to show that even if “it is all random” it still would not mean I believe for any finite sample that all errors would cancel out. For some obsessive reason, you seem to think that means I’m saying that all errors are random, when I’m actually saying that your premise is wrong even for random errors.
“No shifting at all! As both Taylor and Bevington say, all measurements contain some systematic error. There are simply no perfect measuring instruments in existence in this universe!”
Yet they still show you how to propagate uncertainties as if they were all random. Do you think they are saying all errors cancel?
“The *ONLY* way to assume the standard deviation of the sample means determines the ACCURACY of the mean, as almost all statisticians do – including you – is to also assume that all error is random, Gaussian, and that it all cancels out!”
Or to understand that it is only an approximation, and doesn’t need to rationalized to an infinite degree. As i keep saying, if you are taking a sample, then the sampling error is the main problem. You hope that any measurement error is small compared with the differences between value, and you would hope that any systematic measurement error would be even smaller.
If you are using an average to get a better measurement using the same instrument over and over again, then yes, you might need to take into account the possibility of a systematic error. How you do that I don;t know. Your the expert here. But I’m guessing that doesn’t mean you just ignore all your measurements on the grounds that there may be some unknown systematic error.
More whining. Pull that foot out of your oral cavity, it is unsightly.
” I brought up the standard error of the mean to illustrate that they don’t assume that.”
“Show me one comment where I have claimed that if you measure something with ruler that is an inch too long, that it will give you a true value.”
When you bring up standard deviation of the sample means as being the uncertainty of the mean, as almost all statisticians do, you *are* assuming all stated values are 100% accurate – even if they might be off by an inch or more as an example.
Are you willing to admit that the standard deviation of the sample means is *NOT* the uncertainty of the mean if there are systematic error involved?
And if you are willing to admit that then explain why you accept climate scientists using standard deviation of the sample means as the uncertainty of their average calculations rather than propagating the data uncertainties.
Most statisticians DO assume all errors cancel out.
Give us a textbook you have used that discusses how to treat statistical parameters where each and every data point has a +/- uncertainty range and how to calculate what that does to the mean AND the standard deviation, along with the skewness and kurtosis. Give us a book that shows how to treat non-Gaussian distributions where each and every data point has a +/- uncertainty range.
I will bet that you can’t find a statistics book taught in the math department at any university that deals with this. Taylor and Bevington are the only textbooks I have that deal with this issue and they are used in the physical science departments, physics, chemistry, engineering, etc.
(DELETED)
(You need to stop making angry replies with name calling) SUNMOD
“Well that’s progress. Originally you were insisting that uncertainty of the mean increased with sample size for random errors. “
Nope! That’s why I gave you EXACT quotes from both Taylor and Bevington that all measurements have systematic error.
You can’t even get this straight!
https://wattsupwiththat.com/2021/02/24/crowd-sourcing-a-crucible/#comment-3193098
If you didn’t intend the errors to be random, whey were you adding the uncertainties using the sqrt(100)?
You ignore the part where I say that even if the errors are all systematic the uncertainty of the mean does not increase with sample size.
You add the uncertainties of data elements with both random and systematic error as root-sum-square. see Taylor Chapter 3!
Taylor says *SOME* cancellation can occur in such a situation SOMETIMES! You have to use judgement as to whether you directly add the uncertainties or whether you use root-sum-square.
You are only showing that you have never truly studied Taylor and done the exercises in his book. You just cherry pick equations that you think might support your position without really understanding the context that goes along with them.
Dipping into your enemies’ file again?
It was a public comment. Not something hidden on his laptop.
” Again how many times have I talked with you about different distributions. What I have said is that if you are taking the average of the sample it’s in order to estimate the true value of the average.”
Except this is *ONLY* true if you have a Gaussian distribution and all error is random. Something you said you don’t do but then turn around here and do it again!
You just can’t help yourself, can you?
“Except this is *ONLY* true if you have a Gaussian distribution and all error is random.”
And I disagree. You just keep assuming that if a distribution isn’t Gaussian any mean does not exist.
‘And I disagree. You just keep assuming that if a distribution isn’t Gaussian any mean does not exist.”
Nope, I assume the mean is meaningless. If you have a skewed distribution then you typically must use the five-figure descriptive values for the distribution not the typical descriptive values of mean and standard deviation. Those distributions must be treated differently.
The mean of a multi-modal distribution is meaningless as well. Try taking all medium T-shirt sizes to the local farmers market and see if you can sell them all. The problem is that shirt sizes are a multi-modal distribution. The average and standard deviation simply don’t adequately describe the distribution.
It’s the same if you have a pile of 2″x4″x4′ and 2″x4″x8′ studs. The average is meaningless. NONE of the boards will ever equal the average. It’s a bi-modal distribution that is not adequately described using the typical descriptive values of mean and standard deviation!
The fact that you can’t get this into your head simply tells me that you are a troll. I tire of trying to educate you. At some point I’m just going to stop and let you demonstrate your ignorance for all to see without me correcting you!
“Nope, I assume the mean is meaningless.”
Then that’s a bad assumption.
“If you have a skewed distribution then you typically must use the five-figure descriptive values for the distribution not the typical descriptive values of mean and standard deviation.”
Again you shift the argument to skewed distributions. Do you think the means of non-skewed non-gaussian distributions are also meaningless?
I’m not saying the mean is always the best descriptive statistic, just that the mean is not meaningless.
Could you please come up with some better toy examples than t-shirts and wooden boards?
“I tire of trying to educate you. At some point I’m just going to stop and let you demonstrate your ignorance for all to see without me correcting you!”
I wish you would. Then I wouldn’t have to spend so much time correcting your corrections.
You’re an idiot.
HTH
Irrelevant, your knowledge of the subject is zero, and acquisition of real knowledge is blocked by your brick wall of preconceived nonsense.
“You just keep asserting that, but never demonstrated what the global temperature distribution is.”
Judas H. Priest! You can’t even admit that when it is summer in the NH that it is winter in the SH! You can’t admit that temperature variance (i.e. anomalies) is greater in the winter than in the summer! Both of these create a multi-modal distribution when you combine them!
“I do disagree that an average of a multi-modal distribution is useless.”
I want you to buy a bunch of T-shirts in one size and go to a local farmers market and try to sell them. Then come back and tell us if you sold them all – or even most of them! Are you willing to try?
“ a mean does not have to tell you what a particular mode is to be useful. If the question is are two populations the same, then knowing the means are significantly different is sufficient to tell you they are not the same.”
Did you *actually* read this before you wrote it? How do you get multiple means out of a multi-modal distribution?
“Judas H. Priest! You can’t even admit that when it is summer in the NH that it is winter in the SH!”
Why would I deny it, it’s true. You keep putting words in my mouth.
All I asked is that you explain what you think the temperature distribution of the globe is, and more importantly what the distribution of the anomalies. I’m not saying it isn’t multi-modal, I’m saying I don’t know what it is. Just pointing out it’s hotter in the north than in the south during July doesn’t tell me what the distribution is.
I’m also saying it doesn’t matter to the question of what the global average is.
“I want you to buy a bunch of T-shirts in one size and go to a local farmers market and try to sell them. Then come back and tell us if you sold them all – or even most of them! Are you willing to try?”
And I want you to disappear up your own non sequiturs, but I doubt ever of these things are going to happen.
What on earth does stocking only one size of t-shirt have to do with the mean of a multi-modal distribution? Nobody is saying that the mean global temperature is the only temperature on the globe.
“How do you get multiple means out of a multi-modal distribution?”
You take two samples. If the means are significantly different you conclude they probably came from different populations.
Regarding global temperatures, if we want to test the hypothesis that the world is warmer than it was, we can compare the mean taken 40 years ago, with the mean taken today. If they are significantly different the temperatures of the world at those two points was also probably different. More usually, we look at the trend of monthly averages, each a sample from the world in that month, and see if there has been a significant change over time. It makes no difference if the monthly average came from a normally distributed planet, or something that was 50% molten and 50% in a deep freeze. The fact that the average had changed is enough to tell us the global climate has changed.
Then why do you think any kind of an average from a bi-modal distribution actually means anything?
Exactly. You don’t know that when it is winter in the SH it is summer in the NH! Which is directly contradictory to your statement above!
“I’m also saying it doesn’t matter to the question of what the global average is.”
Meaning you think the average of a multi-modal distribution is meaningfull.
See the attached image from statology.org:
The best way to handle bi-modal distribution is to break them up and analyze them separately! Meaning a global average reached by cramming the SH and NH together gives you a meaningless average.
But you simply won’t accept this, will you?
“What on earth does stocking only one size of t-shirt have to do with the mean of a multi-modal distribution? Nobody is saying that the mean global temperature is the only temperature on the globe.”
That one size should be the average size of a multi-modal distribution! In your opinion the average of a multi-modal distribution has some use. What *is* the use you get from the average?
“You take two samples. If the means are significantly different you conclude they probably came from different populations.”
Yes. So why would the average obtained from cramming the two samples together into one distribution tell you anything useful?
“Regarding global temperatures, if we want to test the hypothesis that the world is warmer than it was, we can compare the mean taken 40 years ago, with the mean taken today. “
If the average of a multi-modal distribution is meaningless then what does comparing an average from 40 years ago to today tell you? Does it tell you which mode might have cause a change? Does it tell you in any form or fashion what the change might have been? Did all the modes change? If you don’t know what caused the average to change then of what use is the averages or the differences of the averages? If the SH hemisphere caused all the change would it make any sense to apply some corrective action to the NH?
If you don’t know what happened then how to you make any kind of judgement on what action to take?
It would be far better to analyze each of the modes separately so you can determine *exactly* what happened where! And that would lead to choices that have far better outcomes!
At least for most of us it would lead to better choices. You would just take the typical government path and do some kind of one-size-fits-all approach. Just like with T-shirt sizes.
“Then why do you think any kind of an average from a bi-modal distribution actually means anything?”
Because I think it does. That does not mean I believe it’s winter in both hemispheres at the same time. These are two different things.
“See the attached image from statology.org:”
It says the mean or median is not useful in that instance. It doesn’t say not meaningful. Usefulness depends on the context.
I notice that you have gone from saying all statistical texts are useless because they don;t specifically mention measurement uncertainty, to accepting something from a make learning easy website as gospel.
“Meaning a global average reached by cramming the SH and NH together gives you a meaningless average.”
I’m still waiting for you to demonstrate that monthly global anomalies are from a multi-modal distribution.
But know, again I don’t think that would make them useless. They very fact you can see trends in data shows it is not meaningless.
BFD, your opinion is worthless.
“I’m still waiting for you to demonstrate that monthly global anomalies are from a multi-modal distribution.”
Didn’t you just agree that it can’t be winter in both hemispheres at the same time? That means you get two different modes when you cram them together.
The variance on anomalies in winter are greater than in summer. Go look it up.
This you are trying to cram two distributions with different variances together.
I liked MGC’s example. If you took the height distribution of men and women separately, in 1500, you would end up with a bimodal distribution of men and women’s heights. If you did it every year until now, you would end up with ~523 of them. But if you trended the average of both men and women, you would see us get taller over time. I.e., a trend of averages from bimodal distributions that imparts real info.
Separately, the standard error of a trend, with uncertain y data inputs, increases with the changed standard error of the y estimate, from consideration of data confidence intervals. It can be calculated by simply finding the additional variance of the y estimate (sey^2) introduced by those data confidence intervals. So, total standard error of the trend seems equal to standard error of the trend using expected y values*((sey^2+additional variance from confidence intervals)/sey^2))^.5.
No, I have yet to find this in a book. But bootstrap results are dead on. As for the statistical durability of the pause interval, with UAH6 data, and +/-0.2 degC, I have not yet checked. My guess, the expected value standard error is
Evaluating such short, statistically/physically insignificant periods is silly, and I commend you for avoiding doing so.
Said it B4. For the statistically/physically significant data periods now under consideration, these confidence intervals change nada. This is why Pat Frank avoids actually evaluating the standard trend errors for the data in his 2010 paper. for which he slammed in ridiculous confidence intervals. I used his intervals and showed that the statistical durability of those trends was increased, but were not qualitatively changed.
“That one size should be the average size of a multi-modal distribution! In your opinion the average of a multi-modal distribution has some use. What *is* the use you get from the average?”
There’s a big difference between knowing what an average is and assuming everyone is average size. Your argument has nothing to do with the distribution, it would be just as wrong if T-shirts formed a normal distribution to only stock the average size.
Honestly, I could come up with far better examples of the danger of multi-modal distributions. You obsession with T-shirts makes no sense.
“If the average of a multi-modal distribution is meaningless then what does comparing an average from 40 years ago to today tell you?”
That’s my point, the fact you can get results from comparing averages of multi-modal distributions shows that they are not meaningless. Thanks.
“If you don’t know what caused the average to change then of what use is the averages or the differences of the averages? If the SH hemisphere caused all the change would it make any sense to apply some corrective action to the NH?”
a) the first step is knowing that something has changed.
b) knowing this you can drill down into the data to see how much each hemisphere has changed. You can also seen where in each hemisphere the biggest changes have happened, which places are going in the opposite direction etc. As I keep telling you, taking an average does not mean you wipe all the data, you still have all the data but also an average.
Here is a map from GISS showing trends since 1979. See how you can tell where the world has been warming and where it has been cooling. Nothing’s been lost in tracking an average.
“) the first step is knowing that something has changed.”
In a multi-modal distribution all kinds of changes can happen without you knowing as long as the changes in the different modes offset within the uncertainty interval of the average. Even here you can’t get away from your internalized mathematician bias about uncertainty always cancels.
Yes, if the mean changes you know something has changed. If the mean doesn’t change you cannot be certain that nothing’s changed.
If the change is within the uncertainty interval how do you know the mean changed?
As usual your assumption is that there is no uncertainty – a climate scientists assumption.
If the mean is 59 +/- 1 and the mean value is now 60 +/- 1 did the mean actually change?
*YOU* think it does because all you can ever see is 59 and 60 because you always ignore uncertainty.
If the hypothetical changes are within the uncertainty intervals then you probably haven’t got a statistically significant change. It was a hypothetical example to show how means can be useful. It’s hypothetical, I can make any assumption I want. The assumption here was that there had been a significant change.
You strawmen are getting really tedious. No statistician ignores uncertainty. Statistics are very much about how to detect a real difference in the face of variability.
Your problem is you only ever see variability in terms of measurement error, when in general that’s only a very small part of variability.
More preconceived nonsense.
And who is “us”? SkepticalScience?
Those are not just independent ways of measuring a common object they are two different measurement quantities. Thermometers measure the kinetic energy of molecules in a microclimate. Satellites measure the luminance at various altitudes. There is no expectation that they will ever agree or disagree.
The GAT calculations don’t even follow proper random sampling techniques. The random variables are supposed to be representative of the whole population. There is no way each random variable, i.e. individual station, is representative of the entire population of measured temperatures. It is more akin to non-probability sampling.
If you are declaring these to be samples, then calculating an error of the mean by dividing by N or even the √N is meaningless. The standard deviation of the the sample sample means IS THE ERROR OF THE MEAN! You can’t divide it by anything, just to get a better number. You have never shown a reference that describes anything different than SEM = σ / √N. Where σ is the POPULATION Standard Deviation and N is the sample size. I’ve given you NIH papers on this yet you continue to ignore them.
Significant digit rules are commonly ignored in calculations for climate science. The calculation of anomalies is especially egregious about this. You totally ignored what Kip Hansen told you about old temperature measurements. Plus or minus 2 degrees would be minimum. They are also recorded in integers. That means ANY AVERAGE using those measurements (including baseline) MUST be in integer form also. That includes daily, monthly, annual, anomalies, and multiyear averages.
I have never been in any physical lab – physics, chemistry, electronic, even surveying that allowed an average of samples to exceed the precision of the original measurements. I’ll post this again from Washington University: (bold by me)
You would better spend your time trying to understand how anomalies from 1900 can possibly achieve precisions in the 1/100ths of a degree from calculations that should be done only in integers.
“Those are not just independent ways of measuring a common object they are two different measurement quantities.”
Which, as I keep saying, is why it’s remarkable that they give such similar results.
“The GAT calculations don’t even follow proper random sampling techniques. The random variables are supposed to be representative of the whole population. There is no way each random variable, i.e. individual station, is representative of the entire population of measured temperatures. It is more akin to non-probability sampling”
This constant shifting from the general to the specific is tiresome. I was explaining how the need to talk about standard errors shows that statistics does not consider all uncertainties cancel. What has that got to do with how you might want to calculate global average temperatures. I’ve always said that the global anomaly calculations are not a random sampling, that’s why you don’t just average them.
Whiner.
“If you are declaring these to be samples, then calculating an error of the mean by dividing by N or even the √N is meaningless.”
The uncertainty of global anomlies are not estimated by taking the sample deviation and dividing by root N. It’s much more complicated than that, you’d have to check the specific methods.
“The standard deviation of the the sample sample means IS THE ERROR OF THE MEAN! You can’t divide it by anything, just to get a better number.”
You don’t divide the standard error of the mean by anything. I still don;t think you understand how this works.
” You have never shown a reference that describes anything different than SEM = σ / √N. Where σ is the POPULATION Standard Deviation and N is the sample size. I’ve given you NIH papers on this yet you continue to ignore them.”
I don’t know what difference you want me to show. That is the standard way to calculate the SEM, though more usually you estimate it from the sample standard deviation.
My memory isn’t that good, so you’ll have to remind me what the NIH paper was and what point you want me to take from it.
It might be one explaining the distinction between standard deviation and standard error of the mean, and use the most appropriate one. I’ve never disagreed with that.
Irony Alert! Level 13!
Seriously – do you think anyone here appreciates this constant barrage of irrelevant comments? You seem to have developed some obsession with me, commenting on every single post I make, which would be fine with me if you every actually had something to say. But 200 odd posts saying nothing but “idiot” or “stop crying” or some such doesn’t seem like a healthy use of your time, and just clogs the time line for everyone else.
“Significant digit rules are commonly ignored in calculations for climate science.”
Good. As I’ve said before I think they are not the best way of showing uncertainty. Taylor I think says the same.
“The calculation of anomalies is especially egregious about this. You totally ignored what Kip Hansen told you about old temperature measurements.”
I’m bombarded with hundreds of comments, and then told I’m ignoring a point if I don’t waste the entire day responding to every point. I’ve heard lots of nonsense about decimal points in reported anomalies and treat them with the contempt they deserve. You just end up with people claiming you should only report monthly anomalies to the nearest integer.
“That means ANY AVERAGE using those measurements (including baseline) MUST be in integer form also.”
See what I mean. I’ve explained too many times why this is wrong. But if you don’t like working in fractions, just do your own rounding. Always better to report more digits that are needed than too few.
“See what I mean. I’ve explained too many times why this is wrong. But if you don’t like working in fractions, just do your own rounding. Always better to report more digits that are needed than too few.”
Which is why you would never make it as a physical scientist or an engineer.
As an engineer you would get people covered with dirt.
“See what I mean. I’ve explained too many times why this is wrong. But if you don’t like working in fractions, just do your own rounding. Always better to report more digits that are needed than too few.”
I seldom down vote comments because I don’t think it is useful. But, I had to this one.
Your statement is a blatent acknowledgement that you don’t understand measurements and the information that is conveyed by them.
There is a big reason Significant Digit rules are used with measurements. They are an acknowledgement that the measuring device has a finite resolution and can only convey a given precision for any measurement.
You CAN NOT extend precision by averaging. Standard Error of the Mean DOES NOT provide any information relating to the precision of the data. In fact, the SEM should have similar Significant Digits as the measurements.
Adding Significant Digits to measurements by mathematical manipulation is fraud. It conveys that you know information that was not available in the actual measurement. It is in essence saying you used equipment that had a higher resolution than was actually used.
I’ll repeat this statement again. It is pertinent to all measurements, temperature anomalies included.
http://www.chemistry.wustl.edu/~coursedev/Online%20tutorials/SigFigs.htm
You should explain why this doesn’t apply to anomalies calculated from integer values.
“You CAN NOT extend precision by averaging. Standard Error of the Mean DOES NOT provide any information relating to the precision of the data. In fact, the SEM should have similar Significant Digits as the measurements.“
This is patently false, and calling it fraud is an insult to any data scientist and statistician. Even Tim says that the SEM is a measure of the precision of the mean.
Look at Taylor, for instance. He explains the rules for significant figures, but also says they are not his preferred method. The GUM doesn’t even mention these “rules”. The better rule is to work out the uncertainty, express it to a sensible number of digits, and write the result to the same decimal place.
I’ve pointed out to you before where Taylor breaks your “rule” on only reporting averages to the same number of places as the measurements. Section 4.5, Area of a rectangle. Measurements made to hundredths of a mm, average given to the thousandth of a mm. He only rounds the result at the end, in keeping with the rules for quoting uncertainty. His result is 1221.2 ± 0.4 mm^2. If he’d truncated the length and breadth before multiplying the result would have been 1222.0 mm^2.
All sources allow the retaining more digits for the purpose of calculations, and all monthly anomaly data is going to be used for calculations. I find it astonishing that anyone thinks it a good idea to throw away data before using it. Either it affects the result or not. If not there’s no harm, and if it does, why would you assume your truncated data gave a better result than the full data?
You didn’t read Taylor very accurately. All of the measurements of length and breadth were to two decimal places. And, he did keep and extra digit in the calculations to prevent rounding errors. Nothing wrong with that as long as the final answer retains the appropriate number of Significant Digits.
But, here is what you missed. (24.245 x 50.368) = 1221.1726.
He then rounds this value to 1221.17 doesn’t he? I wonder why? Is it to keep the same number of decimal places as the original measurements?
Lastly, he rounds the answer to 1 decimal place as 1221.2 +/- 0.4 mm. Any idea why he ended up with only 1 decimal place when the original measurements had a precision of 2 decimal places? I know but can you determine why?
So his values follow this process:
1221.1726 –> 1221.17 –> 1221.2
Interesting huh? Golly gee Sergeant (Gomer Pyle), why would you not have 4 decimal places in the final value?
All your questions were answered in my comment.
He rounds the final answer to 1dp because the uncertainty was 0.4. if the uncertainty had been 0.0004 then he would quote 4dp.
Taylor says to only quote the uncertainty to 1 sf unless the first digit is a 1 or possibly a 2. Others suggest using more digits. Bebington iirc says to use 2sf and the GUM just says not to use to many figures. Regardless, none are saying it’s best to use the simplistic significant figure rules you insist on.
He retains extra digets for calculation, as I said, to avoid rounding errors. This is why I prefere all the data I use not to be prematurely truncated.
But have you thought about the logic of avoiding rounding errors? You insist that the 3rd decimal place should not be used as it isn’t certain to be correct, yet you accept you may get a different result if it’s not there. do you think the result with rounding errors is worse than the one without? The fact that you are trying to avoid rounding errors implies the values with 3dp are more accurate then those with 2dp.
Go back and read it again. He rounds it to 2 decimal places, the same as the measurements, as I said. “1221.17” He then rounds it to a single decimal place after propagating the uncertainty. When it came out to be 0.36, he rounds it to 0.4.
You didn’t read my post very well did you? Here is what my post that you answered said. This is exactly what I’ve said all along.
And my question was why do you think the rounding errors are errors if the 3dp intermediate results aren’t better than the results rounded to 2dp?
Do you not understand what Significant Digits portray in terms of information? Adding decimal places to a measurement is creating new information and is fraudulent. Read this statement from Washington University.
What do you think “compromise the INTEGRITY” means? To an engineer, this is fundamental to meeting ethical requirements of proper design for safety.
Using guard digits is standard practice to prevent rounding errors in multi-step calculations. It doesn’t claim to make the number more precise. Read this succinct explanation in Wiki.
Guard digit – Wikipedia
You are not adding digits to the measurement. You are showing the full result of your calculation. It is not creating new information, just showing information that is already there. That doesn’t mean all the information is useful of accurate, but it is not fraudulent.
Your chemistry web page does not say you cannot show an average to more than decimal places. It says beyond what you have measured. If you measure 10 things to 1dp, you have measured the sum to 1dp, and so the mean to 2dp. If the sum of 10 things is 123.4, then that sum divided by 10 is 12.34. This is not adding any new information, it is not pretending to have measured something you haven’t.
“It says beyond what you have measured. If you measure 10 things to 1dp, you have measured the sum to 1dp, and so the mean to 2dp.”
If you have only measured to 1dp but state your result to 2dp then you have gone beyond what you have measured.
What have you measured? You haven’t made one measure to 1dp, you’ve measured 10 things to 1dp. Their sum to 1dp contains all the information about those 10 values. The sum divided by 10 still has all that information to 2dp. You have gained no new information, if you round that to 1dp you have lost information. You have not gone beyond what you have measured. The second decimal is defined by what you have measured.
You just keep making up things. You referenced Taylor’s treatment of significant digits. It shows that the uncertainty requires proper evaluation. You need to learn why he ended up using just 1 decimal place when his measurements had a resolution of two decimals.
As for your example, you include no standard deviation or standard uncertainty. It is impossible to provide a answer.
I have given you a reference. You have referenced Dr. Taylor for another. I will provide a some others here. If you want to argue more about them you must show references that support your position. The reference must deal with MEASUREMENTS.
https://www2.chem21labs.com/labfiles/jhu_significant_figures.pdf
https://web.ics.purdue.edu/~lewicki/physics218/significant
https://wee.sciencegeek.net/APchemistry/APpdfs/SignificantFigures.pdf
You can find others on your own.
Tim ==> Nice statement on the Averaging issue — which I have tried for years here to get across….
Carlo ==> Hard to know the motives of others — by their measurements, as published, the Earth is still desperately trying to get up to the NASA-temperature-standard for an Earth-like planet of 15º C.
“Uncertainty in the numbers do not necessarily carry over to the trends of the data set…that is another topic altogether.”
“necessarily” is a rather undefined term. If the trend is calculated from data values using linear regression and those data values can individually take on various values (i.e. different values within their uncertainty interval) then they will affect the trend of the data set unless -and it is a big unless – the uncertainties of the data values are significantly less than the residuals of the trend line compared to the possible values in the data uncertainty intervals. More succinctly – the uncertainties of the data values are insignificant. That is not likely with *any* temperature measurements, including those using today’s measurement devices.
I tested this by taking the UAH data and slapping a random error on each monthly anomaly using a normal distribution with sd = 1.7.
I’ve attached a random graph showing what this looks like, with the actual UAH data in red.
The slope for this enhanced data set is 0.19 °C / decade, with a standard error of 0.06 °C /decade. It’s still statistically significant.
I repeated this 10000 times and on average the slope is 0.133 °C / decade, pretty much the same as UAH slope, and the standard deviation of all slopes was 0.060 °C / decade.
My conclusion is that with enough data, even unrealistically large amounts of uncertainty can still detect a significant trend more often than not.
“random error on each monthly anomaly using a normal distribution”
And once again, here you are *ASSUMING” a normal distribution! *EVERYTHING* to you is a normal distribution. It’s what most statistics books teach! And its a bias you can’t seem to shake!
You didn’t create error bars! Look at the graph I sent you one more time. You can get a trend line of slope = 0, slope = negative, and slope = positive out of the same stated values +/- uncertainty!
What you did is just create 1000 data points and did a linear regression on them. IT’S NOT THE SAME THING!
“And once again, here you are *ASSUMING” a normal distribution! ”
Give me strength!
I ASSUMED the errors were normally distributed for the sake of an experiment, just as I assumed the standard uncertainty was 1.7°C. It doesn’t mean either of those two things are correct, but I expect a normal error distribution is more likely than errors in the range of ±3.4°C.
“You didn’t create error bars! Look at the graph I sent you one more time. You can get a trend line of slope = 0, slope = negative, and slope = positive out of the same stated values +/- uncertainty!”
Again, I think you’re using some simplistic introductory method of describing trend lines. It is not what I’m doing. I’m calculating the ordinary least squares trend, the same method Monckton uses to determine his pause.
The point of my experiment was to show that even with very large random errors, much bigger than the actual monthly variance, you can still get a reasonable result.
What you want to do, as i understand it, is to assume the true trend could start at the top of the first uncertainty bar, and finish at the bottom of the final one, or vice versa. But this is highly implausible with random uncertainties. It would require a set of errors that moved progressively in the same direction throughout the last 40 years. If that were the case there’s something seriously wrong with the UAH data.
“What you did is just create 1000 data points and did a linear regression on them. IT’S NOT THE SAME THING!”
No. I created 10000 sets of data each having 520 random errors attached to each of monthly UAH values. I calculated the trend for each of the 10000 sets separately, and checked the standard deviation of this set of trends. This provided an estimate of the standard error of the trend.
So just to keep Tim happy I did the same experiment, but this time assuming a uniform error distribution ±3.4 °C. Even less plausible graphs, but the mean slope was 0.134°C / decade, with a standard deviation of 0.069°C / decade.
Going completely over the top, I tried again with errors from a Poisson distribution with sd = 1.7.
Result, mean slope 0.135 °C / decade. Standard deviation 0.059 °C / decade.
It’s remarkable how it’s possible to detect a trend even in the noisiest of data, given enough data points.
“It is not what I’m doing. I’m calculating the ordinary least squares trend, the same method Monckton uses to determine his pause.”
You are *not* using uncertainty of the values you create. You are creating a data set and then assuming those stated values are 100% accurate – just like you always do!
And then you create a trend line from that assumed 100% accurate data!
No I’m not. I’m assuming the stated UAH values are correct, and then seeing what it would like like if you attached random errors to the correct value. The data Incorrect is assumed to be very wrong. What I find is that even with these very wrong values it’s still generally possible to detect the trend.
Where are your systematic errors? What percentage of each individual uncertainty is random error and what percentage is systematic?
As usual you are assuming all error is random and cancels so you can assume the stated values are correct. You didn’t vary the values through the uncertainty intervals assuming the stated values are *incorrect*. Your experiment is poorly designed – which is to be expected because you have no understanding of the fundamentals.
How do you think systematic errors would affect the trend?
How about making it too high or too low?
They increase the uncertainty interval thus increasing the possible values for each data point thus increasing the possible slope values for the trend line.
You HAVE to get over assuming the stated values are 100% accurate. The actual values of each data point can be anywhere in the uncertainty interval.
I take it you’ve read chapter 8 of Taylor. He describes exactly how to do a least square regression, including how to calculate the uncertainty of the slope. You know that he doesn’t do what you claim, draw a line from the top of the uncertainty range to the bottom. He doesn’t need to know the uncertainty intervals at all. He just uses the variation in the measurements.
Again, you are cherry picking with no understanding. Here is a quote from the very first paragraph in Section 8.1.
I hate to keep harping on the fact that one must understand the assumptions and requirements of some of these tools. It is why a teacher is required to learn. Either that or a student must also do the problems presented and know how to solve them.
The trends you are drawing do not rely on a relation of temperature to time. At least I hope you are not trying to say that a specific temperature is based on calendar time. What you are dealing with is known as a time series and normally require different tools to analyze. Look up time series analysis to find a multitude of information.
I hope you remember me posting several times that most of information in Taylor, Bevington, and the GUM rely on a mathematical functional relationship between variables in order to properly propagate uncertainty. From the GUM:
(bold by me)
Graphs of temperature vs time are NOT a graph of functionally related variables. They are time series. It is why pauses are so important. They indicate that there is no relationship based on time. Too many climate scientists like to use time as a proxy for CO2 since CO2 has been increasing over time. But pauses indicate that time is not an appropriate proxy for CO2. Time series analysis is required to validate a connection. Would you like to bet that CO2 concentration lags temperature increases which means temperature increases are caused by something other than CO2?
Another deflection. Tim keeps saying you need to know the uncertainty of the measurements to know the uncertainty of the trend, and that the only way to estimate the uncertainty is to draw straight lines from one side of the uncertainty range to the next. I show that even his beloved Taylor shows how this is not true, and you immediately throw another dead cat on the table. Try to turn this into some bizarre claim that Taylor doesn’t allow linear regression to be used with time series.
I’ll say this again, up front; if you don’t agree with using OLS regression with time series, stop cheer leading for Monckton when he does it, or you’ll make yourself look a hypocrite.
“I hate to keep harping on the fact that one must understand the assumptions and requirements of some of these tools.”
You keep doing it though, and it makes you look a fool as you never understand them.
“the mathematical relationship between two variables”
Which is exactly what we are doing with a time series. Time is a variable and we want to see if there is a mathematical relationship between time and another variable, in this case temperature. If there is such a relationship we conclude that temperature is changing with respect to time. This does not mean you are saying time is causing the change, any more than noting how the position of an object changes with time means you think time is causing the object to move.
“At least I hope you are not trying to say that a specific temperature is based on calendar time.”
I am saying it’s related to it.
“What you are dealing with is known as a time series and normally require different tools to analyze.”
You keep trying to pass yourself of as an expert on time series, yet you don’t know you can use linear regression to analysis a time series?
Dude, you are lost in the forest without a trail of breadcrumbs to find your way out.
I didn’t say that. I said Dr. Taylor’s book deals with uncertainty in regards to variables that have a functional relationship. Things like PV=nRT, h = 1/2 gt^2, A = lw,
There is no functional relationship, i.e., equation, that relates temperature as a dependent variable of time. Therefore, Dr. Taylor’s tools to find uncertainty in temperature simply do not apply.
I have attached a paragraph (as an image) used in course notes from the University of Oklahoma, Dept. of Physics and Astronomy. It shows pictorially what the error in trends needs to include in order to capture uncertainty in the data. The document is available at:
Error and Uncertainty (ou.edu)
I don’t claim to be an expert. I have however dealt with forecasting for many years in my main career. I spent 30+ years in the telephone industry engineering equipment, people, and budgets using data to forecast future requirements. I learned early on to be skeptical of regressions. Walking into the future is fraught with unknowns, especially when dealing with cyclical data.
Here is a good article on time series analysis. You should read it.
(1) New Messages! (influxdata.com)
From the article:
(bold by me)
You’ll notice CM does not attempt to extend his linear regression beyond the data already known. There is a reason for doing this. In order to make proper predictions, one must use time series analysis to insure the data is stationary, seasonality is removed, and autocorrelation is dealt with. So basically, saying temperatures are warming and will continue to do so into the future at some constant rate is not appropriate.
“Therefore, Dr. Taylor’s tools to find uncertainty in temperature simply do not apply.”
They are not Taylor’s tools. They are the tools used across multiple disciplines for multiple reasons. You can use them to measure a supposed physical relationship, assuming the only errors are due to measurements, or to test a hypothesized relationship exists in highly variable data, or just ot tell if something on the whole has been getting warmer over time.
Just because Taylor uses them for one purpose does not mean they are invalid for all other purposes.
Yes, there are lots of assumptions in them, which is why you need to correct for issues like auto-correlation in time series. But these assumptions are not that you assume al measurements are correct as Tim says, not that there can be no variations apart from measurement errors as you seem to be implying.
You should be skeptical about regression and any other type of modelling, but that doesn’t mean you should just reject any trend you don’t like. And again, I don;t know how you square this skepticism about regressions, with talk of seven year pauses based entirely on (bad) linear regressions, or on the claim that you can prove everything is cyclic because you can model ENSO using sums of sine waves.
“Therefore, Dr. Taylor’s tools to find uncertainty in temperature simply do not apply.”
I should have said “tools to find uncertainty in temperature versus time simply do not apply because there is no relationship between the two variables.
Why do you think something like postal rates correspond with CO2 growth? You can plot them on the same graph with time as the x value. Do you think there is a functional relationship there?
A mathematical relationship means you can substitute a value for x and determine a given y value. It doesn’t change, it doesn’t vary. Each and every value for one independent variable will provide you with one and only one value for the dependent value. That just doesn’t exist in a time vs temperature graph.
If y is the temperature and x is the time you can not find a value for temperature when given a specific time. That means it is not a functional relationship.
I feel like I am tutoring you in Algebra 1 here.
Just look at Dr. Taylor’s velocity equation.
v = v0 + gt^2.
For each and every point in time, there is one and only one value for “v”. There is a mathematical relationship. Show me one for temperature vs time!
And you’d still be wrong. You keep ignoring everything I say, so there’s little point continuing – but again, there is a relationship between time and temperature, and nothing in linear regression requires the relationship to be deterministic, physical or functional.
Here are a couple of links I could find that mention the distinction between deterministic and statistical relations.
https://online.stat.psu.edu/stat415/book/export/html/875
https://www.rhayden.us/regression-models/statistical-versus-deterministic-relationships.html
Of course not. Unless US postal rates are changing continuously through time there can’t be. And if you mean is there a causal relationship, again the answer’s no. But is there relationship between CO2 and time, and is there a relationship between postal rates and time? Yes.
Again, there doesn’t have to be. You keep falling into the trap of assuming that is something is used for one purpose it cannot be used for another.
I also think you are hung up on the term “functional relationship”. By definition any time series is a functional relationship as there can only be one value for that moment in time. That does not mean there has to exist a simple mathematical formula to describe it.
And yet one more time – if you think linear regression cannot be used to see what something like global temperatures are doing over time, you need to point this out to Monckton every time he posts his monthly linear regressions showing the trend over the last few years, or at least stop claiming this proves anything.
You don’t read with alacrity do you?
“I should have said “tools to find uncertainty in temperature versus time simply do not apply because there is no relationship between the two variables.”
What do you think “TOOLS TO FIND UNCERTAINTY” means?
It doesn’t mean you can not determine a linear regression on whatever you wish.
It does mean Dr. Taylor’s tools for propagating uncertainty DO NOT APPLY when there is no functional relationship! The GUM says the same thing in Section 4!
Here is what your second link says.
“From the examples cited in Section 1.2, the reader will notice that in regression analysis we are concerned with what is known as the statistical, not functional or deterministic, dependence among variables, such as those of classical physics. In statistical relationships among variables we essentially deal with random or stochastic4 variables, that is, variables that have probability distributions. In functional or deterministic dependency, on the other hand, we also deal with variables, but these variables are not random or stochastic.”
Do you understand what the last sentence says? Do you know why Dr. Taylor made this distinction of functional relationships rather than just saying it applies to any linear regression of anything? If so, you should be able to state the reason! HINT: the words, probability distribution.
The best fit line is measured by the residuals. That is *not* the uncertainty of the slope, it is how closely the line fits the data values used to create the trend line. It assumes the stated values are 100% accurate! It assumes all error is random and cancels. That is *not* a valid assumption in the real world. Read Taylor again. Write down the restriction Taylor requires for the data.
“It assumes the stated values are 100% accurate! It assumes all error is random and cancels.”
Which one is it?
Read Section 8.4, uncertainty of the Constants A and B
B is the slope.
This is not the uncertainty of the residuals. Taylor does not assume the stated values are 100% accurate, he assumes there are measurement errors.
The only difference between this chapter in Taylor and any normal statistics book is that he assumes the only variation in the dependent variables is from measurement uncertainty. This is a reasonable assumption give the sorts of things he’s measuring. But in the real world you usually have bigger variations caused by other factors, and the measurement uncertainties are of little interest. But the maths and the principles are the same.
Look at the attached image from Dr. Taylor’s book. I told you in a prior post that Ch. 8 deals with a functional relationship between two measurements.
To make a short point, that means you are trying to say the Temperature (y-axis) is a function of Time (x-axis). That is ridiculous on its face.
Read the sentence that says:
“Unfortunately, many different notations are used for a linear relation; beware of confusing the form (8.1) with the equally popular y = ax + b.
Just because a linear regression provides an equation in the format y = mx +b doesn’t mean that the (xn, yn) pairs that it forms describes a functional relationship between the two variables.
You are cherry picking something that looks familiar but has no applicability at all.
This is why folks that graph log CO2 concentration against temperature can’t claim it is a linear relationship; you need non-linear feedback to make it possibly work. It is also why pauses are so damaging.
When you’re in a hole, quit digging.
“Read the sentence that says:
“Unfortunately, many different notations are used for a linear relation; beware of confusing the form (8.1) with the equally popular y = ax + b.”
What do you think Taylor means by that?
All he is saying is that there is more than one way of writing the equation of a line and you should be careful not to confuse the characters.
You continually read far to much into some word or phrase, and then claim it proves you can not use linear regression for anything you don’t approve of.
A linear relation is a functional relation, and linear regression will find the best fit for a given linear model. It does not mean there has to be a physical relation between the variables – hence the constant mantra that correlation does not imply causation.
You didn’t even go back and read this section for understanding did you? Of course you didn’t or you wouldn’t be asking this question!
Dr. Taylor then gives examples of functional relationships.
v = v0 +gt
l = A + Bm where l = total length, A = unloaded length, and B = g/k.
THIS CHAPTER ISN”T JUST ABOUT DRAWING A STRAIGHT LINE THROUGH A BUNCH OF POINTS THAT HAVE NO MATHEMATICAL RELATIONSHIP BETWEEN THE INDEPENDENT AND DEPENDENT VARIABLES.
This chapter is about treating uncertainty in a linear relationship and how it can affect a linear regression of the relationship. Why do this? So one can make accurate forecasts of the dependent values for similar interactions.
I don’t think you are prepared to say that there is a constant linear relationship between time and temperature. If you are, then good luck in showing your proof. Meteorologists everywhere are waiting.
“. But in the real world you usually have bigger variations caused by other factors, and the measurement uncertainties are of little interest. But the maths and the principles are the same.”
Really? Measurement uncertainties are of little interest in the real world?
Only someone who has never been in a personal liability situation could possibly make such a statement!
Tell the design engineer and construction supervisor of the next bridge you drive over this and see what they say!
Putting words into my mouth again. No, I said that when you are dealing with complicated data, rather than laboratory measurements where it’s possible to isolate just a single factor, there are many reasons for variations besides measurement errors, and that measurement errors are likely to be small compared with the other causes of variation.
When you are dealing with complicated data, then it is even more incumbent on you to identify the variables that need to be measured and their relationships and then make sure each and every one is measured to the desired resolution.
You realize that you just created a random distribution, right? What do you think would happen?
You start with a normal distribution, i.e., equal + and – values, then add “random” numbers to that, i.e, random errors. What do you think you would get in return.
I added a random distribution to the UAH data. I wasn’t sure what would happen, that’s why I did the experiment. According to Tim if the uncertainties are larger tha n the variation, or if they are not normal it should be impossible to see a trend. This experiment suggest otherwise.
I did not start with a normal distribution and add random values to it. I started with the UAH data and added random values to each monthly value from a random distribution. I also repeated it with two non-normal distributions.
Don’t quit your day job.
According to Monckton this is my day job.
In other words you just added offsets. What did you think would happen?
As I said, I wasn’t sure what would happen. That’s why I wanted to put it to the test.
Tim ==> Don’t quite get your meaning. (It’s late in the evening for me…might be my fault.)
With temperature records, uncertainty really gives us a “range” in which each the “true” value of that one data point ought to be found. The wider the range and the smaller the delta that makes up the trend, the range might well reverse direction.
That’s not quite what I was getting at but its close. See the attached graph. Sorry it’s so messy, I just free-handed it.
Basically you can get a negative slope, zero slope, or a positive slope out of the stated values +/- an uncertainty interval depending solely on where you choose to put the “true value” for each data point within its uncertainty bar. It shows that you can’t simply do a linear regression of the stated values and say the result is the “true trend”. You could even get a second or third order regression line if you wanted!
Tim ==> The ignored reality is that using the uncertainty RANGE instead of the precise numbers is often a better statement of fact.
https://wattsupwiththat.com/2021/03/07/mind-over-math-throwing-out-the-numbers/
Tim ==> The original question being discussed here is in regards to a 130 year graph of GMST…..it is the earlier parts of the data set that produce the worrisome overall trend — and that earlier part of the data set is highly unreliable with error bars as great or greater than the claimed delta (change) in the GMST over the same time period…..
Yep. Which means you could have a positive trend, a zero trend, or a negative trend – you simply can’t tell. Bellman and the so-called climate scientists try to get around the issue by just ignoring the uncertainty of each data point and assuming all stated values are 100% accurate – even if they have to adjust the stated values to get what they want.
Tim ==> Yes, I produced a boatload of graphs with my best guess uncertainty bars added and long records are show to possibly be flat.
The original question was the uncertainty on UAH. UAH only goes back a little more than 40 years. The GMST is evaluated with different datasets that have different uncertainty estimates.
bdgwx ==> I refer to “There is no analysis that properly gives the true uncertainty given the diversity, variability and the unknown quantity and quality of the original measurement errors for the thermometer record.” (with Bellman ) and “The original question being discussed here is in regards to a 130 year graph of GMST…..it is the earlier parts of the data set that produce the worrisome overall trend” (with Tim)
You are butting in randomly in other people’s conversations.
Ah…my apologies then.
bdgwx ==> No worries….
Yes! Anything prior to 1980 should not have anomalies with decimal points. The lines used to plot them should be +/- 0.5 units wide centered on integer values, i.e. a 1 degree range at best. Temperatures that were measured and recorded to the nearest tenth should have lines centered on 0.1 lines and should be +/- 0.05 wide.
I’ll paraphrase here. Representing a measurement to more precision than what was measured is faulty science.
Jim Gorman ==> You Tim’s brother?
That is what I am wondering now.
Yes. We are brothers. Both BSEE’s.
Jim ==> As I thought, the secret society BSEEs.
Something like this, only uglier?
Something like that.
JG said: “Yes! Anything prior to 1980 should not have anomalies with decimal points. The lines used to plot them should be +/- 0.5 units wide centered on integer values, i.e. a 1 degree range at best.”
According to Rhode et al. 2013, Lenssen et al. 2019, and Morice et al. 2021 the type B evaluation of uncertainty on monthly anomalies in 1980 is about ±0.05 C for BEST, GISTEMP, and HadCRUT. I did a type A evaluation and got about ±0.07 C. I know you won’t accept this. I’m posting for the benefit of the WUWT audience.
You need to show folks how you get an anomaly with two decimal places from measurements that have none.
Basically you are taking a temperature that is measured and recorded as something like “58” and subtracting a number from an average that may or may not have decimal places.
Something like:
58.00
– 57.66
——–
0.34
Do you see what you’ve done here. You have added two decimals to the original number by averaging, thereby artificially increasing the number of Significant Digits in the result. That IS CREATING NEW INFORMATION THAT WAS NOT MEASURED. You have gone from 2 Significant Figures as measured and recorded to 4 Significant Digits in your mathematical calculation of the average. To be correct, the 57.66 value should be rounded to the same number of Significant Digits as the original measurement, i.e. 58.
The only other option is to add one decimal digit in order to minimize rounding errors. Your average would then be 57.7. You would still end up with a difference that would round to an anomaly value of “0”.
Violating Significant Digit rules is the only way for your method of computations to achieve that level of resolution that you quote.
Is it that hard for you to see that if your measurements are in integers then the temperature differences (anomalies) must also be in integers?
Uncertainty of the trend is meaningless. It is merely an indication of how well the trend line fits the stated values. It totally ignores the uncertainties that go along with the stated values. The trend line can be any slope as long as it stays within the uncertainty bars associated with the stated values. Meaning there is no way for the trend line to have an uncertainty of +0.05C/decade.
It is important to understand that the Christy et al. 2003 +0.05 C/decade figure includes more than just regression uncertainty. The regression uncertainty is ±0.007 C/decade. You can verify this with Excel’s LINEST function.
So what? When you speak of “+0.05 C/decade (95%) for the trend” you *are* speaking of the fit of the trend line to the stated values of the data – while ignoring the uncertainty of the data.
As has been explained to you over and over ad nausem, the uncertainty of the data cannot be decreased using averaging. There is simply no way that the measurement devices, which are measuring different things at different times, have an uncertainty of 0.05C. No way. Therefore the trend line can not have any less.
Control freaks are promoting hysteria about a 1.5 C increase from an arbitrary level in the 1800s.
Just sine 2016, the temp has dropped by almost 3/4s of a degree.
they should be celebrating.
” Just sin[c]e 2016, the temp has dropped by almost 3/4s of a degree. ”
Apos, but… that’s not quite what I understand under ‘subtle’.
Because the 2016 anomaly was the highest in UAH’s 43 years of data.
How then could we get any positive trend since then?
What will you tell us if after years of heat storage in the Pacific Ocean through La Niña, the next El Niño suddenly bypasses 2016?
“What will you tell us if after years of heat storage in the Pacific Ocean through La Niña, the next El Niño suddenly bypasses 2016?”
It’s called “NATURAL VARIATION”.
Do you really think I need your explanations?
Why don’t you simply stop to teach all the time?
I perfectly know that.
The flattening of the smoothed line is next. The oceans and sun said so.
Does anyone other than Eskimos even notice that the global temp is up about .6 degrees over the past 40 years?
It seems to me that in the northern hemisphere the cold weather period is shifting to April. Perhaps it has to do with the fact that the Earth is closest to the Sun in orbit in January. As far as I remember, in Poland in April several decades ago higher temperatures.
In 2019 there was a severe cold snap in mid-April in Colorado that k!lled all fruit tree blossoms. The famous Western Slope-Grand Valley peach crop was a total loss.
How then can ag scientists be finding that the growing season is lengthening and not shortening? Is warm weather shifting to September and October to offset the move of the cold weather to April?
There has been a slowdown in sea ice melt in the north since late March.
As usual, ren cherry-picks, by intentionally showing a tiny part of the Arctic regions which fit his permanent need to show ‘cooling’.
This is the entire northern hemisphere, not “part of it.”
https://nsidc.org/data/masie/masie_plots
And this is the central part of it.
Bindidon
So correction, this is all cake with a cherry.
Oh apos! I misunderstood this important ‘slowdown in melting’. My bad.
Here is this wonderful slowdown in a somewhat bigger context
and now put in relation to the whole thing (in anomaly form, as the same stuff as absolute values isn’t very legible):
We view the same thing in a different way.
Bindidon
It is a good idea to read the content of the comment carefully before criticizing it. If it is not clear enough, I will repeat it in Polish.
Instead of unnecessarily teaching, it would be better for you to look at my graphs, to compare them with yours and to draw some useful conclusion concerning how short are the periods you observe.
Oldanalyst
Maybe you start counting how much people live all around to Pole between 60 N and 82.5 N, from Alaska till East Siberia?
Alone the ‘cold’ UAH 6.0 LT measures there 0.25 °C / decade, with a very high bias due to ice.
How much, do you think, does it look like at the surface?
appears most consistent with models predicting an ECS around 1.2 to 1.7
so depending on what carbon sinks do, most likely the current linear satellite-era trend continues, with no acceleration, through around 2050 to 2070
and of course tens of trillions of dollars in wasted mitigation effort in the meantime, causing more excess deaths than all the wars of the 20th put together
after that the wobbly long-term equilibrium random walks until the next big volcanic activity ends our fragile interglacial, and our civilization too if we’re not smarter by then
deleted
A friend of mine (PhD, Geophysics) has generated a visualisation of the temperature trend for 2016-2022 (60 months), and combined it with the visualisation of the CO2-trend. The underlying data sets were:
HadCrut5.0.1.0: https://www.metoffice.gov.uk/hadobs/hadcrut5/data/current/download.html
CO2: https://gml.noaa.gov/ccgg/trends/gl_data.html
Conclusion: Temperature-trend light falling:
Can you do the same graph but instead of UAH TLT use oceanic heat content (OHC)?
Dear Mr. bdgwx,
The graph is based on the HadCrut-Data and on the CO2-Data from NOAA. To be open: For these reasons we simply don´t understand your comment/question.
And what does any of this have to do with an atmospheric CO2 level of only 1/24th of one percent of atmosphere? That level can be described as insignificant as far as having any noticeable effect on global air temperature.
I also believe that using any temperature record that does not include the years from the 1880’s until the present is not sufficient as a basis for discussion of the causes of global warming. I see too little emphasis on temperature patterns over that period and too much emphasis on short-term climate events. I further believe that the field of astronomy is not being given sufficient attention in discussions of the cause or causes of global warming.