Guest Essay by Kip Hansen — 31 March 2022

SciTech Daily proudly announced on 27 March 2022:
“On March 22, the newest U.S.-European sea level satellite, named Sentinel-6 Michael Freilich, became the official reference satellite for global sea level measurements. This means that sea surface height data collected by other satellites will be compared to the information produced by Sentinel-6 Michael Freilich to ensure their accuracy. “ ….
“These missions, of which Sentinel-6 Michael Freilich is the latest, are the gold standard when it comes to sea level measurements, which are critical for understanding and monitoring climate change,” said Josh Willis, Sentinel-6 Michael Freilich project scientist at NASA’s Jet Propulsion Laboratory in Southern California.”
“Long-term records of sea level height are key to monitoring how much, and how fast, the oceans are rising in a warming climate. “We can’t lose track of how much sea level has gone up because if we do, it’s hard to predict what’s going to happen in the decades to come,” Willis added.”
“The unprecedented accuracy of the sea level measurements provided by this mission ensures not only the continuity of a 30-year data record, but allows improving our understanding of climate change and the impact of rising seas on coastal areas and communities,” said Julia Figa Saldana, ocean altimetry program manager at the European Organisation for the Exploitation of Meteorological Satellites (EUMETSAT).”
The measurement (sort of) of sea level by satellite telemetry began in late 1992 with the first TOPEX/Poseidon satellite, followed by Jason 1, 2 and 3. There were a few other short term satellites involved but NOAA gives us this graphic version:

Charting the data from the .csv file for that same graphic in Excel gives us this:

The two charts give quite a different visual impression.
In the top chart displayed by NOAA, the data “have been smoothed with a 4-month boxcar filter.” I have no idea why this is being done, but in January 2020, I discovered the fact in personal communication with Eric W. Leuliette, Branch Chief, NOAA’s Laboratory for Satellite Altimetry. He kindly added a note to this effect at the top of the NOAA web page which displays the graph.
In the Excel-produced chart from the data file, we see a lot of variability, particularly in the Topex data, with the variability narrowing in later missions. This graphic also is more linear. The last 15 months look like this:

The last four data points show a drop in sea level of 8 mm, which may be the seasonal drop in the Northern Hemisphere winter.
The press release quoted at the beginning claims “unprecedented accuracy of the sea level measurements provided by this mission”. If this is meant to refer to the new satellite, Sentinel-6, then we can compare this to the accuracy of the previous Jason missions. For the Jason missions, the technical specification for original measurement error in the altimetry function of Jason’s 1, 2 and 3 of +/- 3.4 cm. [Ref: Jason-3 Products Handbook, Section 2.3.1, pg 10 ], with a hope that this new requirement could “enable reduction of sea-surface height errors to 2.5 cm RMS.” Now, understand that that is the specified requirement for accuracy of each and every single surface height measurement by the Jason missions. That range means that every measurement made must be guaranteed to be within a band 6.8 cm wide, 95% of the time. Let’s be clear, that 6.8 cm is 20 times the size of the signal (change) claimed to be found between many of the individual GMSL data points in the NOAA data file. If one looks again at the Excel-produced graph of the data file, we see that the individual data points for Topex themselves have a month-to-month range of 20 mm, which signifies that if we add the specified allowable uncertainty range, we have a total accuracy range of 88 mm (about 3.5 inches). In the latest missions, this figure is reduced (through lower month-to-month variability) to about 73 mm (2.9 inches). Summarizing, the expected combined standard uncertainty for Jason 1-3 was +/-3.4 mm giving a total range of uncertainty for the data set of about 73 mm – about 3 inches — in present time.
Note: This last assumes that the range must include the variability – which some may disagree with – but it follows from the logic that the sea surface height is not physically changing rapidly enough (in the ten days between data points) to produce differences as great as 3 mm, thus the variability recorded must be in the measurement itself, thus must be considered as adding to the total uncertainty.
Is the new Sentinel-6 mission designed to do better than that?
To find out, we must look to the “Sentinel-6 Mission Requirements Document (MRD)” (located via the web page “S6 altimetry reference documents” at EUMETSAT).
Quoting that document: [ inches added ]
“10.3 Requirements on the Near Real Time altimetry product service (ALT-NRT) ”For average sea states, the combined standard uncertainty of the 1-Hz sea surface height measurements shall be less than 5.79 cm [ 2.28 in ] for LR ALT-NRT products and less than 5.65 cm [ 2.22 in ] for HR ALT-NRT products. Note: The goal for the combined standard uncertainty is 3.46 cm [ 1.36 in ] for LR ALT-NRT products and 3.35 cm [ 1.32 in ] for HR ALT-NRT products.” NRT = Near Real Time, ALT = Altimetry, LR = Low Resolution, HR = High Resolution Combined standard uncertainty should be notated as +/-.
So, Jason 1-3, combined standard uncertainty spec’d at 3.4 cm with a hope of getting to +/- 2.45 cm. Sentinel-6 spec’d to 5.79/5.76 cm with a goal of 3.46/3.35 cm. There is, of course, the question of definitions in both specifications, but I think it would be fair to compare Jason’s 3.4 cm with Sentinel’s goal of 3.35 cm – giving Sentinel-6 a not-so-large 0.5 mm improvement over a 6.8 or 6.7 cm range. So, improvement is improvement – but that is less than 1% better.
Where there will be improvement though is in the joining the new Sentinel measurements with the previous Jason measurements. How this is being done, according to the SciTech press release, is this:
“Later this year, teams will move Jason-3 into what’s called an interleaved orbit. From that new position, the ground track – or the strip of Earth that Jason-3’s instruments see as the satellite travels around the planet – will run in between the ground tracks of successive orbits for Sentinel-6 Michael Freilich. Jason-3 will keep measuring sea level height from the interleaved orbit, although it will no longer serve as the official reference sea level satellite. But by continuing to collect sea level data, Jason-3 will essentially double the number of measurements seen by each pass of Sentinel-6 Michael Freilich, helping to greatly increase the spatial resolution of sea level measurements provided by both satellites.”
So, in the real world, we will have a new satellite that has the same expected combined standard uncertainty as the existing Jason-3, but there will be an opportunity to compare adjacent measurement tracks as a side check confirmation.
That said, the late Nils-Axel Mörner published a paper in 2004 which sharply criticized the methodologies of satellite sea level rise measurements – and R. Steven Nerem et al. of the CU Sea Level Research Group fired back years later with a comment, followed by Mörner responding very politely. I wrote about the exchange here at WUWT 4 years ago. That essay lists many of the corrections and adjustments and confounders that must be taken into account in all satellite sea level measurements. Many of the confounding factors are not only uncertain but unknown and unknowable – thus unmeasured, thus merely “best guesses”.
Just to give one example, again from the Sentinel-6 Mission Requirements Document:
10.2.1 Significant wave height measurement performance Because extremely low and high sea states are rare and wave buoys are not operating well in these conditions, it will be hard to validate significant wave height measurements outside of the range of 0.5 to 8 m [ 19.7 to 315 in ]. Hence, the requirement below is restricted to that range. However, it is required that the altimeter is able to measure up to wave heights of 20 m, and that its performance at extreme sea states will be determined during commissioning.For all ALT Level 2 products, the uncertainty of 1-Hz measurements of significant wave height in the range of 0.5 to 8 m shall be less than 15 cm plus 5% of significant wave height.Note: The goal is 10 cm plus 5% of significant wave height.

Why is this significant? They cannot calculate sea surface height without adjustment for the wave heights. Waves that range from almost-nothing to 20 meters. They think they can get a good idea of wave heights between 0.5m and 8m with a goal for uncertainty of “10 cm plus 5% of significant wave height”. Outside that range, apparently all bets are off. How much uncertainty is that if waves are 8 meters? That’s 10 cm plus 40 cm = 50 cm = 0.5 meter = about 20 inches. To be perfectly fair, that is +/- 50 cm. How is it that they adjust for that much uncertainty – a whole meter in unknown surface height? (Admittedly, not that exactly, that’s the bottom-to-top of the waves, the sea surface height is somewhere between.)
Bottom Line:
1. There is a new satellite up that, among other things, will measure sea level rise. It is in reality no more accurate than the previous sea level rise monitoring satellites, the Jason series, but it will continue the long-term effort begun in late 1992.
2. Sea Level changes measured by satellite and reported in single digit millimeters are the result of computational hubris:
Computational Hubris: “An inordinate and unjustified trust, or faith if you like, in the power of advanced computational machines and processes to produce highly accurate and extremely precise results from relatively inaccurate and imprecise, highly uncertain data using techniques and methods that have not been tested nor verified to be suited to, or sufficient for, the purpose.” — Kip Hansen
3. Satellite reported Sea Level Rise is not a measure of changes in the actual level of the sea surface – or sea surface height — or its rise or fall, at all. Quoting the Sea Level Research Group at the University of Colorado, which is headed by Steven Nerem:
“The term “global mean sea level” in the context of our research is defined as the area-weighted mean of all of the sea surface height anomalies measured by the altimeter in a single, 10-day satellite track repeat cycle. It can also be thought of as the “eustatic sea level.” The eustatic sea level is not a physical sea level (since the sea levels relative to local land surfaces vary depending on land motion and other factors), but it represents the level if all of the water in the oceans were contained in a single basin. Changes to this eustatic level are caused by changes in total ocean water mass (e.g., ice sheet runoff), changes in the size of the ocean basin (e.g., GIA), or density changes of the water (e.g., thermal expansion). The time series of the GMSL estimates over the TOPEX and Jason missions beginning in 1992 to the present indicates a mostly linear trend after correction for inter-mission biases between instruments.” [ source – see last paragraph ]
4. The 3.0 mm of satellite reported annual sea level rise does not show up as a rise in absolute mean sea level at the world’s GPS-corrected tide gauges which directly measure mean sea surface height at each location. (Absolute sea level represents the sea surface height relative to the center of the Earth – meaning an actual rising of the sea surface upwards.) This reality-based fact is as yet unexplained and is a controversial topic.
5. The ONLY sea level, or its rise or fall, of any importance to any locality or its governmental bodies is Local Relative Sea Level. This sea level rise (or fall) caused by rising absolute sea level rise combined with vertical land movement (in most instances, downward) determines the magnitude of any risk or threat from sea level rise for that location.
6. Many localities which have valuable infrastructure built on land only a few inches or feet above existing mean sea level for their location are already at risk of flooding by spring tides and storm surge and need to initiate changes in building codes and begin mitigation immediately. The sea will continue to rise, ever so slowly.
7. Finally, almost everything about sea level rise is controversial and readers should turn their critical thinking skills knob up to FULL when reading anything, including this essay, on the topic.
# # # # #
Author’s Comment:
Josh Willis’ comment to SciTech caught my attention. He said: “We can’t lose track of how much sea level has gone up because if we do, it’s hard to predict what’s going to happen in the decades to come.”
How would it be possible to “lose track” of sea level rise? The sea is just there. Sea level is where its surface hits the land all around the world. If it rises, we will see it rise. It is not something that is hidden and thus, if we turn our backs for a decade or so, can be lost track of. That is unless it is something so small and inconsequential that we’d miss it without satellites telling us that it is rising. As the metric GMSL-as-measured-by-NOAA is only 3 millimeters a year, wouldn’t it be enough to measure it once a decade? Then, ten years from now, we could expect to see a 30 mm rise – about 1.2 inches….and if it rose at an alarming 4 mm a year, 40 mm or 1.5 inches. And if SLR doubled? We’d see about 60 mm or 2.4 inches of rise.
That’s true only if satellite measured Eustatic Sea Level rise actually arrives at our shores, our harbors, our bays and inlets. To date, it hasn’t.
Unless you are just making a general comment, remember to say who you are talking to: Like “Kip, I think….”
Thanks for reading.
# # # # #
“These missions, of which Sentinel-6 Michael Freilich is the latest, are the gold standard when it comes to sea level measurements, which are critical for understanding and monitoring climate change,” said Josh Willis,
___________________________________________________________
If you’re unfamiliar with Dr. Josh Willis:
What a knob.
josh would be more convincing if he was sporting a man bun and a european man purse.
I forgot to add this web page from several years back:
Correcting Ocean Cooling
I am not in a position to judge the merits of Dr. Willis’s work. But it is worth noting that terms like “climate crisis” or “climate emergency” aren’t alarming enough for his taste. He calls global warming the “Apocalypse.”
https://wattsupwiththat.com/2017/05/21/climate-scientist-josh-willis-shows-you-how-to-deal-with-your-climate-change-denying-uncle-but-fails/
I’m sure the EPA was thinking “Apocalypse” in 1983 when they talked about 10 feet of sea level rise. The streets of climate science are littered with failed predictions.
blob:https://wattsupwiththat.com/c0deaacb-ff36-4966-aba8-4bf47ea65143
Try again.
Cerescokid ==> Thanks for that — for readers, the article is from May 1, 1983 in the Baltimore Sun.
Define “several”. There is a “could” as always.
Curious ==> The article is a typical SLR exaggeration, from 1983.
The exact same statements are being made in present time, 29 years later.
None of Florida is underwater, seas did not rise “a few feet” or ten feet.
Nor will they.
2939 years later…🙂Rick ==> What?!? I made an error…can hardly believe.
PS: Thanks — I have never been good at time elapsed between two dates…
Kip, the trick is to eat 2 dates at a time, then there is no time elapsed between the 2 dates.
(:
Mr. ==> When I was a kid, I could stuff up to five dates in at a time…..
I bet it sucked when the others found out.
De seeded of course !
Don ==> You imply a degree of intelligence I may not have had…..
Just as I was feeling much younger…
So this article reports on a “draft” of a study. Is there a link to the final study? Or was it never done and this was simply “science by press release” by the EPA?
Patrick ==> Thanks for asking even if it is only of historical interest.
The original report can be read at:
https://nepis.epa.gov/Exe/ZyPURL.cgi?Dockey=9101HEAX.TXT
Thanks.
Properly educated people choose their words in their disciplines carefully in order to convey information without raising undo alarm about possible future events. This is because they realize that no one can predict the future and it serves no purpose to introduce bias into the conversation.
Educated people with agendas to promote do exactly the opposite each and every time. This is because they realize that they can influence you into believing bias in the conversation, which is their prime objective.
Doonman ==> Advocacy in place of logical discourse.
Funny. I wonder if Dr. Willis knows that the word apocalypse is from the Greek word which means “revelation, disclosure”.
Steve ==> Thanks for that link == justification and adjustment…..
Interesting that Josh Willis and international researchers collaborated for a number of years to ‘to resolve the ocean cooling problem’ and ‘correct it’. This whack-a-moley climate science is rife. When they get warming in their research, they never think to investigate it for a moment. Indeed they’ve engaged in p-hacking to induce a warming signal from uncooperating data. From their good work that stinking ocean will never cool again.
Gary ==> Reanalysis is the tool used to find more pleasing results. remember, these guys are mostly really trying to figure things out but are constrained by the pressures of group-think and consensus enforcement.
“Correcting Ocean Cooling”
Ah yes, the fools who prefer using joules instead of Celsius because:
Kip’s excellent “Computational Hubris” definition fits “Correctional Ocean Cooling” work perfectly.
Do not ever forget, he apologized for not finding more heat in his first Argos presentation….
ARGO was real too, showed cooling, until Josh started “adjusting” it !
What a lie spewing f*cktard. And stealing my money to spew his lies
“We can’t lose track of how much sea level has gone up because if we do, it’s hard to predict what’s going to happen in the decades to come,” Willis added.”
I thought they didn’t do “predictions.” oh, wait…they do predictions except when they don’t, er, they don’t do predictions except when they do…I’m so confused.
Phil R ==> Their predictions just do not align with reality. Shame that.
Surely, sea level measurements have to be taken along with any isostatic rebound to make sense?
“The rising up of the solid Earth’s surface can reach to more than 10 and 14mm per year (mm/a) in the Bothnian Gulf, between Finland and Sweden, and in Hudson Bay, in north-east Canada, respectively, and still continues.”
https://www.diva-portal.org/smash/get/diva2:1180484/FULLTEXT01.pdf
If sea level rise was 3mm per year and isostatic rebound was 5mm per year….
.
The good news is the Maldives etc haven’t sunk – yet.
fretslider ==> “Isostatic rebound” is real thing and is sen in the US quite clearly along the Alaskan southern shore. There, Relative Sea Level is dropping because the VLM of the land is positive (upward) faster than absolute sea level is rising.
The other part of isostatic rebound is that each continent has a “hinge point”, south of which the land is moving downward. For the United States East Coast, the hinge is about at Boston, MA. South of Boston, VLM is downward, adding to apparent sea level rise.
Kip, I get it’s real that why I flagged it up.
Thanks for expanding on hinge points
fs
But doomcasters seems to forget that the planet is like a water filled balloon. If there is Isostatic rebound in one place, it has to go down somewhere else maybe on the other side of the world….for a “net zero”….yet calcs cater to allowing for ISR wherever sea level is apparently falling and little mention where it is rising, unless it is really obvious. This eventually causes an adjustment of the baseline for each new satellite so that it can continue the old satellite readings.
The isostatic calcs just aren’t as accurate as the sea level guys want everyone to believe. They actually back calculate a viscosity of magma under the crust, which they don’t know, to make their numbers work out, then say their theory is validated because the numbers work out. Quite self serving, possibly correct in principle, maybe inaccurate.
And the sea level measurements just aren’t as accurate as the sea level guys want everyone to believe.
Retired ==> They are not accurate at all — certainly not at the millimeter scale.
DMac ==> Vertical Land Movement (VLM) is measured today with Continuously Operating Reference Stations (CORS) — highly accurate GPS.
When tide gauges are “corrected” with generalized GIA data, it is worthless.
GPS is not accurate within inches.
Even the official government usage of GPS is at plus or minus feet most of the time. That is, highly accurate GPS s within several feet.
And they arrive at that estimated accuracy by averaging repeated multiple satellite time variances. Of course when you are deploying bombs, that accuracy is good enough.
ATheoK ==> In fact, to be accurate to millimeters the requirement is more than a year of continuous measurements. Snay preferred at least two years to cover two seasonal cycles.
Of course the numbers work out. Even with ‘pal review’ they might have difficulty getting published if the numbers didn’t work out.
I’m suspicious that the Carbon Cycle numbers are similarly adjusted to make the case for mass-balance. That is, all the estimated natural annual fluxes cancel out, leaving only the measured MLO ~2 PPM imbalance, which is attributed to humans.
Clyde => As you know, all satellite sea surface height anomalies are based on the unexamined assumption that long-term global SLR is 18 mm/yr.
NOTE: As Andy points out below, this is a typo — it should be 1.8 mm/yr — one point eight
kip,
Where does eighteen mm/year come from?
AndyHC ==> That is a typo — it is 1.8 (one point 8) millimeters a year.
Thanks for catching that.
My God! If this isostatic rebound isn’t stopped, Gotlanders will be able to just walk into Finland! The humanity…..
Has anyone used these satellites to check the stability of say a stable piece of land which can be surveyed. Will it work? No waves, no tide, just stability.
Bill ==> Yes — this is a major area of research. See the NOAA CORS project site:
https://geodesy.noaa.gov/CORS/
It is worth noting that measurement of sea-level by satellite altimetry has many problems, which do not afflict coastal (tide gauge) measurements.
Most obviously, the satellites only measure sea-level far out to sea. They cannot measure sea-level at the coasts, where it matters.
Also, satellite measurement records are generally only about a decade long.
Also, those measurements have proven to be disturbingly malleable. The very same data can show acceleration, deceleration, or linearity, depending on how it is processed! Here’s an example from a 2014 paper, which turned apparent deceleration into linearity, by changing (“correcting”) the measurements.
A subsequent paper then turned the linear trend into an acceleration, via more corrections:
The 2012 Envisat revisions were especially striking:
A widely-hyped 2018 paper by U. Colorado’s Dr. Steve Nerem et al claimed to have discovered “acceleration” in the satellite altimetry measurement record of sea-level. They did it by reducing the rate of measured sea-level rise in 20 year-old Topex-Poseidon data, thereby making more recent measurements appear to have accelerated, by comparison. H/t Steve Case for this graph:
For additional information about sea-level measurements by satellite altimetry, see:
https://sealevel.info/satellite_altimetry.html
In contrast to the satellite measurements, most tide gauge (coastal) measurements continue to show little or no acceleration in sea-level trend in the last nine decades or more.
https://sealevel.info/MSL_graph.php?id=Harlingen&boxcar=1&boxwidth=3
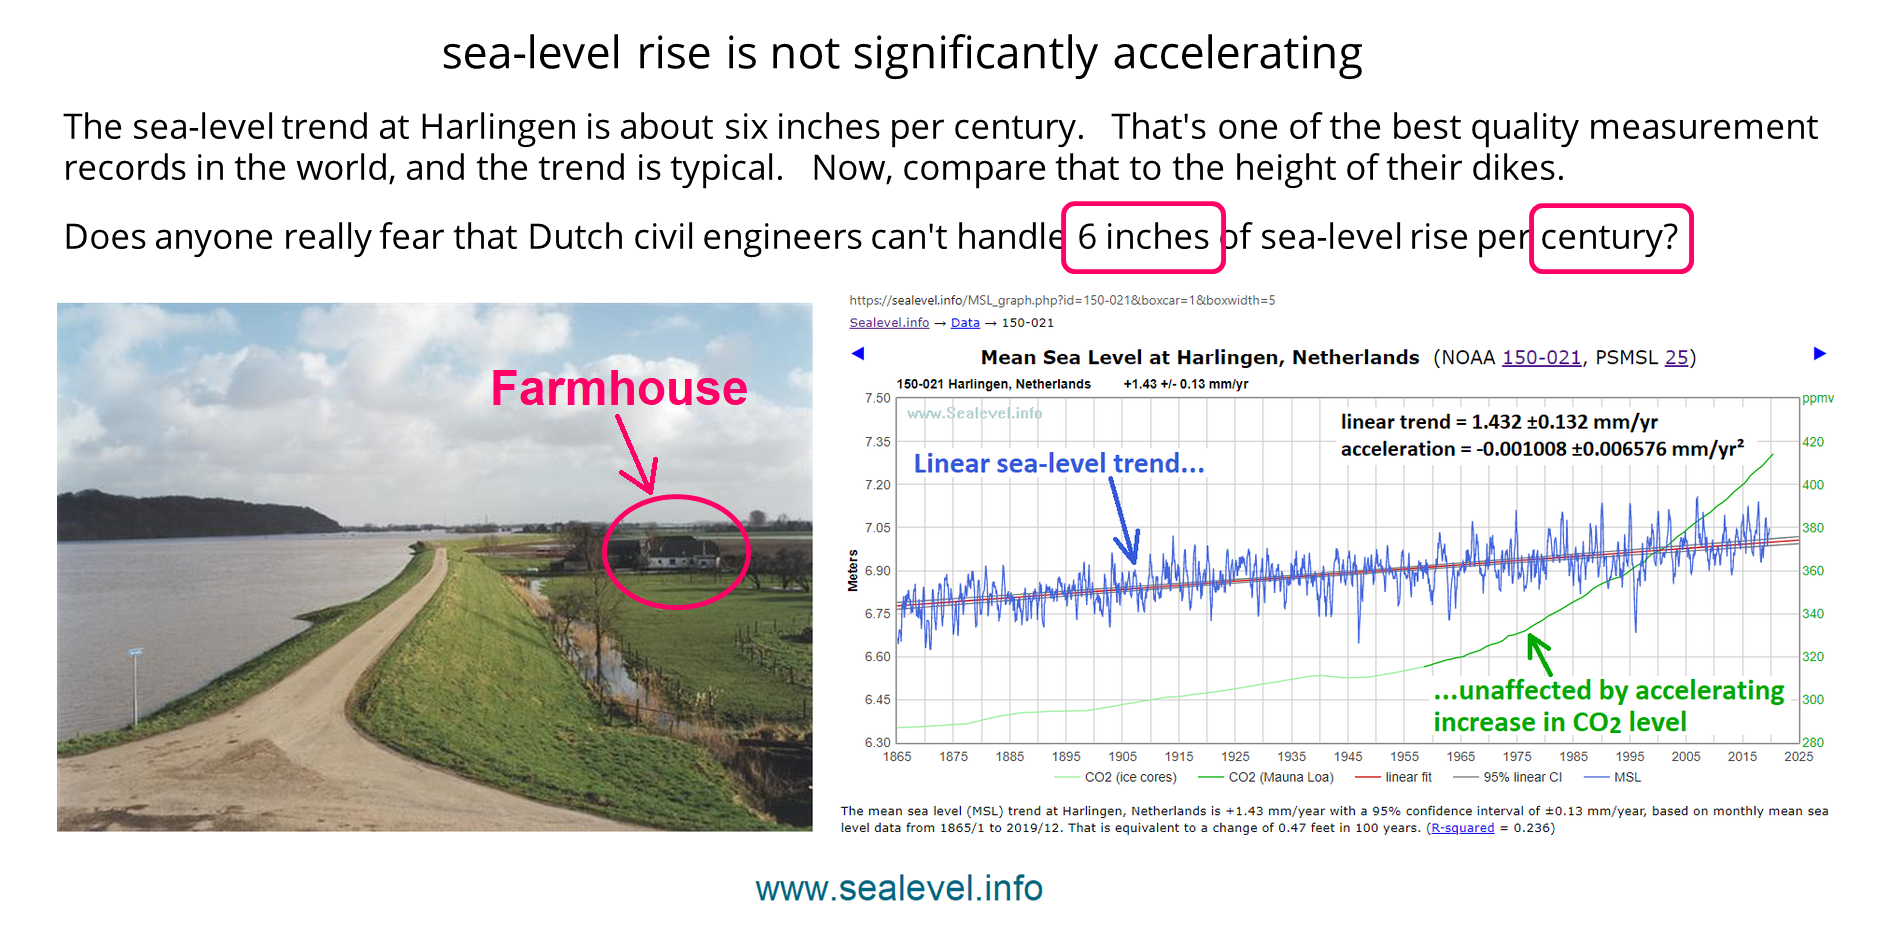
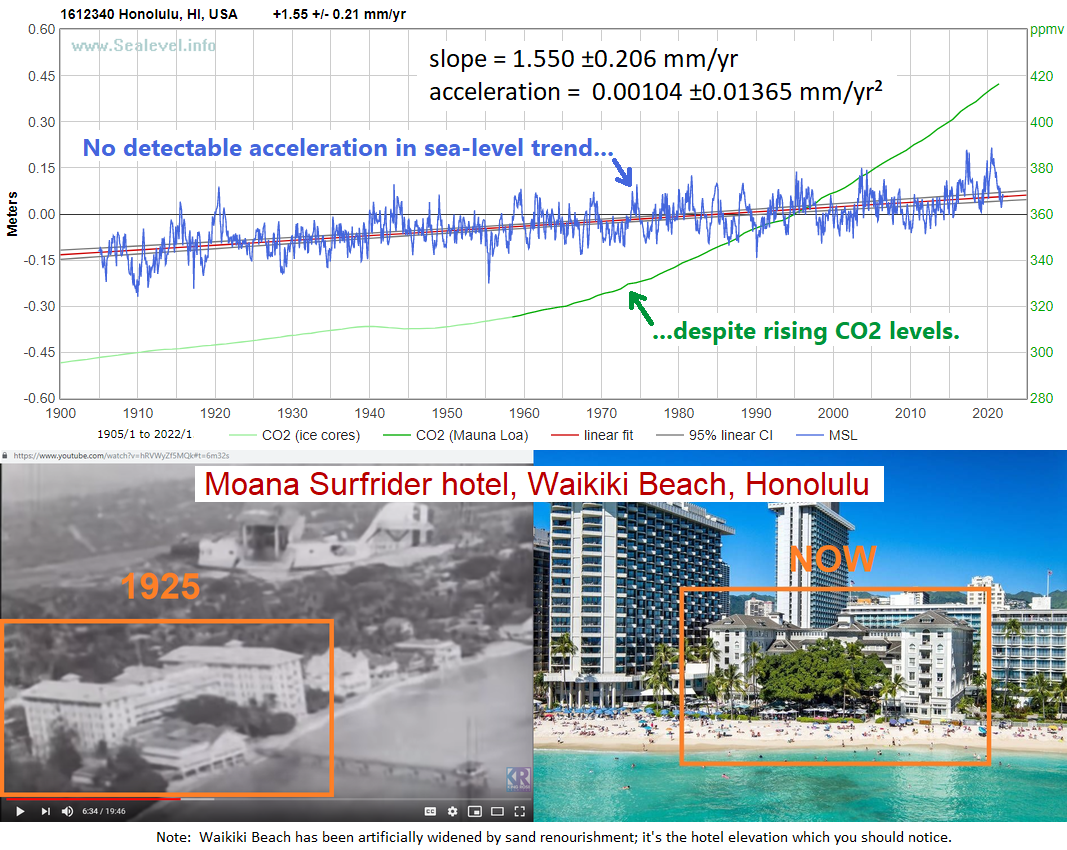
Honolulu is a nearly ideal sea-level measurement site:
https://sealevel.info/MSL_graph.php?id=Honolulu
One exception to the general linearity of coastal sea-level trends is the southern half of the Atlantic coast of the United States, where the Gulf Stream skirts the coast. Thanks to a (presumably transient) acceleration of the Gulf Stream, sea-level rise there has accelerated strikingly over the last decade:
https://sealevel.info/MSL_graph.php?id=Charleston&boxcar=1&boxwidth=3&c_date=1930/1-2024/12&co2=0

This is the presumed cause:
Here you can see how close to the coast the Gulf Stream is, in the SE United States:
Here’s nice video animation of a full year of AMOC:
P.S. — The widening of Waikiki Beach in front of the Moana Surfrider Hotel is due to a sand renourishment project. Ignore that, please. It’s the negligible change in the elevation of the hotel above sea-level that I want you to notice.
Dave ==> Honesty is always (mostly) the best policy. Images are tricky — and all the hype about SLR narrowing beaches is mostly false — beach erosion narrows beaches and is a natural process. Often, the sea rebuilds beaches too.
Yep. The Guardian had an article on 31st March entitled ‘Below the waterline (in red) Spanish railway at risk from rising sea’ about a railway line that runs along the coast north of Barcelona.
The reporter says “coastal erosion and rising sea levels have put the future of the famed Maresme line in jeopardy”
The geologist he quotes well into a fairly lengthy piece, however, says rapid urbanisation and canalisation of the rivers that drain into the sea mean less sediment is deposited “leading to greater erosion” and that the 5 marinas along the coast are also a factor.
” Ocean currents move the sand from north to south as part of a natural process of regenerating the beaches, but the marinas’ quays act as sedimentary traps”
The geologist also notes that a proposed solution to install breakwaters along the coast “simply aggravate the problem of erosion, so the cure is worse than the disease”
Not once does he say anything about rising sea levels
Dave ==> The issue is coastal erosion which is a factor of currents and waves only vaguely affected by rising sea level. In that part of the world (western Med) surface sea level has risen about 6 inches since the late 1800s.
The media and climate promoters also try to conflate beach and coastal erosion with rising seas when in fact for present time considerations, SLR is almost never an major component.
Dave ==> Yes, the odd thing is that Global mean sea level rise, by satellite, does not show up at tide gauges….it is just missing in action….so Morner is probably right. Little, if any, real sea level rise — in the range of 1 to 2 mm year.
Kip, Please read: Larson and Clark, “A Search for Scale in Sea-Level Studies” Journal of Coastal Research, July 2006. They conclude that, based on examination of coastal peat bogs and river sediments along the US east coast, sea level has been rising at a rate of 1 to 2 mm/yr for the past 6,000 years.
DHR ==> Yes — but probably not 6,000 years. Most likely true though since the end of the LIA (approx 1750).
Larson and Clark is a good reference to debunk rapid major SLR in the modern era.
Jeeze Louise…continental drift is occurring at 2-10 cm per year. Maybe we’ll outrun the rise in the sea level, or subduck below it. 🙂
Mr. Burton,
The part of the Charleston SC chart which you highlighted seems little different to me than the rise from 1940 to 1948 or 1965 to 1975 shown on the same chart. Also, the GPS gauge at the site shows the land to be sinking at a rate of about 2 mm/yr. Thus the true sea level is going up at a rate of about 1.4 mm/yr, not 3.4 mm/yr. This is consistent with estimated of world wide absolute sea level rise from elevation-corrected world-wide tide gauge data. It is easy to be misled by the NOAA site since it does not provide elevation change data, at least not that I can find. PSMSL gives the same relative sea level data as NOAA but also includes GPS data for each site where available and for Charleston, it is.
If one is looking for a cause of perceived acceleration or deceleration of relative sea level rise at Charleston or anywhere else, it seems that an examination of coastal land elevation changes such as caused by geologic activity, coastal construction, groundwater pumping, inland elevation changes (a teeter totter effect such as one can easily see at Manila, The Philippines) or other geologic phenomena is essential.
DHR ==> One has to be very careful when looking at PSMSL and SONEL data. It is extreme;y helpful, but often not quite what it first appears to be.
For instance, GPS data for Charleston refers to GPS sites remote from the Tide Gauge itself (not the gold-standard GPS@TG(ss) ). Both GPS stations for Charleston are decommissioned, But the most current runs to 2018. With GPS data, you have to look at all the GPS solutions — they are often, as in this case, quite different.
https://www.sonel.org/spip.php?page=gps&idStation=651
The differing solutions range from -0.4 mm up to – 1.45 mm per year.
ALL of the NOAA Tides & Currents data is expressly local Relative Sea Level and has very little to do with global changes in sea surface height. This is why this data must never be used for GMSL calculations.
The NOAA data is useful for local planning. And shows clearly that the SLR reported by satellite ( around 3 mm/yr) does not actually arrive at Tide Gauges.
Unfortunately, we really don’t have good measurements of vertical land motion (VLM). Measuring it with GPS is challenging, because the GPS systems are not designed for resolving such fine elevation differences, and because GPS-based VLM measurement records are very short.
Using those short GPS measurement records to correct much, much longer sea-level measurement records at tide gauges requires making the dubious assumption that the VLM trend is unchanging. On timescales of many decades VLM is probably not far from linear, but on shorter timescales that assumption is unwarranted.
So most people rely on model-based estimates. Peltier and Tamisiea both have models, from which they calculate such estimates. Most people use Peltier’s. His ICE-6G (VM5a) estimate for Charleston is 0.57 mm/year subsidence. I’m sure that numbers is too low.
Dave ==> I depend on both the CORS project and SONEL — taking into account the differing GPS solutions. But the longer the CORS runs, the better the estimate of the magnitude and trend.
But I am hitching my horse to the CGPS@TG(ss) movement or a better measurement in the future.
My guess is that similar variations in the Gulf Stream have occurred in the past, too. The ocean sloshes.
The ground also sloshes, but much more slowly. It is currently “sloshing up” at Greta’s hometown, thanks to PGR.
https://sealevel.info/MSL_graph.php?id=Stockholm
Thanks for the credit, but as I remember it was Judith Curry who pointed out that Nerem finally got the acceleration he wanted by increasing sea level data from 1992-1998 which induced a 2nd order polynomial trend that showed acceleration. His Colorado Sea Level Research Group now claims 0.098 mm/yr² of sea level rise acceleration. Not 0.097 or 0.099 but 0.098 mm/yr².
Steve ==> I made the same case here many times.
Data malleability is a feature, not a flaw.
Meaningless hype phrase typically used to paper over rough spots—Colorado’s all mail-in ballot elections are also called “the gold standard”.
Three significant digits for uncertainty? Shows these people don’t know what they are talking about.
They should also report the relative uncertainty based on the satellite altitude, which has to be very, very small.
Monte ==> They try to account for orbital changes by checking a land reference point (something like Corsica, I’d have to look it up). and yes, orbital changes are of the same magnitude as sea level changes reported.
Interestingly for LEO (Low Earth Orbiting) satellites, at the values measured, the orbital velocity is not even constant nor uniform. Gravitational drag will affect satellite velocity as it passes over denser land masses (slow down over the mountains, speed up again over ocean deeps). Its akin to spring skiing as you pass through sunny or shady areas on the slope. However, if it can be measured it can be accounted for.
Rocket ==> Not sure if velocity affects the altimetery….do you think it does?
Kip,
Yes, velocity affects the satellite altitude. As the satellite speeds up, it rises higher, and conversely, dips lower as it slows down.
As I understand it, over the open ocean, where there are no fixed reference elevations, the satellite data processing has to depend on a gravitational model that has relatively coarse spatial resolution to determine the altitude, and hence the distance between the ocean surface and satellite. That contributes to the uncertainty.
Clyde ==> Aren’t the velocity changes related to gravitational field?
As Clyde mentioned conservation of orbital momentum is strictly enforced. But, I had always envisioned it the other way round. As it gets drawn closer to large masses (by gravitational attraction) it reduces its radius to the earth’s CG and therefore reduces velocity.
Rocket == I can only suppose that the insanely complex calculations of sea surface height that this into account — or at least think they do.
This appears to be gargantuan waste of tax payers money.
Michael ==> There is some real and valuable science that is done with information gained by this series of satellites. Unfortunately, GMSL is not one of them.
Kip yes I realize there are other instruments on board. But there are on going costs associated with the data besides the instrument cost. I can’t see how it can be justified given the tide gauges are fit for purpose.
Michael ==> Depends on what the researchers hope to discover. SLR researchers are looking for sea level rise — Tide gauges are showing too little SLR to be alarming — putting the point bluntly.
I couldn’t have put it better!
But there is always tomorrow. Tomorrow they might get better (more fit for their purposes) numbers.
Contrary to a lot of reporting, which mentions only a small fraction of the total cost, this two-satellite mission is apparently costing about $1.1 billion.
Does anyone know what a modern tide station costs? I can’t find it.
Searching online, the only budget line item I found for a tide station was $120 in 1914. With inflation, that would be about $3400 today. If we multiply by four to allow for improvements, and by eight because it’s probably run by the gov’t., that puts the cost around $110,000.
That suggests we could buy about 10,000 coastal tide stations, at $110,000 each, for the cost of this satellite mission.
Dave ==> Modern Tide Gauges are acoustic, with computers and real time satellite connectivity to NOAA….quite expensive, but certainly not much above the 100 k level — not counting installation costs.
Of course, tide gauges only tell us about Local Relative Sea Level unless coupled with a CGPS station mounted to the same structure as the tide gauge itself. Then they can give an idea of Absolute Sea Level rise or fall, but only for that exactly location.
It never tax payers’ money. If it were theirs, they would still have control of it.
Considering the inherent difficulty of measuring something that fluctuates more than the signal, and doing so from orbit, they are doing well. But picking a maybe two millimeter rise out of what they admit is a twenty centimeter uncertainty leaves too much chance for error
As the satellites seem to indicate about twice the rise as tide gauges, I will believe the tide gauges. Sort of.
Tom ==> “Sort of” is the correct attitude.
Pulling a signal with 1/1,000 the amplitude of the noise is challenging unless the signal has some unique property like a fixed frequency with a narrow bandwidth. That isn’t the case here.
Sooo….how do they account for the billions of tons of annual sediment flowing into the oceans?
The total global suspended sediment yield into the World Ocean equals 15.5 × 10⁹ t year-1.
I guess computer models are used.
John ==> All that sediment get spread pretty thin but might need to be taken into account when trying to determine Eustatic Sea Level (which is not a real level).
A practical example is in your yard. Try to calculate how much soil you need to raise your lawn’s level by 3 inches (an exercise I did recently when they repaved our road, raising its level thus causing my lawn to flood repeatedly.) Always far more than we think. The oceans cover 2/3 of the Earth’s surface — so sediment gets spread really thin.
Actually, Kip, its simple math, but the values can be HUGE (and often beyond the average man’s experiential understanding).
It’s all in how you communicate.
A lot 120′ X 90′ will require about 100 cubic yards of soil to raise the level 3″ (.25ft). BUT, each yard of soil will weigh about 1 ton.
100 tons of soil is quite a pile, and not too easy to transport, nor redistribute.
However, the oceans do not distribute the sediment evenly as we well know.
Rocket ==> Yes, the sediment that goes into the seas builds deltas….
Thanks for the calculation — exactly my points. 100 yards of soil is a massive construction-site style pile of dirt!
Perhaps you need a dike along the road edge.
Andy ==> Actually, I need the lawn’s elevation to be higher than the road so the water runs off over the road to lower ground on the the other side….
But considering the cost of that, a dike might be a reasonable alternative.
1 mm of sea-level rise requires about 362 Gt of additional seawater. If that paper is right then 15.5 Gt of sediment is being washed into the oceans each year. If it is 150% of the density of seawater, that would be about (15.5 / 1.5) / 362 = 0.03 mm/yr of sea-level rise, or 3 mm/century.
So it doesn’t affect global sea-level much, but it does have significant local effects, e.g., by creating the Mississippi River Delta:
Sea-level rise is unusually rapid there. Can you guess why?
https://sealevel.info/MSL_graph.php?id=Grand+Isle&co2=0&g_date=1945/1-2024/12&c_date=1945/1-2024/12&s_date=1945/1-2024/12
Dave ==> Or, in the opposite direction, if sediment if prevented from entering the delta or being washed farther out into the sea, the delta will degrade and begin to disappear due to lack of replenishment, as wit the Mississippi delta.
Now, class, let’s not always see the same hands.
You are correct, of course, Kip. Sea-level rise in the Mississippi Delta is mostly due to such subsidence.
For thousands of years, Old Man River carried vast quantities of silt down to the Delta, mostly during floods. In response to the weight of that silt, the ground sank, and it is still sinking.
In the 20th century, flood control has greatly reduced the amount of silt which reaches the Delta. The ground is continuing to subside, but there’s no longer a comparable rate of sedimentation.
The result is the most rapid local (“relative”) sea-level rise in the United States:
Dave ==> As in many modern classroom, many of the class are asleep at their desks…..
Kip,
Or secretly texting on their contraband smart phone.
I remember recently (before the pandemic) auditing a math class as a refresher. The young woman next to me appeared (to the instructor) to be taking notes on her laptop. I could see that she was actually surfing the internet, looking at high-fashion clothes.
Clyde ==> The burning question is: “Was she making better use of her time by doing so?”
Not so simple at the river mouth. As sediment washed further out to sea it did raise the sea bed (which would eventually expect the delta to move further out), but it also added weight which caused sea floor subsidence. So the correlation is not as direct as one might expect.
If the data is of clearly insufficient quality for the purpose of determining actual change in overall sea level then one must ask, what is the real purpose of the satellite? The government really can’t spend this kind of money just for an inaccurate sea level measurement.
Thomas ==> The satellite has a boat load of instruments and does much more than measure sea levels. See the reference to the mission requirements document.
Kip,
However, the mission was probably (over)sold on the basis of being able to prove an anthropogenic cause of rising SL, using the latest and greatest doohickeys. After all, that is what ‘science’ is supposed to do.
Waste of resources. Sea levels go up and down with tides, so do satellites and need correction occasonaly, to measure 2-3 cm variability from 500 miles up (where orbits which are elliptical anyway) for Sentinel A & B are.
“That range means that every measurement made must be guaranteed to be within a band 6.8 cm wide, 95% of the time.”
95% error bands are three-sigma, not two. That would make the error band +/- 10.2 cm.
The accuracy is always going to be limited by the frequency band the system uses and the GPS accuracy. These systems use L-Band, 1- to 2- GHz, which results in a wavelength of 30- to 15-cm. Getting the accuracy down to mm levels is never going to happen.
Mike ==> Yes, as I believe, computational hubris.
The Alarmists screamed sea level rise
Would ultimately cause our demise
But costal tide gages
Exposed their false rages
And their international cabal of lies
Call Me ==> I think yours is the first limmerick reply!
Modern climate eschatology
is political theology.
The doom and gloom
leave little room
for science in climatology.
Dave ==> Limerick Day — thanks for the contribution!
Mike,
95% area under a normal distribution is +/-1.96-sigma. Three-sigma is 99.7%. So, 2-sigma is between, and is frequently used as an approximation since it is a nice round number and amounts to 95.4%, or 95% if rounded off to 2 significant figures.
Good review and while we should applaud the increase in accuracy of measurement, we could regret the “adjustments” that will be employed to fit the narrative.
Mainly the touted threats of a devastating rise in sea levels everywhere, that can only be relived by regulations and taxation.
Bob ==> Ghe most interesting point is a broad review of the world’s longest tide gauge records, many over 75 years long. They just do not show either 3 mm/yr plus of rise or any acceleration. Especially not when corrected for downward VLM of the tide gauge structure.
Mr. Willis says:”…monitoring how much, and how fast, the oceans are rising in a warming climate.”.
We have predetermined outcome for what ever the satellite data shows.
MKelly ==> The more intresting point is that Willis feels we have to check sea level every ten days….as if it is ging to do something sneaky or surprising.
Every ten years would be often enough.
But how much press coverage can oyu get from a once every ten years event?
Andy ==> Not much, since no one will be impressed by an extra inch of sea level.
“said: “We can’t lose track of how much sea level has gone up because if we do, it’s hard to predict what’s going to happen in the decades to come.”
How would it be possible to “lose track”
Kip: I take statements like this from technical people to mean something in today’s climate science. I see them as ‘poker tells’. You’ve already mentioned that their chart is different than what you get from direct plotting of the new data – because (for no apparent reason) they “smooth it with a four month boxcar filter.
Because it’s the nature of such data to require legitimate data manipulation of raw product, a researcher who has already concluded that we can take a future warming world as a given and this will impose continuing sealevel rise, it opens the door wider for illegitimate manipulation as we see being done on temperatures with algorithms designed for this nefarious purpose.
I suggest a test to see if this is the case. Take the data and subject it to 1 month, 2 month 3 month 5 month and 6 month boxcar filtering to see what gives you the most alarming results. Remember all the p-hacking discovered in climate and medical research? This type of fiddling has a well worn path in these sciences (other sciences perhaps less so).
Ya know, I hate what all the dirty tricks have done to my equanimity
Gary ==> As for the boxcar smoothing — I have communicated with Eric at NOAA’s Laboratory for Satellite Altimetry — he’s the guy that actually writes the script that produces the graphs. And while he didn’t give any justification, the visual effect is a cleaner “statement” — and all this climate change public-facing science is all about making a clear statement in accordance with the consensus narrative. Unclear statements are suppressed as “the public might get the wrong idea”. This is why they show no uncertainty bars as well.
Well, yeah, because if I understand correctly, the uncertainty bars would absolutely dwarf the measurements.
wadesworld ==> That is exactly correct. Realistic uncertainty bars makes satellite SLR graphs look inconsequential…..
In Climate Science, there are only certainty bars.
Jeff ==> I call NASA/NOAAs satellite sea level record “errorless sea level”.
I just don’t get it. We really only really need 1 tide gage to measure global sea level. Maybe to be safe in case an asteroid hits or some other disaster, have a couple back ups. A brass bar mounted in a chunk of concrete and a note book would work better than a $97,000,000 satellite trying to read millimeters from outer space.
For a little more money, an automated float gage, data logger and some cellular communication equipment could post to a website for the globe to share. Oh wait, we already have that. Thousands of ’em.
Citizen ==> While I generally agree that the price tags of space science are enormous (and paid for with ‘funny money’) — it is not true that we can measure global sea level rise
Citizen ==> While I agree that the price tags of our space programs are possibly out of line with the priorities of our modern society, it is simply not true that we could measure or even get a general idea of the changes in global sea surface heights from a single tide gauge.
See my extensive Sea Level series here at WUWT.
Your one tide gauge would tell your local planning commission all it needs to know about sea level for its area of concern.
I would suggest putting that concrete/brass monolith smack at the mouth of the Bay of Fundy. /sarc
Kip, as long as they continue to use basically the same radar wavelengths for measurement, they are going to be stuck with the same resolution. Physics is funny that way. I don’t see how 3.35 cm is much of an improvement on 3.4 cm, but then, I’m just an engineer.
D.J. ==> Ah shucks, it only cost what?
Just imagine the NOAA graph with the actual real-world uncertainty overlaid…..
That said, the resolution is fully adequate for what the people of Earth needs to know. Something along the lines of “tell us when the sea starts to rise a foot a month….”
Kip, if starting to rise a foot a month were ever possible, it could be very useful to know well in advance of the start.
Andy ==> If we could predict the future, we’d be all set. Have any pigeon guts we can consult?
Currently they are watch for 0.008 mm a day…that is fine gold foil thickness.
What do cooling oceans do to these small sea level rise numbers?
ResourceGuy ==> The cooling seas (and northern hemisphere winter in general) produce falling sea levels, apparently, on a 10-15 mm scale. see: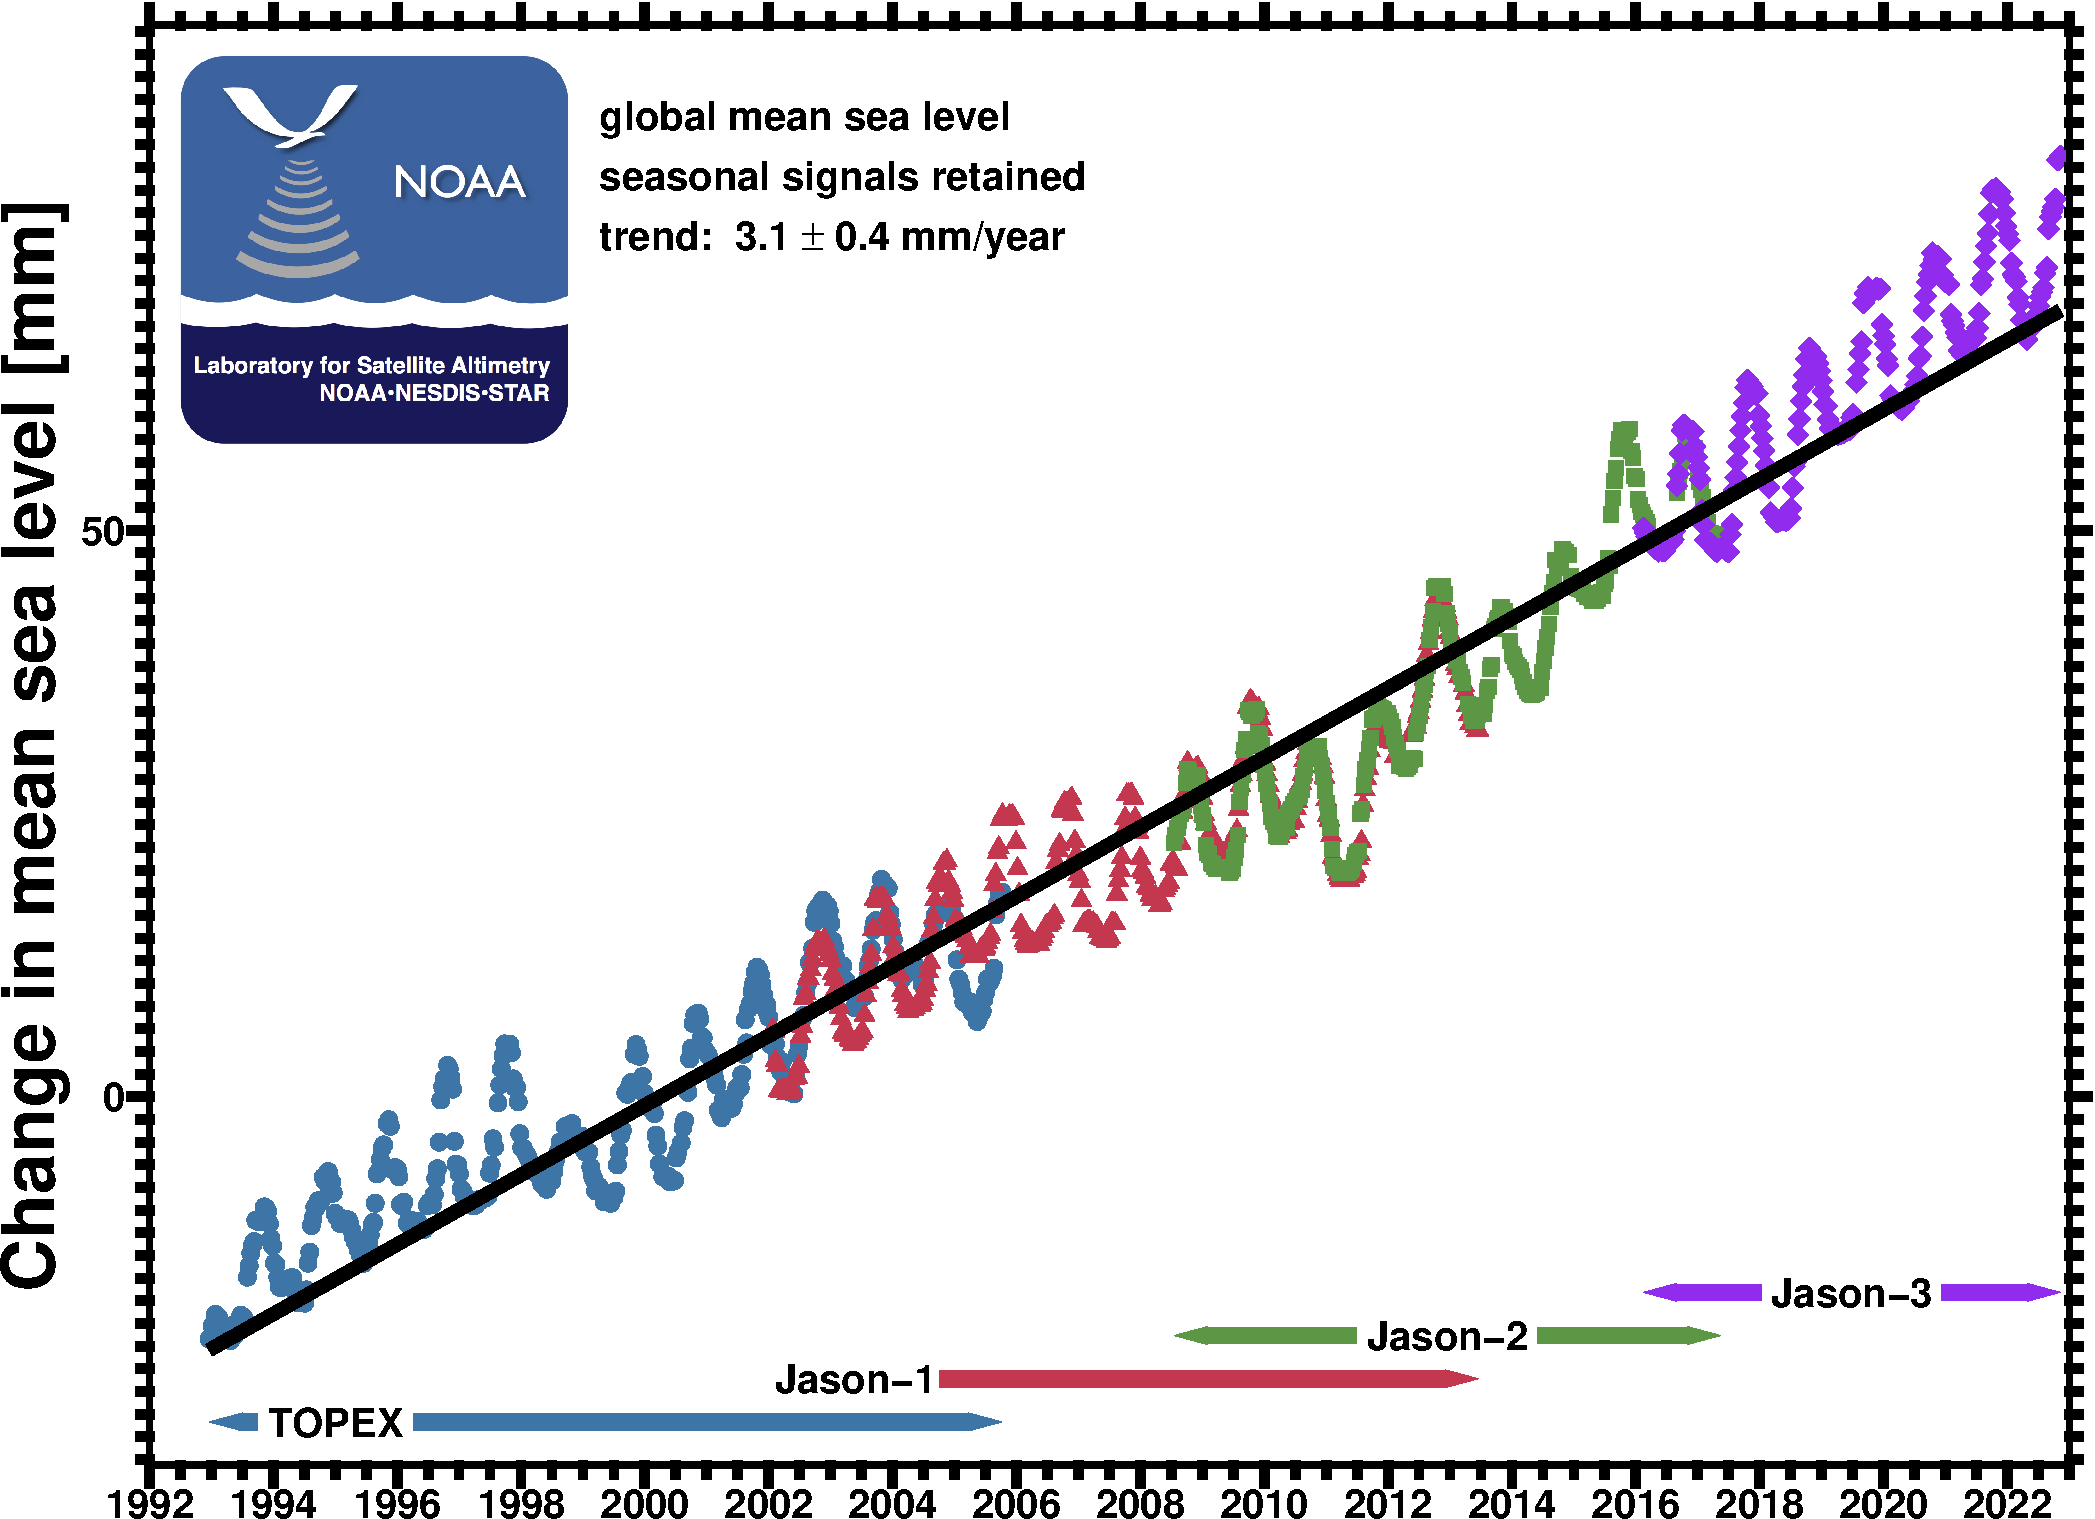
The “gold standard”? There is no way you can measure sea level from a satellite to any accuracy. One good CME from the Sun changes its orbital parameters. You have trade winds changing directions, high and low pressure systems and temperature changes impacting the ocean surface. Another boondoggle.
rbabcock ==> Their gold standard gives us “errorless sea level rise”.
https://wattsupwiththat.com/2018/04/02/errorless-global-mean-sea-level-rise/
not a measurement but a guess … with an error band 6cm wide … simply not fit for purpose …
Dark Lord ==> There is a wide-spread erroneous belief in modern computation-bases sciences that original measurement error can be “averaged out” of any and all data. That, however, is simply NOT TRUE.
Scientists know that — but don;t believe it applies to their own work.
“Computational hubris”, heh, that’s a new one on me. I like it!
Tom.1 ==> A useful concept — keep your eye out for it — visible in all the sciences.
It seems to me that for a useful level of accuracy, you need to have a pair of close satellites for a 3D rendition. A relative of mine (post doc) and a NASA colleague measured a circular area rising some 10mm a year in the altoplano in the central Andes because of a large intruding magma from below (published in Science 10yrs ago). Apparently the altimetry can measure the growth upwards of heads of wheat in fields below.
I think two sensors on one satellite would even measure crests and troughs of waves and wavelets and five a better measure.
It will be interesting to see the liberal reaction when the sea level starts going down, the glaciers are expanding, and people are starting to freeze.
That would obviously be a consequence of someone, somewhere, still burning something.
Satellites are ideal for this mission because they require large budgets and the ensuing data can be massaged to get desired results. The tide gauges just won’t cooperate properly.
The saddest part of this is the Josh Willis comments. Shows how far ‘climate science’ has departed from reality.
Rud ==> My feeling exactly….I have been surprised by the lack of reaction here to his comment about “losing track” of sea level rise. What an absurd idea!
It is an important part of regular press coverage.
“The 3.0 mm of satellite reported annual sea level rise does not show up as a rise in absolute mean sea level at the world’s GPS-corrected tide gauges which directly measure mean sea surface height at each location.”
I read somewhere that included in the sea level rise is 10% added to account for a deepening of the ocean basins. Is that true?
accordionsrule ==> Well, maybe ukuleles rule!
You are referring to the .0.3 mm/yr GIA adjustment. It is a guess (at best) to account for an unknown factor and make SLR look bigger. It is added in many satellite sea level rise numbers to reflect Eustatic Sea Level (not a real physical level).
Hi Kip,
I assume you mean +0.3mm/year for the GIA. Is this a mythical figure…or was it derived from Peltier’s work and if so how reliable is it? It’s a big number/year!
Could you please explain in simple terms just why eustatic sea level rise is “not a real physical level.” What exactly is it? Does it include glacier melt loss calculations (presumably based on satellites) or thermal expansion (based on their incorrect global mean temperature increase)? Or something else? (eg. calculated sediments going into the oceans?) Sorry to be so ignorant.
BTW, it would be very revealing to see a graph of the satellite data with error bars!
Alastair ==> Alex Nils Morner wrote the original book on Eustatic Sea Level.
I refer to the Sea Level Research Group at University of Colorado web page for their explanation (and proof that this is what they are calculating and presenting as satellite Sea Level)
https://sealevel.colorado.edu/index.php/presentation/what-definition-global-mean-sea-level-gmsl-and-its-rate
Eustatic Sea Level is a concept not a physical world thing.
Thanks Kip…so it’s just another fudge factor for them to add in to try and scare us all.
Alastair ==> sot of — For those who research interest is Eustatic Sea level it is important –but means nothing to the rest of us.
So the entire seafloor is slumping 3mm a decade in response to isostatic uplift of dry land.
Since accordions do indeed rule, and since the mantle didn’t just disappear, then dry land (30%) must be rebounding at 1cm a decade. I’m not seeing it.
Thank you for the link. They say they started applying this correction in 2011, but they didn’t say they retroactively applied it over the last 16k years.
accordionsrule ==> Are you familiar with the accordion work of Garth Hudson, of The Band? He is a friend of mine, now far advanced in years, but was an example of how accordions could create a special sound even in rock music.
Eustatic sea level change is not driven only by slumping of the sea floor — but by many factors including the continental drift. NOAA and NASA no longer automatically add the 0.3 mm/yr when reporting SLR.
On their main SLR page they now include this caveat “The estimates of sea level rise do not include glacial isostatic adjustment effects on the geoid, which are modeled to be +0.2 to +0.5 mm/year when globally averaged.”
No, I wasn’t, thanks for sharing. He’s really talented and eclectic.
When it starts recrding there will be new models to “homogenize” with previous satelite measurements…
Joao ==> It is already in use but not appearing on the NASA graphs yet.