By Andy May
The IPCC believes that the change in solar radiation over the past 60 years nets to zero and has no trend beyond the normal ~11-year solar cycle. Professor David Karoly writes that we can confidently exclude the Sun as a contributor to recent warming because, if it were, the stratosphere would be warming as a result, and instead it is cooling. The cooling of the stratosphere, when the troposphere warms, is sometimes called the “atmospheric fingerprint” of human-caused global warming. Karoly was a pioneer in this area of research (Karoly, 1989) and (Karoly, 1987).

Figure 1 shows the AR6 interpretation of the components of global warming since 1750. What is significant about this interpretation is that the Sun, which is a variable star, is assumed to be constant from 1750 to 2019 and that cloud cover is also assumed to be constant, except as a positive feedback to surface warming. Both assumptions are contested, but not thoroughly examined in AR6. The constant Sun assumption is disputed by Ronan Connolly, et al.[1] and the constant cloud cover is disputed by Henrik Svensmark and colleagues.[2]
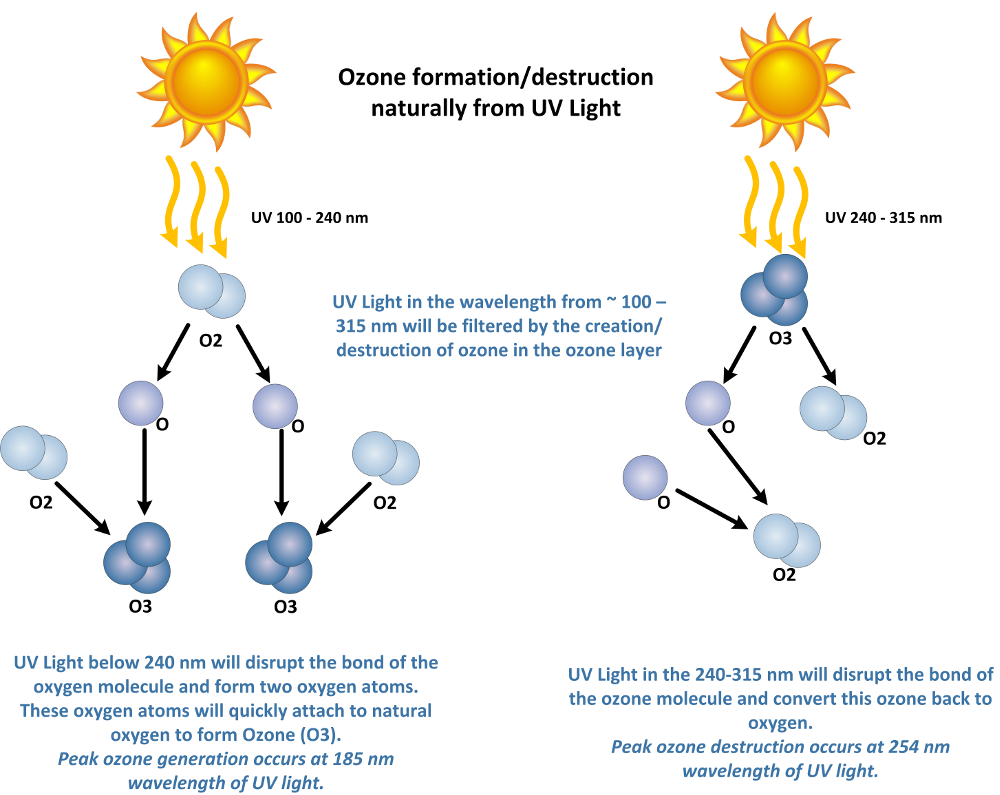
Cooling of the stratosphere, due to a higher concentration of CO2, is logical. CO2 is a major radiator of thermal radiation in the stratosphere, and more of it should cool that layer. Likewise, if the intensity of solar radiation increased, oxygen and ozone in the stratosphere would absorb more UV (ultraviolet) radiation, which should warm the stratosphere, not cool it.
However, the idea that this pattern “points towards a discernible human influence on global climate” (IPCC, 1996, p. 439) is very controversial. There are alternate explanations for the observed stratospheric cooling, Karoly suggests that “decreases in ozone amount in the stratosphere” (Karoly, 1987) may account for the cooling. There are several other possible explanations or problems with the data used, as described by John Daly (Daly J. L., 1997). A short article in Nature, in 1996, provides a fair summary of the whole “atmospheric fingerprint” controversy, that is still accurate today. Following is a quote from the paper, written by Neville Nicholls:
“The study of Santer et al., and those reported in the IPCC Second Assessment, show that an anthropogenic component of global climate change – the ‘anthropogenic fingerprint’ – may be appearing in the observed data. It must be pointed out, however, that this signal is the complicated pattern of change resulting from the combined effects of stratospheric ozone depletion and increased concentrations of greenhouse gases and sulphate aerosols. It does not mean that the effect of any one of these factors has been detected.
Many uncertainties remain in this work and are acknowledged by Santer et al. and in the IPCC Second Assessment. There are uncertainties in estimates of the magnitude and patterns of the various natural and human-induced factors likely to affect climate. Climate models are far from perfect. There are also problems with the temperature observations: much of the similarity between the model and observed changes comes from the asymmetrical pattern of warming between the hemispheres, and the detection of that asymmetry relies on the relatively few observations of tropospheric temperatures in the Southern Hemisphere. Those observations are known to be affected by changes in instrumentation, so further work is needed to eliminate the possibility that the observed asymmetry is the result of such changes.” (Nicholls, 1996)
Neville Nicholls, like David Karoly and Benjamin Santer, was one of the authors of the critical Chapter 8 of the second IPCC report, often called SAR (IPCC, 1996, p. 407). In this chapter, the “atmospheric fingerprint” was used to justify connecting global warming to human greenhouse gas (GHG) emissions. As Nicholls writes, the so-called “atmospheric fingerprint” does provide the “clearest evidence yet that humans may have affected global climate.” (italics added) (Nicholls, 1996). However, paraphrasing Nicholls, it does not mean that the effect of human GHGs has been detected. It is logical to assume that increasing GHGs will have this effect, and it is logical to assume that humans have added significant GHGs to the atmosphere, but that is as far as it goes. We have already shown that the climate models predict too much warming in the tropical middle troposphere, if they incorporate human-emitted GHGs into their models (see here). Logical speculation is not proof.
The draft of Chapter 8 that was agreed to by the chapter authors, including Nicholls, Karoly and Santer, in July 1995, did not claim the atmospheric fingerprint showed humans were contributing to global warming. It said that, to date, the warming was within the range of normal climate variability, so a human influence could not be detected. Later that same year, in November, the conclusions of Chapter 8, were changed at the insistence of politicians and without the permission of the scientists that had written the chapter. This is the backdrop behind Nicholls’ statement above and many other protests of the changes to the chapter by scientists (May, 2020c, pp. 230-238).
A government, probably the U.S. government, insisted that Chapter 8 explicitly say that humans caused climate change. The leader of the SAR effort, John Houghton, insisted that the IPCC procedures were followed, and that the governments, that is the politicians, had the final say, not the scientists (Houghton, 1996). The IPCC reports are scientific, or they are political, they cannot be both. The scientists had already agreed that they could not be sure humans controlled the climate, because they did not know how large natural variability was. The politicians insisted this be changed, and it was. This incident, more than any other in the history of the IPCC, destroyed their reputation as an independent and unbiased reporter of the state of climate science. First, the atmospheric fingerprint was not evidence of human influence, then it was. It deserves a close look.
Satellite temperature trends in the lower stratosphere, middle troposphere, and the lower troposphere are shown in Figure 2. Stratospheric air temperatures, shown in blue, are driven by different factors than tropospheric temperatures, thus the large excursions from the trends in the 1970s to early 1990s. Since the mid-1990s, the stratosphere and middle troposphere have had the same pattern. They are both cooling while the lower troposphere is warming. Part of this pattern could be human CO2 emissions; but can we be certain of this? In a word, no. There are many natural factors that contribute to the cooling of the upper atmosphere, including less ozone that helps to warm it by absorbing ultraviolet (UV) radiation.

Benjamin Santer describes a computer model study he performed in PNAS, in 2013.[3] He used the RCP8.5 emissions scenario, which has been discredited. Jianliang Wang showed that sufficient fossil fuels do not exist to carry this emissions scenario out to the year 2100.[4]
Santer, et. al acknowledge that their “All Natural” (no human forcing) models do predict cooling in the stratosphere and warming in the lower troposphere, just as their anthropogenic models do, but says the match to observations is not as good.
As shown in Figure 2, the middle troposphere warms from the middle 1970s to the middle 1990s, and then cools until 2020, along with the stratosphere. The middle troposphere follows the lower troposphere half the time and the stratosphere the rest of the time.
Santer’s models, that include an anthropogenic effect, show the middle troposphere warming rapidly from 2000 on, like the lower troposphere. His “All Natural” model shows it staying quite flat. Neither fit the observations. Thus, his claim that the atmospheric temperature profile “provide[s] clear evidence for a discernible human influence on the thermal structure of the atmosphere” appears to be invalidated. We agree it is logical to expect additional CO2 to warm the lower troposphere and cool the stratosphere, but logical speculation is not evidence. Why does his model get the middle troposphere wrong? Compare Figure 3(B) to Figure 2.

Clearly how warming and cooling are distributed in these three sections of the atmosphere is complex and poorly understood. It is not simply human influence. If the temperature profile contains an anthropogenic signal, it has not been successfully detected or measured to date. Santer claims that his results are statistically significant, but only if we accept his assumptions that the models are robust and the Sun and other natural forcings are insignificant.
David Karoly’s other argument is that an increase in warming due to the Sun, would cause warming to be more intense during the day and in the summer. Yet, we see the opposite, warming is occurring more at night and in the winter, suggesting a warming Sun is not the cause. However, warming in the winter and at night is also consistent with more cloud cover and more cloud cover is likely as the world warms.
The Sun does not only vary in its total radiation output, or “TSI” (total solar irradiance). The Sun’s particle output, or the solar wind also varies, as does the intensity of its magnetic field. Further, TSI encompasses all radiation wavelengths, and the wavelength or its inverse, frequency, matters a lot in how radiation affects the climate. Higher frequency, more energetic UV (ultraviolet) radiation from the Sun varies much more than the total (Krummheuer & Krivova, 2015). All these variations affect Earth’s climate in ways that are poorly understood and vigorously debated.
Further, while the roughly eleven-year solar cycle exists, and is one of the few things all astrophysicists agree on, the long-term variation of the Sun is in dispute. The IPCC, Judith Lean, Leif Svalgaard, and David Karoly believe there is no long-term trend, at least over the last 300 to 400 years. They assume it is very flat, or possibly declining slightly. William Happer, and many astronomers, such as Willie Soon and Nicola Scafetta think there is a long-term or “secular” trend, and that solar variation plays a large role in global warming. We have written about this debate before, for a summary, see here. For an explanation of the various ways the Sun can influence our climate, as well as a discussion of solar activity proxies, see here.
Summary
The debate about the cause of recent global warming of Earth’s surface remains unresolved. There are several reasons why current observations, including stratospheric cooling, are inconclusive. First, the total radiation imbalance, or “forcing,” required to warm Earth’s surface one degree over the past few hundred years is extremely small, just 3-4 W/m2. This is undetectable with current technology; so, our measurements are inconclusive. As was true in 1995, when SAR was being written, we still do not know the magnitude of natural variability. Unless we know what nature can do, and is doing to our climate, we cannot detect a human influence.
Attempts to model natural climate change all assume that there is no long-term natural warming or cooling, and all warming is assigned to human influences. The huge variations in climate before humans evolved belie this assumption.
The second serious problem is we do not know what the long-term trend is in the Sun. Is it increasing its radiation output? Or is it decreasing, or staying flat? Our observations of solar output are not accurate enough to tell. Further, we do not know how the Sun affects our climate. Is the total radiation output the only thing that matters? Unlikely. Undoubtably the solar magnetic field, the frequency mix of the solar output must matter, and the solar wind surely has an influence. But we lack the ability to model these effects as discussed in Connolly, et al.
One thing is for sure, assuming the Sun and solar variability don’t affect our climate, is foolish. Yet, this assumption underlies the IPCC’s conclusion that humans are causing global warming.
The bulk of this post is an excerpt from my latest book, The Great Climate Debate, Karoly v Happer.
The bibliography can be downloaded here.
-
(Connolly et al., 2021). Connolly, et al. exhaustively examine the peer-reviewed literature on how variations in the Sun affect our climate and show that anywhere from 100% to 0% of the recent warming could be due to solar variability. The IPCC assumption of zero is not “settled science.” ↑
-
(Svensmark, Force Majeure, The Sun’s role in climate change, 2019) and (Svensmark, Influence of Cosmic Rays on Earth’s Climate, 1998) ↑
-
(Santer, et al., 2013) ↑
-
(Wang, Feng, Tang, Bentley, & Höök, 2017) ↑
[[Cooling of the stratosphere, due to a higher concentration of CO2, is logical. CO2 is a major radiator of thermal radiation in the stratosphere, and more of it should cool that layer. Likewise, if the intensity of solar radiation increased, oxygen and ozone in the stratosphere would absorb more UV (ultraviolet) radiation, which should warm the stratosphere, not cool it.]]
CO2 radiation cools the stratosphere? Is that like Mister Freeze’s freeze ray? What comic book universe did that physics come from?
When will the IPCC greenhouse gas warming hoax be laughed off by this blog? Every thing they do to give it credibility is an atrocity. CO2’s 15 micron -80C radiation can’t melt an ice cube.
(141) TL Winslow’s answer to What are the features of greenhouse gases? – Quora
How the Chapman reaction “warms” the stratosphere.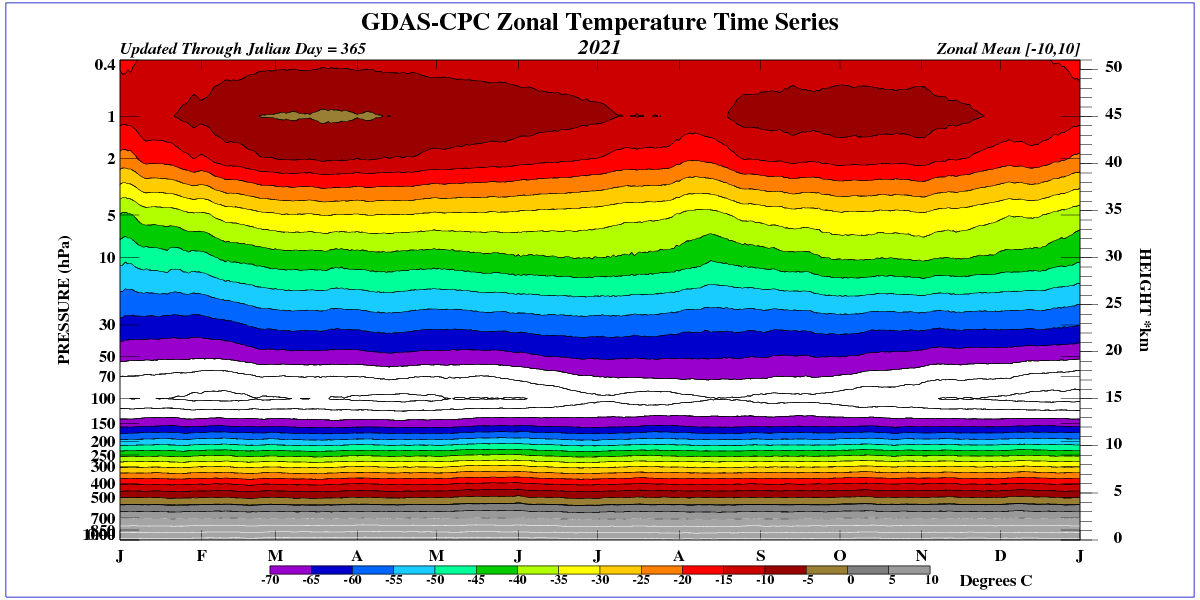

The debate about the cause of recent global warming of Earth’s surface remains unresolved.
no it doesn’t. It is human CO2 driving this.
“If you thought that science was certain – well, that is just an error on your part.” — Richard Feynman
“Always hear others out and remain open-minded; the day you think you know everything is the day you have the most yet to learn.” — A.J. Darkholme
“It is in the admission of ignorance and the admission of uncertainty that there is a hope for the continuous motion of human beings in some direction that doesn’t get confined, permanently blocked, as it has so many times before in various periods in the history of man.” — Richard Feynman
“The thing is, it’s very dangerous to have a fixed idea. A person with a fixed idea will always find some way of convincing himself in the end that he is right.” — Atle Selberg
“Religion is a culture of faith; science is a culture of doubt.” — Richard Feynman
I am trying to resolve it. For final.
Read my report and let me know what you think.
Click on my name.
Curious, I’ve never seen anything other than models that conjecture that. No emperical evidence at all. And ice cores Establish that CO2 rises after temperatures, not before. AGW is the biggest fraud ever.
No
Griff is
Nice discussion here. It felt like the good old days.
Did we all agree now that solar activity is going down, as is the amount of UV coming in?
See also fig 4 of my report
Who or what turned up the heat? | Bread on the water
where I showed that Tmax is going down. I think Tmax is a good proxy for solar radiation coming through the atmosphere.
So if it is not the sun that made earth warmer the past few decades, what is (or was)?
Looking at the data for the northern oceans I think it must be extra volcanic activity underneath the seabed of the arctic. Also, it seems that earth is putting on an extra jacket due to the extra CO2 in the air keeping itself warm.
Let me know what you guys think?
“climate models predict too much warming in the tropical middle troposphere”
Climate models can’t predict anything at all.
“A government, probably the U.S. government,…”
That would be Al Gore, vice-President at the time.
As senator, Al Gore tried to bully Dick Lindzen into agreeing that CO₂ emissions were warming the climate. Lindzen stood up to him, and Gore failed.
An honest history will not be kind to Al Gore.
Very true! I think it was Al Gore, but Houghton will not say.
Observe pins. Assume angels. Silence the unbelievers. Vociferously argue the dance.
Consensus climate modeling.
As an “extra” to my looking at the MT datasets I noticed the following in the CMIP5 “ensemble means” plots for the LS altitudes.
NB : KNMI has a “taz” array for CMIP5, but not for CMIP6 … so far …
The “cooling of the stratosphere” that is supposed to be “projected” by the climate models as CO2 levels inexorably rise … isn’t !
That “cooling” however, is (indirectly) present in the actual (MSU) measurements.
Follow-up post.
It’s even more flagrant if you limit the plot to the “no major volcanic eruptions / post-Pinatubo / since 1995” period …
Sorry, you’re going to have to “show your working” here.
1) The UAH (and RSS) datasets start in 1979 (/ November 1978).
They don’t say anything about “the middle 1970s”.
2) Your “trends” start around 1979 and end in 2020.
What length of “sliding window” are you using to calculate your “trends” ?
3) Attached is a plot of the UAH anomalies for the LT, MT and LS datasets.
They show LT and MT being very similar from 1993 all the way to “now” (the last datapoint is for February 2022).
NB : The “y-axis” for the trends on your Figure 2 goes from -0.5 to +1.5 (°C / decade ???).
The “y-axis” for my anomalies plot goes from -0.8 to +2 (°C).
In late years the GOME solar irradiance has degraded to about 20% of its value near 280 nm in 1995, so that the GOME data have become noisier.
The decrease in ozone-producing UV radiation should be counted as a percentage, not in watts.
I’m assuming this was meant to be a “Reply” to my preceding post (LS flat since the mid-1990s despite rising CO2 levels) ?
The caption to Figure 2 in the ATL article starts “UAH satellite temperature trends …”.
I do not see how the “trends” curves in Figure 2 can (even potentially) be derived from the “raw UAH anomalies datasets” that I plotted, and hence requested clarification on that specific point.
NB : Andy has been kind enough to respond to my “naive / basic” (my words, not his !) questions here at WUWT in the past. It isn’t completely unreasonable to expect some form of response (though there are almost 200 comments total here already to sift through …).
“Overall, the intensity fluctuations of solar radiation are small. In long-term average they amount to only the fraction of a percent of the total irradiance. The ultraviolet radiation, however, shows greater fluctuations and is also regarded as particularly climate-effective. Since the Earth’s atmosphere absorbs this radiation to a large extent, it influences critical chemical reactions in the upper layers of the atmosphere. Indirectly, these processes can also affect the temperature at the Earth’s surface.”
https://www.mps.mpg.de/4017144/PM_2015_07_09_UV-Schwankungen_der_Sonne_unterschaetzt
In your graph, the decrease in temperature in the lower stratosphere coincides with the weakening of the sun’s magnetic field (from 1995).
I have the drop in Tmax from 1996.
See my Fig. 4
https://breadonthewater.co.za/2022/03/08/who-or-what-turned-up-the-heat/
But I agree with the date of 1995 where the solar magnetic fields strengths started to turn.
My original question : “I’m assuming this was meant to be a “Reply” to my preceding post (LS flat since the mid-1990s despite rising CO2 levels) ?”
Your response : “In your graph, the decrease in temperature in the lower stratosphere coincides with the weakening of the sun’s magnetic field (from 1995).”
My translation of your response : “Yes.”
– – – – –
The fact that the IPCC climate models assume “zero changes in natural variability on ‘climate’ timescales (20+ years, down from 30+ years)”, which includes “changes in TSI”, might contribute to explaining why the CMIP5 (RCP) “projections” are flat from the mid-1990s.
It does not explain that “flatness” when CO2 levels have been rising “exponentially” during that time period.
Modifying the highlighting of the original quote in my preceding “top level” post :
“Cooling of the stratosphere, due to a higher concentration of CO2, is logical.”
My (!) “assumption” would be that if you input “lower TSI levels, especially in UV wavelengths” into the “Atmospheric Chemistry” modules of the various climate models they may well “project” a reduction in the rate of cooling of the (lower) stratosphere.
My question of why the purported “anthropogenic (global warming) fingerprint” — vastly (over- ?) simplified in most media outlets as “when CO2 levels rise the troposphere warms and the stratosphere cools” — is not seen in the “projections” of the CMIP5 models remains.
CO2 does not affect the temperature in the stratosphere. The temperature in the stratosphere is affected by O2, which absorbs UV radiation up to 240 nm. The stratosphere is only warmed by UV radiation.
Only looking at the AR6 (WG1 report, from last September) SPM you might be led to believe that that is indeed the IPCC’s (not my !) position.
In paragraph A.1.3, on page SPM-6 :
Note that their end-point is “the mid-1990s”, while you are focussed on “the weakening of the sun’s magnetic field (from 1995)”.
Looking into the actual “meat” of the AR6 report, however, we find (on page 3-25) :
NB : I am not saying that I agree (or disagree) with the above “assessment”, I am simply pointing out to you what the IPCC is claiming affects (lower) stratospheric temperatures.
On the following page (3-26) the IPCC says :
The overall picture of “human-caused stratospheric cooling” may well be slightly more nuanced than you seem to think it is.
– – – – –
PS : I’m assuming that you meant “O3” (ozone) instead of “O2” (oxygen) ?
No, O2 – check how the Chapman reaction proceeds with heat release. It is the breakdown of O2 by UV radiation to 240 nm that allows the formation of an O3 particle and the transfer of the released energy to neighboring particles.
The stratosphere warms only when exposed to high-energy photons.
TSI does not include the incoming LWIR component. The Sun is not a lightbulb in the sky as the silly GHG effect hypothesis requires. The Sun’s atmosphere reaches far beyond Earth’s orbit. It spirals out through the whole solar system. Our atmosphere is not just warmed by photons of light. Solar plasma of super heated hydrogen, oxygen and carbon molecules continually enter our atmosphere and cool and condense into water vapour and CO2.
“Cooling of the stratosphere, due to a higher concentration of CO2, is logical. CO2 is a major radiator of thermal radiation in the stratosphere, and more of it should cool that layer.”
Not really. T^4 has gone down 2%. CO2 ML has gone up 35%. For a finger print, it’s barely a tenth of a whorl.
“Logical speculation is not proof.”
Nailed it.
They want it to be so, therefore it is.
An apt metaphor for modern western society in freefall
Weaker solar wind states since 1995 have driven a warmer AMO which reduces low cloud cover.
As a interested observer in violent agreement with these ideas, the tell for me is that the people who insist natural variability is dead and only human CO2 can explain any changes are the same people who insist on the hockey stick view of the earths temperature and the last couple decades as the hottest ever despite endless physical evidence from all over the world that it was indisputably hotter many times in the past 8000 years
The may even be right about CO2 but it’s impossible to know as they are liars from base principles.
Andy, it seems that arguments over solar produce much heat and little light (sorry, sorry). Is it maybe worth looking at some of the other AR6 forcings.
The albedo forcing looks odd. Is this measured? Far from albedo increasing with framing I’d expect it to drop, the amount depending on the crop and the cultivation cycle — ,maybe that;s because I’m confusing the warmth of farmed area with the evaporation cooled well-vegetated landscape. However, there doesn’t seem to be a section for albedo and evaporation change over the oceans.
“Three quarters of the world’s surface is covered in water.” Say that in a thick German accent and you’ll sound like the intro to the diving programmes by Hans and Lotte Hass way back in the ’50s. They were right, we do not live on a Gaia planet but one ruled by Oceana. Those scuba scientists did much to bring the public’s attention to the underwater world but perhaps the IPCC were too young to have been infected by their love for all things submerged.
Tiny changes to the ocean surface are enough to throw off all the AR6 conclusions. Lord Rayleigh’s oil drop experiment shows how tiny amounts of light oil can s[read over a water surface — the effect was exploited by Siamese pearl divers, Israeli fish farmers used it on their ponds and Chinese rice farmers on their paddies, the former for light transmission, the latter two to get and earlier crop from warmer waters. Oily water smooths. That’s how the CYGNSS data is produced.
My Feynman guess (anyone is allowed a Feynman guess): ocean pollution by oil and surfactant from our civilisation together with lipids produced by sewage/dissolved silica and nitrate agricultural runoff fed phytoplankton are altering ocean ecology, in particular lowering albedo and reducing evaporation. The surface will smooth, reducing salt aerosol production.
A rough idea of the magnitude of ALW (Anthropogenic Local Warming) by ocean pollution should be fairly easy to track:
“When there’s plastic or other debris in the ocean, waves are dampened, creating less roughness than expected. “In cleaner waters there’s a high degree of agreement between ocean roughness and wind speed,” said Professor Chris Ruf, principal investigator of the CYGNSS mission and one of the authors of the research. “But as you head into the Great Pacific Garbage Patch you see a bigger discrepancy between wind speed measurements and the roughness of the surface.” Ruf and UM research assistant Madeline Evans compared CYGNSS roughness measurements to NOAA measurements of ocean wind speeds to see where waters were less rough than expected. Using this method, in combination with plastic concentration data from literature, Ruf and Evans mapped daily concentrations of microplastics across the ocean. This microplastics dataset was recently published at NASA’s Physical Oceanography Distributed Active Archive Center (PO.DAAC).”
earthdata.nasa.gov/learn/articles/ocean-plastic
This effect doesn’t replace the CO2 AGW hypothesis but would, if real, ameliorate the damage attributed to CO2, damping down the climate hysteria and giving us the time to address the problem without killing millions of people. Someone should at least look. Ruf and Evans could start by finding out why Lake Michigan is warming more than the global average.
Tom Wigley asked “Why the blip” after vigorously adjusting the data to explain away the temperature excursion from 1940 – 45. I leave the reason as an exercise for the interested reader. Clue: WWII.
JF
Framing, farming, dammit.
JF
Julian
I did a test to determine if there is an influence of oil contamination.
The result was negative. I am not sure of my choice of oil could have influenced the result.
https://breadonthewater.co.za/2022/03/08/who-or-what-turned-up-the-heat/
Andy,
Nice article! However, I think you simplify radiation energy exchange from Earth’s surface, through the troposphere and out of the stratosphere, far too much with these statements made in the third paragraph of your article above:
There is no doubt that CO2 has strong absorption bands in the LWIR portion of the EM spectrum, which predominate over the min-max range of temperatures characteristic of Earth’s land and sea surfaces.
However—and this is not generally recognized by many people—the rates for CO2 collisions with N2 and O2 molecules in the lower troposphere (up to about 10 km altitude) are 10^6 to 10^9 times faster than the rates at which CO2 molecules, on average at these conditions, will undergo “photo-relaxation” of any absorbed LWIR energy by spontaneous emission of a photon of equal or lesser energy than the one absorbed. This physical fact has been emphasized by Dr. Will Happer, among others.
Same process and trends apply to water molecules in Earth’s atmosphere, which actually exert a much stronger “greenhouse gas” influence due to being (a) in much high concentration than CO2 over most of Earth’s surface over the range of absolute humidity conditions, and (b) having a much broader integrated-LWIR absorption band than CO2.
What this means physically is that within 10 km of Earth’s surface, atmospheric CO2 at its current level of about 420 ppm (.0004%) will essentially redistribute any LWIR energy absorbed from surface radiation, via collisional energy exchange in vibratory and translational degrees of freedom, to nitrogen and oxygen molecules . . . and just not “carry” LWIR absorbed energy up to the general altitude of the stratosphere.
This “thermal equilibration” (reference Maxwell–Boltzmann distribution and equipartition) of surface energy radiation throughout all atmospheric constituents, due to very rapid collisions of all the mixed gases, in turn means that all atmospheric gases (99.1% being N2 and O2) will radiate thermal energy—since they are at temperatures above absolute zero—either directly to space or via chained collisional energy exchanges up to the level of the stratosphere where they can then radiate directly to space.
All atmospheric gases thermally radiate energy, which originated as Earth LWIR surface radiation energy, through the stratosphere . . . not just CO2 (or water vapor). Due to their much higher relative concentrations, IMHO it is more accurate to state that N2 and O2 are the major radiators of thermal radiation in the stratosphere.
And the reverse is equally true: all atmospheric gases thermally radiate energy, which originated as Earth LWIR surface radiation energy, back towards Earth’s surface . . . not just CO2 (or water vapor or methane or N2O). In this regard, “greenhouse gases” do function as claimed for intercepting LWIR radiation energy from Earth, but they get the underserved bad rap for being the only atmospheric constituents that radiate that energy back to the surface.
A cooling stratosphere indicates a reduction in overall atmospheric temperature. The lower stratosphere is the effective emission height of the atmosphere. When the atmosphere cools, it shrinks and becomes more dense at the bottom. Because of the ideal gas law, it would be expected that there would be temperature increase in the troposphere while the temperatures in the stratosphere are cooling. PV = nRT.
The ideal gas law, PV = nRT, does not apply to the control volume of any gas wherein the constituents are not in thermal equilibrium and when there is energy exchange taking place across the control volume surfaces.
If you apply a control volume around the troposphere or around the stratosphere—let alone, around both combined—you will find that energy is ALWAYS crossing the control volume surfaces.
Therefore, the ideal gas law cannot be used to “expect” temperature increase in the troposphere when the temperature(s) in the stratosphere are cooling.
LTE (local thermal equilibrium) is applicable so it certainly is a close enough approximation to apply to Earth’s atmosphere.
Below you say “There is no doubt that CO2 has strong absorption bands in the LWIR portion of the EM spectrum, which predominate over the min-max range of temperatures characteristic of Earth’s land and sea surfaces”
This is also incorrect. CO2 has strong absorption bands around 15μm which according to Wien’s displacement law has a corresponding temperature of minus -80° C. O2 has absorption bands “over the min-max range of temperatures characteristic of Earth’s land and sea surfaces” CO2 does not.
You need to understand that radiation and absorption bands are, by definition of “bands”, relatively broad and a given micron number for a band (e.g., “15μm”) only serves to indicate the center-point of the band. The associated temperatures for such bands are likewise relatively broad.
My sentence that you quoted is absolutely correct, if you take care to read it properly.
As one can see in the attached graphs (extracted from https://www.ncbi.nlm.nih.gov/pmc/articles/PMC6174548/ ), Earth would theoretically radiate energy—at temperatures ranging from 210 K to 310 K (i.e., from -63 °C to +37 °C)—across the LWIR spectrum from 3.5 to 70 microns. Within this range, you can note the two strong absorption bands for CO2: one centered a 4.3 microns and the other centered at 14.9 (call it 15) microns.
In reality, Earth only emits surface radiation directly to space over the interval of about 8 to 13 microns (the dark blue segment noted in the right topmost graph) due to the scattering and absorption of the remaining LWIR radiation by atmospheric gases, as noted. Note reference to the “atmospheric window” for this portion of the LWIR spectrum where there is little to zero interference by atmospheric gases.
Contrary to what you stated, O2 does not have any significant absorption bands from 3.5 to 70 microns wavelength (yes, there is a tiny one between 9 and 10 microns).
Of course, across the range from 3.5 to 70 microns, water vapor is seen to be the overwhelming “greenhouse gas” that is absorbing radiation emitted by Earth’s range of surface temperatures.
And yet water vapour is a negative feedback mechanism.
4.3μm has a corresponding temperature of just north of 400°C
“Contrary to what you stated, O2 does not have any significant absorption bands from 3.5 to 70 microns wavelength (yes, there is a tiny one between 9 and 10 microns).”
CO2 has no absorption bands at Earth’s ambient temperatures. None at 9-10 microns which corresponds to 48-16°C.
Hurricane Willy stated: “CO2 has no absorption bands at Earth’s ambient temperatures.”
THAT is absolutely fantastic news because it necessarily means that CO2 cannot be a greenhouse gas after all!
Please go shout this revelation from every church steeple and rooftop in the world.
Laissez les bons temps rouler! 🙂
Correct, CO2 is not a “greenhouse gas”, finally you are starting to get it.
The so called greenhouse gas effect” is a 150 year old hypothesis which has never been observed in nature as admitted to in the IPCC’s first repot in 1990 section 8.4 “When Will The Greenhouse Effect be Detected”.
Hurricane Willy posted “. . . CO2 is not a ‘greenhouse gas’ “.
That is an absurd and scientifically incorrect statement. You need to go back and re-read my OP made above on March 29, 2022 11:03 am in response to Andy May, which clearly explains why CO2 (as well as water vapor and other gases having molecular dipole moments) intercept LWIR emitted from Earth’s surface and then distribute that intercepted photon energy throughout all of Earth’s atmospheric constituents via collisional energy exchanges.
NASA, NOAA, the IPCC and almost all other reputable scientists acknowledge the reality that the “greenhouse effect” from LWIR-active absorbing gas molecules is real, although—as I argue—most do not recognize the “thermal equilibration” of such absorbed LWIR energy amongst all constituents of the atmosphere, and thus the back radiation of ALL atmospheric constituents to Earth’s surface, not just that from GHGs.
I see that you have trouble recognizing a sarcastic remark when you run across such. Pity.
CO2 does not posses a permanent “dipole moment”. It’s main absorption band is 15μm which has a corresponding temperature of -80° C. There is a very good and obvious reason for that. -80° C is the phase change temperature of CO2 in Earth’s atmosphere. That is the only reason for the strong absorption band at 15μm. The troposphere is defined by molecules with a temperature of -60° C and above. IR emissions from CO2 @ur momisugly 15μm cannot cause any warming in the troposphere.
It’s all explained here:
https://athenas.ksu.edu/climate-change/the-science-of-climate-change/greenhouse-effect/why-are-some-gases-called-greenhouse-gases?pdf=true
The temperature of the troposphere is controlled by the the ideal gas law. All molecular energy below the effective emission height is kinetic. You cannot discus temperature without referring to kinetic energy. Emissions of 15μm IR from CO2 have no warming effect in the troposphere.
PV = nRT not so called “greenhouse gases” determine the temperature of the troposphere.
Below the effective emission height of the lower stratosphere, the energy of the gas molecules is entirely kinetic. Therefore the ideal gas law absolutely applies. The troposphere is primarily what the ideal gas law was developed to describe. You cannot discus temperature without referring to kinetic energy. Temperature is simply a measure of kinetic energy. Can you see how silly it is to claim that the ideal gas law doesn’t apply to the troposphere?
The troposphere is a very good approximation of an ideal gas.
You are both kinda correct. The earth acts more like a tire. As energy is added by the sun, the temperature and pressure increase. Yet due to energy loss, the temperature will drop and in turn so will pressure. However, these are both time related so one must dig deeper into the energy/time relationship. Just picking one brief moment in time won’t suffice. Like so much of climate science this isn’t a simple linear algebra relationship. It really cries for integral calculus with trig functions to properly characterize what is going on. The earth moves in rotation, it’s orbit, and with other phenomena that changes each moment in time.
The point I was making was that when the Earth’s atmosphere is in a cooling cycle, such that the lower stratosphere is cooling, the troposphere will get warmer. When the atmosphere is in a warming cycle, the troposphere gets cooler. In both cases this occurs until equilibrium with the Sun is reached. This process is governed by the ideal gas law. PV = nRT is the process that controls the temperature of the troposphere, not CO2.
This is a simple to understand description of the basic physics of the troposphere. No further analogy required;-)
PV=nRT is only part of the atmospheric system that has involvement by a whole lot of other variables. Don’t think that this simple equation controls the whole thing, it doesn’t.
All molecular energy below the effective emission height is kinetic. PV = nRT is all there is.
Let’s see if I can make it even simpler.
The ideal gas law does NOT allow for phase change occurring within a defined control volume of gas as its pressure and temperature vary.
However, throughout most of Earth’s troposphere there is enough water vapor content that clouds will form (i.e., water vapor will condense into the liquid water microdroplets that we see as visible clouds) if the combination of the bouyancy of humid air compared to dry air plus vertical convection movements in the atmospheric are able to lift a control volume of humid air sufficiently high into the troposphere.
There are physical subtleties in this process that relate to the differences between dry adiabatic lapse rate, environmental lapse rate, and moist (wet) adiabatic lapse rate . . . good explanations of these can be found at https://sciencepickle.com/earth-systems/clouds/ideal-gas-law-and-the-troposphere/
The appearance of clouds is commonplace throughout the troposphere, albeit less frequent over desert areas of land. Thus, the ideal gas law cannot be realistically applied throughout the troposphere.
QED.
Phase change produces no sensible change in temperature. The energy potential remains zero, the ideal gas law still applies.
QEDOUBLED
Within a control volume that does not have any energy crossing the control volume surfaces, it is absolutely incorrect to state, as you did, that “Phase change produces no sensible change in temperature.”
However, it would be correct to state that under such conditions, total energy is conserved.
You see, phase change does produce a significant change in density which, as you well know (or should know), is equal to the n/V rearrangement of the PV=nRT ideal gas law that you cited.
Can’t have phase change without disturbing those P or T terms in an abrupt (i.e., non-continuous, non-ideal) fashion.
More simply, within the control volume, when condensation occurs, where do you think the latent heat of vaporization goes?
I think you’re becoming very confused. Please google the term “latent heat”.
No. No need.
The fundamental flaw in your link: “The environmental lapse rate (rate of temperature decrease with altitude) for the U. S. standard atmosphere is 6.5ºC/km within the troposphere.”
This is a common mistake. The environmental lapse rate begins at the Earth’s equilibrium temperature which is -18° C and works down to the surface. -18°C is the temperature of the lower stratosphere, the effective emission height. This is confirmed by radiosonde data. Locate the temperature of -18°C in any radiosonde data, add 6.5°C/km from that point down to the surface to get the surface temperature within 1°C or so. It makes no difference if -18°C is found for example at 4km or 5km. This predictive ability confirms that the lapse rate should be considered as a top down, not bottom up phenomena.
HW, I highly recommend that you contact the folks at sciencepickle.com to get this corrected ASAP.
BTW, got any credible data for your assertion that Earth’s “equilibrium temperature” is -18 °C? First I ever heard that.
The same as the equilibrium temperature of the Moon which is more or less the same distance from the Sun. No reason why they should be different. It is, as I have already stated, also confirmed in the radiosonde data.
Just incredible: “. . . No reason why they should be different.”
Ummm, a couple of hints for you:
1) Earth has an atmosphere; the Moon doesn’t.
2) Earth has liquid oceans (with attendant ice-liquid water and liquid water-water vapor phase changes occurring within the range of its surface temperatures); the Moon doesn’t have oceans nor any liquid water on its surface.
3) Earth has a highly variable visible-spectrum albedo (averaging about 0.30 over a year or more, but variable from 0.06 for open ocean water to about 0.1 over dry land with no cloud coverage to about 0.9 over land covered by ice and snow); the Moon’s visible spectrum albedo is constant at about 0.12 since it has no clouds, snow or ice (excluding minor amounts of surface water ice in permanently shadowed craters near its poles).
And there is this additional fact for Item 3:
“Generally, increased cloud cover correlates to a higher albedo and a lower absorption of solar energy. Cloud albedo strongly influences the Earth’s energy budget, accounting for approximately half of Earth’s albedo.”
https://en.wikipedia.org/wiki/Cloud_albedo#:~:text=Generally%2C%20increased%20cloud%20cover%20correlates,approximately%20half%20of%20Earth's%20albedo.
Just a few facts you may want to think about.
The only factors to consider when understanding the equilibrium temperature of the Earth v’s the Moon is the surface temperature of the Sun and the distance of each from the Sun. Nothing else matters.
Hmmm . . . according to https://www.weather.gov/jetstream/layers#:~:text=called%20the%20stratopause.-,Stratosphere,the%20temperature%20increases%20with%20height. “The Stratosphere extends around 31 miles (50 km) down to anywhere from 4 to 12 miles (6 to 20 km) above the Earth’s surface.”
However, the US Standard Atmosphere establishes the atmospheric temperature of -18 °C to exist only at an altitude of 5.08 km within the troposphere. That’s below the lower limit defined above for the stratosphere, I do believe.
Furthermore, if I apply a lapse rate of +6.5 °C/km, as you suggest, down those 5.08 km to Earth surface I then get a surface temperature of 15 °C (59 °F).
The surface temperature predicted by your technique seems to be a bit too cold for topical oceans and tropical lands and much too warm for polar oceans and polar lands. And by more than “1°C or so” in both regions.
Now, you were saying something about “common mistakes” and “predictive ability” . . .
Look at the radiosonde data, you will see that the altitude at which you find -18°C obviously varies by location and time of year. I think slowly the penny will drop for you. Keep at it, it will all make sense.
The Earth’s average temperature is 15°C, therefore the altitude of 5.08 km is also an average. Hope that helps!
Remember, it’s all in the radiosonde data, you just have to go and look.
“. . . therefore the altitude of 5.08 km is also an average.”
No, per your reference to the Standard Model atmosphere of the Earth, it is defined as the altitude at which the associated temperature is exactly -18 °C, which your yourself established to be a critical, exact temperature. It is NOT defined to be an average temperature per the Standard Model for the atmosphere.
BTW, I grow tired of the numerous corrections I’m having to make to your posts . . . I have much better things to do with my time . . . so goodbye and have a good life. Further discourse between us is obviously pointless.
I see what you did there! You deliberately conflated the altitude with the temperature so you could falsely claim I am wrong. This has been a pattern throughout our exchanges. In every case I have exposed your relentless word games. It’s been a pleasure!
For the record I said the altitude at which -18°C is found in the atmosphere is variable depending on location and time of year, but it is always -18°C.
PV = nRT controls the temperature of the troposphere, not CO2.
“The IPCC believes that the change in solar radiation over the past 60 years nets to zero and has no trend beyond the normal ~11-year solar cycle.”
You do a calculation of the average 11 year cycle backwards and become flabbergasted…
It’s crashing (aqll as low as the 1895-1905 bottom).
Oddgeir