March 1st, 2022 by Roy W. Spencer, Ph. D.

The Version 6.0 global average lower tropospheric temperature (LT) anomaly for February, 2022 was 0.00 deg. C, down a little from the January, 2022 value of +0.03 deg. C.
The linear warming trend since January, 1979 still stands at +0.13 C/decade (+0.12 C/decade over the global-averaged oceans, and +0.18 C/decade over global-averaged land).
Various regional LT departures from the 30-year (1991-2020) average for the last 14 months are:
YEAR MO GLOBE NHEM. SHEM. TROPIC USA48 ARCTIC AUST
2021 01  0.12  0.34 -0.09 -0.08  0.36  0.50 -0.52
2021 02  0.20  0.32  0.08 -0.14 -0.65  0.07 -0.27
2021 03 -0.01  0.13 -0.14 -0.29  0.59 -0.78 -0.79
2021 04 -0.05  0.05 -0.15 -0.28 -0.02  0.02  0.29
2021 05  0.08  0.14  0.03  0.06 -0.41 -0.04  0.02
2021 06 -0.01  0.31 -0.32 -0.14  1.44  0.63 -0.76
2021 07  0.20  0.33  0.07  0.13  0.58  0.43  0.80
2021 08  0.17  0.27  0.08  0.07  0.33  0.83 -0.02
2021 09  0.25  0.18  0.33  0.09  0.67  0.02  0.37
2021 10  0.37  0.46  0.27  0.33  0.84  0.63  0.06
2021 11  0.08  0.11  0.06  0.14  0.50 -0.42 -0.29
2021 12  0.21  0.27  0.15  0.03  1.63  0.01 -0.06
2022 01  0.03  0.06  0.00 -0.24 -0.13  0.68  0.09
2022 02  0.00  0.01 -0.02 -0.24 -0.05 -0.31 -0.50
The full UAH Global Temperature Report, along with the LT global gridpoint anomaly image for February, 2022 should be available within the next several days here.
The global and regional monthly anomalies for the various atmospheric layers we monitor should be available in the next few days at the following locations:
Lower Troposphere: http://vortex.nsstc.uah.edu/data/msu/v6.0/tlt/uahncdc_lt_6.0.txt
Mid-Troposphere: http://vortex.nsstc.uah.edu/data/msu/v6.0/tmt/uahncdc_mt_6.0.txt
Tropopause: http://vortex.nsstc.uah.edu/data/msu/v6.0/ttp/uahncdc_tp_6.0.txt
Lower Stratosphere: http://vortex.nsstc.uah.edu/data/msu/v6.0/tls/uahncdc_ls_6.0.txt
Discover more from Watts Up With That?
Subscribe to get the latest posts sent to your email.
I’m reminded of that old saying: “A watched climate never cools”.
To which I’d add the following: as soon as you think you know what the climate is doing … it’ll do something else.
(First experienced by the 1970s global cooling alarmists).
I am reminded of the song by Fairport Convention, “Who Knows Where the Clime Goes?”
Hmmmm . . . for some strange reason, I’m now reminded of the phrase “Who’s your Daddy?”
What does the subsurface data show in the equatorial Pacific? The wave in the west is weak and will not raise temperatures in the east.
http://www.bom.gov.au/archive/oceanography/ocean_anals/IDYOC007/IDYOC007.202203.gif
Coastwatch GLSEA SST and Ice Cover
The UAH data tells us three things: 1) The warming trend of 0.13C/decade is in no way alarming and 2) Since the data happens to begin in 1979, during a cooler period, the warming trend shown is exaggerated, and 3) The pause of the last 7+ years indicates that man’s CO2 is most definitely not the Big Cahuna the Alarmists so fervishly like to believe. It is perhaps a micro-cahuna, and we may in fact have already started cooling.
You know, you can look back 10 or so years on this very blog and find comments, and indeed articles, about “the current trend towards cooling…”; “the current pause”… etc. On and on it goes…
But what actually happened over those 10 or so years was further warming. That’s the way it’s going to go this time too. Wishful thinking won’t change that.
Sorry, but an anomaly is the change from a baseline. An entry like 0.0 means we have returned to the baseline temp. It really doesn’t matter what anomalies have done before, we have cooled to the baseline.
To me, that means there has been no warming since the baseline was calculated. There may have been excursions to points higher that the baseline but so what, they weren’t permanent. CO2 is not a singular control knob.
It’s an anomaly from the baseline of 1991-2020, i.e. the average centered on 2005. It doesn’t seem at all odd to me that some months will be below that average.
Compare this February anomaly of 0.00°C with the relative anomaly 10 years ago. February 2012 was -0.23°C below the 1981-2010 baseline. The previous month was -0.20°C, and several months in 2011 had been below average.
Indeed. It seems like this current La Nina-caused dip in temperature is already bottoming out and monthly values haven’t even gone negative yet, relative to the very warm 1991-2020 average – and that’s in UAH!
We have to stem the use of warmist language. By calling positive temperature changes an “anomaly” we are using a politically motivated terminology. What it has come to actually mean is: “Manmade Global Warming Temperature Increase”.
Historically, the Earth has been demonstrably warming since the Little Ice Age in the early 1800’s. Unless and until this trend is changed, any slight temperature increases which follow the magnitude of this warming are NOT an “anomaly”. They are the norm.
I too find the climatology term for subtracting a baseline odd.
Exactly, the baseline is not a flatline. With this, the scientific null hypothesis and horrid error bars in mind, it’s difficult to make a case for even the existence of an ECS to a doubling of CO2 (no matter how hard lukewarmers want to mental masturbate about it).
“Historically, the Earth has been demonstrably warming since the Little Ice Age in the early 1800’s.”
This gives the impression (not saying this is intentional) that only warming has occurred since the Little Ice Age, when in fact, since the Little Ice Age, there have been periods of warming and periods of cooling. The Earth is currently in a cooling period. It is now 0.7C cooler than the 2016 highpoint.
John Pickens posted “By calling positive temperature changes an “anomaly” we are using a politically motivated terminology.”
Please note that against a defined baseline, a negative temperature change is also called an “anomaly”.
Dr. Spencer’s graph at the top of his article posted above shows lots of “negative temperature departures”(i.e., anomalies) from his defined baseline of the average temperature established over the period 1991-2020.
Sorry, I don’t see any politically motivated terminology there . . . instead, just mathematical definitions.
The decline in the Nino 4 index is a lot of rain in Australia.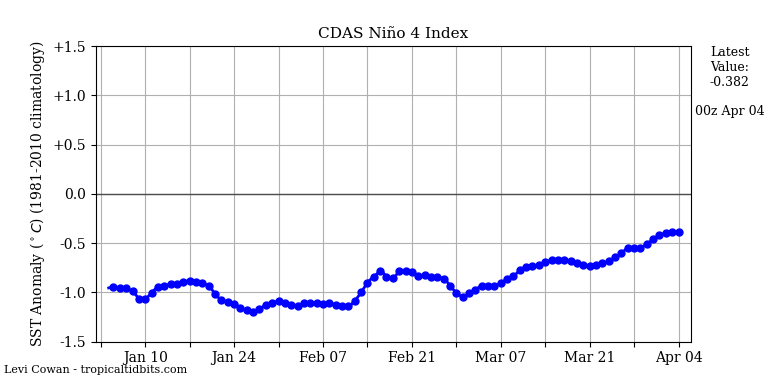
Blocking of the polar vortex in the tropopause and the flow of Arctic air into western North America will soon begin.
China just started testing on a thorium molten salt reactor last fall. If the world had any sense, we would displace fossil fuel energy with nuclear energy from thorium using molten salt cooling. If it does, it will make the CO2 discussions moot.
https://www.nature.com/articles/d41586-021-02459-w
we have reached net zero!
hurray!
[party balloons]
A strong wave of Arctic air will sweep across the US Southwest in three days.
The San Juan Mtns of southwestern Colorado can certainly use a big dump of white stuff, this is actually good news.