
February 27, 2022 By jennifer
Flooding rains have soaked south-east Queensland, again. My heart goes out to everyone affected by flood waters.
I’ve been watching the rain gauge at Lowood (Station# 040120), located just 10 kms to the south of Wivenhoe Dam upstream of the city of Brisbane.
A total of 240 mms fell yesterday (Saturday 26th February) which is a record for any one day since 1888 when they began measuring daily rainfall at Lowood!
I feel I can finally use that word: unprecedented.
While the experts (remember Nicholas Stern) have been claiming it would get drier along the east coast of Australia, a few of us have theorized that it could get wetter.
The data for Lowood is interesting. Not counting this year, or this summer (because it is not yet over), the wettest year on record is 1889-90 with 1,445 mms and wettest summer is 2010-2011 with 987 mms.
But the totals for any one day appear to be increasing.
This is consistent with the idea that as the Earth’s temperature increases, from whatever cause natural or human, there will be increased evaporation over the oceans providing more energy for tropical convection that will result in more intense rainfall.
Drs Peter Ridd and Marchant van der Walt explain how this could result in a strong negative feedback mechanism that would counter the effects of increasing concentrations of greenhouse gases on global temperatures in Chapter 12 of my book Climate Change: The Facts 2020.
When the city of Brisbane last flooded back in January 2011, I thought that would be the end of it. Not the end of Brisbane, but the end of everyone obsessing over catastrophic human-caused global warming.
We had been hearing for some years about how the reservoirs would never fill will water again. How Australia’s were doomed to a thirty future. Then. Suddenly. Large parts of my city – including the entire downtown central business district – were submerged. Not from the rain directly, but from the emergency release of vast quantities of water from Wivenhoe Dam. A dam built for flood mitigation but kept too full of water because of a mistaken belief that it would not rain again: that below average rainfall is to be expected.
Again, as I write this from Noosa – 120 kms to the north – it is raining. It has been raining for three days; not pitter-patter, but rather torrents of rain with lashing winds, just like when Brisbane flooded back in January 2011.
I call Brisbane my city, because I went to boarding school there, and then returned, for my daughter’s schooling. We were there through the drought years before the flooding of January 2011. Back when human-caused global warming was becoming so popular, and many in Brisbane began boasting about how quickly they showered – to save water – because of the claimed declining rainfall across eastern Australia.
Except rainfall was never in decline if one considered the entire record, from the beginning.

It was the release of the report on climate change by Sir Nicolas and the British government in 2006 that more than any other event created the impression it was getting drier. The idea of an endless drought because the entrench myth after that.
Observational data on rainfall for the entire east coast of Australia is available from the Australian Bureau of Meteorology with yearly averages for all the sites back to 1900. Contrary to the Stern report, the data did not show declining rainfall; rather, it indicated that rainfall was very low in the early 1900s, that there were some very wet years in the late ’50s and early ’70s, and over all the trend was one of a slight linear increase to the release of that report back in 2006. Since then, it is even more absurd to claim declining rainfall.
Despite it not being honest to the available data, the Stern Report received rave reviews and an enormous amount of publicity around the world, and is still quoted.
I wrote something of a rebuttal regarding the rainfall bit – explaining that it would likely rain again, and then it would flood. My article was published as an opinion piece in the local Courier Mail newspaper causing my daughter to be embarrassed at school by the Principal.
The school principal came from reading my piece in the newspaper to confronting her with my opinions on climate change in front of her friends at lunch time in the playground. She had the good sense to tell the school principal that his behaviour was ‘inappropriate’.
It was like that: terribly politically incorrect to even suggest that the drought would end one day. It got people upset, and wanting to correct you, or to turn away because they knew the dams would never ever fill again. To suggest that we were going through just another cycle, as I did back then, was heresy.
And now Brisbane is flooding again. And water is being released from Wivenhoe Dam that was built for flood mitigation after the terrible flooding of 1974. That followed the floodings of 1968, 1951, 1947, 1931, 1927, 1926, that followed the floodings of 1908, 1907, 1893, that followed floodings of 1887, 1864, 1863, 1857 and according to some the very worst flood was in 1841.


The feature image is from January 2011, from Sandford Street near the University, St Lucia, Brisbane.
Lowood was one of the sites John Abbot and I used to test our capacity to forecast monthly rainfall, as detailed in the research paper entitled ‘Using lagged and forecast climate indices with artificial intelligence to predict monthly rainfall in the Brisbane Catchment, Queensland, Australia’ published in the Journal of Sustainable Development and Planning, Volume 10 back in 2015.
Someone is lying about the records, as usual. California has the worst drought in the last 1200 years, if one cherry picks a period.
It’s worse than we thought always.
Nobody is lying about the amount of rain which has fallen or the extent of the floods. Are they?
No Griff they are not. The lie is exposed in this little quote:
__________________________________________________
A dam built for flood mitigation but kept too full of water because of a mistaken belief that it would not rain again: that below average rainfall is to be expected.
__________________________________________________
Did you read that part?
He probably did, but as he often proves himself, comprehension is his stumbling block.
Knowing is one thing; understanding, another.
Please!!!
One twit at a time! Two ideas at the same time is too much load for griff’s brain!
What has rainfall measurement to do with management of dams? They are completely, unrelated, independent things! (/s needed?)
I was living in Brisbane at the time of the 2011 floods. Before the floods, there were major concerns about how low the water level had fallen.in Wivenhoe Dam (the major water supply for Brisbane).. An insurance adjuster friend of mine reckoned the Qld Government wanted them to pay for any potential damage to the dam, even though the level had fallen below the level it was insured to. The Qld Premier criticised the insurance company over this, even though they had offered to insure it to a lower level when the dam was first built.
After the mismanaged release from Wivenhoe Dam in 2011, a number of people died in the downstream floods.
So yeah, the dam operators are really interested in the relationship between rainfall in the catchment area, levels in the dam and when they need to do controlled releases.
Regarding your /s, Joao, just thought people might like some background 🙂
Thank you for your details. They show very well that what happens today is the outcome of a chain of actions or natural events, not only of what occurred yesterday. And this was my point.
Where I live, the Iberian Peninsula, three of the five major rivers are international. All five have their springs in Spain. Our climate is temperate on the cold side in the north and on the hot side in the south, so the rain (and river water) regimes vary from north to south, variance of debit increases tremendously as we go from north to south. The landscape is mountinous: average altitude of the Peninsula is higher than average altitude of the rest of Europe (even with the high Alpine chains!). The wise move, taken decades ago, before the birth of the environmentalist ignorant movements and lobbies, was to make dams, small and big, according to the geomorphology, to produce electricity and to keep water to ensure a rather steady supply to agriculture. Of course, this system, and the ability to channel water among bassins, does not work on its own, it needs a permanent technical staff of high standard professionals for its good management. But those services are state departments, and their objectives, financing and staffing change with the “needs” of governing politicians to show virtue… and then we also had (had in recent years, have now, and for sure will have in the future) catastrophic floods and catastrophic droughts.
They lied that they knew that the dams would never fill again so Wivenhoe is not operated as a flood mitigating dam but a storage dam, even after 2011. They will let out water once rainfall has started but not based on BOM predictions of rain fall, which is what is needed for it to really mitigate floods.
Kind of ironic.
No griff, not lying. My buddy Tony has been giving me reports on what he collected in his garden rain gauge every few hours. It totalled 450mm in 48 hours, roughly 18 inches.
If this is a battle between perpetual drought and indefinite flooding, indefinite flooding is winning. I suppose the next disaster will be “flood-induced forest fires”.
The fires come after rain-induced growth leads to a build up of fuel——and then the pendulum swings and a drought develops. As has always been the case.
The key will be in the Greens accepting or refusing good forest management.
…
And, oh, the smiles on every face
As happy lad and lass
Through grass knee deep on Casey’s place
Went riding down to Mass
While round the church in clothes genteel
Discoursed the men of mark
And each man squatted on his heel
And chewed a piece of bark
“There’ll be bush fires for sure, me man,
There will without a doubt
We’ll all be rooned” said Hanrahan
“Before the year is out”
Haven’t heard this one for a while. It might be worth posting the whole thing, to give some context.
Just south of the Queensland-New South Wales border rainfall has been massive for days, creeks and rivers are flooded and spreading across the countryside quickly, reports to talkback radio this morning included people trapped in their homes around Lismore and unable to contact the Emergency Services, longer distance phone calls difficult to get a connection and then dropping out constantly.
State Emergency Services are working hard on search and rescue but having problems dealing with so many areas that are flooded with floodwaters rising.
According to the radar the worst of the rainfall is north from around Coffs Harbour and North to and across the Queensland border.
One question asked this morning was what impact if any recent offshore volcanic activity is having on the weather conditions producing so much rainfall?
This rainfall is directly due to the La Nina conditions … every La Nina, plenty rain and floods.
The rainfall is amplified by climate change
Prove it.
Yes the IPCC says that in a warmer world there will be more evaporation, water vapor and precipitation. So why did they allow a dam designed for flood control to fill when there wasn’t a flood?
Climate propaganda screams drought nearly all of the time to the point that the local functionaries apparently believe it and planned for drought by filling the dam to the point that it no longer provided the protection against floods like it was supposed to.
And blame the bureaucratic incompetence on “climate change.” F big government.
Steve
The IPCC is correct saying that if the world is warmer, the atmosphere will hold more water vapour. However the IPCC did not emphasize that if it is warmer everywhere, the “cold side” of the weather is also warmer. by the same amount.
When the “before and after” temperatures are all 1 degree warmer, there is essentially no difference in precipitation. They cannot have it both ways. If the air holds more vapour because everywhere it is warmer, the air also retains more vapour because the Delta T is no different “in a warmer world”. If the Delta T is the same the precipitation is the same.
The IPCC is trying to create alarm over “more water in the atmosphere” without also noting no increase in precipitation will result. They rely on public ignorance to sell this fake disaster/warning.
The best public protection is an adequate education about how the world works.
Correction: Warmer air CAN hold more moisture. There are no conclusive measurements to show that the amount of moisture has increased in the atmosphere.
” The rainfall is amplified by climate change ”
Very accurate, but incomplete statement. “The rainfall is amplified by climate change” depending on the place and time. Climate change does not amplify rainfall in SW USA which, as anyone knows, is in permanent drought, each each year worse than before.
Taking another path of reasoning:
“The rainfall is amplified by climate change” when it is convenient for the climate alarmist narrative; otherwise, it does the opposite (as in SW USA).
Higher or lower rainfall might be examples of climate change but they can’t be caused by climate change. Climate change is about results, not causes, surely? The cause is supposed to be global warming but as there hasn’t been much of that, the alarmists have to talk about “climate change”.
Alba
I chuckle when i read about “climate events”. In line with your thinking, there are no “climate events”. Climate is the average of weather. There are “weather events”. There is also weather with no notable “events”. Imprecision begets ignorance which begets more imprecision. It is a positive feedback loop of ignorance. It advances by degrees.
Better tell that to griff, because he seems to ignore what is weather and what is climate, and how the first varies and the second changes, in both cases as the effect of natural causes (and even if among those causes there are some which are the outcome of the existence of humans, which are very natural objects).
If it permanent dough it because I live in a desert. The rain fall last year for where I live was over ten inches, the average is seven. The year before was normal even though we got less than a inch in the last half of the year. Now there is a problem with the Colorado river flow, of course the dirty little secret is now 20% of that water ends up in Denver. Got to blame the low flow on drought. Not the over estimation of the caring capacity of the river in normal times, not the over optimistic estimates when they were damming it up and creating all the diversions.
It takes an enormous imagination to see climate change in 121 years of rain fall data that shows a rather stable long term trend.
Another Definition of Enormous Imagination: Science Fiction.
Or is the drought, which
Heretic ! It was amplified by the noodly appendages of The Invisible Flying Spaghetti Monster.
NB : I have provided exactly the same amount of “supporting evidence” (in a single post) for my incoherent ramblings as you have provided for yours (over the last decade).
Next week it will be deamplified.
There is about a metre rainfall around the globe each year, on average. From 12 m to almost 0 m. There is no noticeable trend in the average. The distribution has never been constant. The Sahara and Arabia were once very green. Somewhere, there is a negative trend in the past 100, 50 or 20 years. Somewhere else, it’s positive. It changes depending on choice of period.
Australia’s highest daily recorded rainfall is Crohamhurst, in 1883, which is 93 km from Brisbane. Over 900 mm. The nearest open station might have just exceeded that over the past week but its just weather.
This rainfall in Eastern Australia was not caused by La Nina, volcanoes in any other silly idea. Nor Global warming or lack of it. It was the result of a large blocking high pressure system that sat nearly stationery down off the South Island of New Zealand for over a week and in combination with a low pressure system to the north east of Brisbane caused a strong wind gradient of very moist air to flow in over the coast for an extended period.
These blocking highs form from time to to time and they were the direct cause of the bush fires the year before last when they caused a hot airmass to flow down from Central Australia to help fan the fires.
I’ll give Griff a break on this one. Of course he’s right. “Amplified rainfall” could be any of the following:
There’s more rain.
There’s less rain.
There are more droughts.
There are fewer drought.
The lengths of droughts increase
The lengths of floods increase.
Etc.
His answer is prefect…for a climate ‘scientist’. The word ‘amplified’ is quite flexible.
There has been mild warming now since about 1850 or so. If you are right there should be a corresponding record of increased rainfall. But the record is no significant change. Just usual fluctuations.
So December 2019 to January 2020 bushfires where I live, by March 2020 heavy rainfall and floods, and now again floods in February-March 2022.
Climate hoax?
Or just weather events, years of drought before the bushfires.
If you check Aust temps lately you will find that is cooler than usual, especially in Qld and NSW. This rain event is due to La Nino, pure and simple. http://www.bom.gov.au/climate/change/#tabs=Tracker&tracker=timeseries&tQ=graph%3Dtmean%26area%3Dnsw%26season%3D02%26ave_yr%3D0
la nina
“While the experts (remember Nicholas Stern) have been claiming it would get drier along the east coast of Australia, a few of us have theorized that it could get wetter.”
I don’t see a quote there of what Stern actually said, but generally coastal Queensland is not expected to get drier. Here (p 10) is what the Qld Office of Climate Change says, reflecting the scientific advice
“The HiGEM model was used to examine how Queensland’s climate might change in the future. With carbon-dioxide levels increased to predicted 2090 levels, there was little change in total annual Queensland rainfall, but marked changes in when and how the rain falls during the year. The wet season is projected to start slightly later and end significantly earlier, due to an earlier retreat of the monsoon. Although the wet season becomes shorter, it also becomes considerably more intense, so that overall rainfall does not change”
More intense rain in the middle of the wet season seems in line with predictions.
Intense 😉
Hi Nick, It’s in that 700-page report somewhere with a chart that begins in about 1970, from the Bureau for Eastern Australia rainfall. They cherry-picked the start date. The report/Sir Nicholas claimed we already had declining rainfall along the east coat of Australia. It was all over the news here for a couple of days back in 2006; I clearly remember the interview with journalist Fran Kelly. She was so excited that the drought would be forever. Then I downloaded the report and found the chart they had been talking about on radio. I subsequently wrote an OpEd for The Australian newspaper a week or two later. I can’t easily find the report in my filing at the moment. If someone could download the report/go through the report and find that chart and the exact quote and note it here in this thread that would be much appreciated. I have other things I need to get done this week. :-).
The wettest year in my district, just south of Brisbane was
1893 with1726mm.Next
1947 with 1418mm. One of the driest was
1994 with 453mm.
Average, .935mm, recent years in the 1i00mm area.
260mm here yesterday, giving
619mm for the month, & 744 for the year to date.
It might even challenge 1893 if it keeps going
If anyone can pick some trend from that I’d like to hear it.
Australia’s wettest day was 907 mm about 90km north of Brisbane in 1893. That this recent rainfall for the SE Queensland is a record might just be due to a poor record. Crohamhurst’s station has since been closed. There is no other that is still open and has records so far back within 20km.
Did Lennox Walker’s son close it down, or what? I seem to remember it still going about 10 years ago, and it was highly regarded in some quarters for its long range forecasts. Personally, I have never been a fan of long range forecasts in anything.
In Feb, 1893 there were 3 floods. Two of these are rated 2nd and 3rd worst floods for Brisbane (after 1841). In that month in 1893 there was 1025mm which is just shy of the yearly average (1148mm). The first 3 months yielded around 1500mm. Here’s a photo of the Great Flood of 1893.

keeping reading Nick
“It is important to emphasise that these results come from a single climate model and that other climate models are likely to give different projections. These results should not be considered as a definite prediction of changes in Queensland’s climate, but as a possible future climate projected by a model that has been shown to robustly simulate Queensland’s present-day climate.”
But the present rain event is in line with their prediction, not contrary to it.
Nonsense, the present rainfall is in line with the weather. BoM can’t even get a 3-day forecast right and you want us to believe that ? Here, pull my other finger.
Their prediction 😉
Their predictions for 2090. Desperation is ugly, Nick.
Very deceitful. The Stern report was written in 2006 and this one was written after after the 2011 floods. They are predicting from short term trends, not robust science.
It’s raining.
But Brisbane is not Queensland! I’m in Mackay, around 800km north thereof. Average rainfall for Jan/Feb is around 640 mm. We had around 250mm. Is that in line with the prediction? It’s called weather.
‘There is no clear long-term trend in annual or seasonal-mean rainfall in Queensland over the last 100 years—the period for which we have reliable rainfall records.’ Its a pity that those believers in a catastrophic narrative get the story straight.
No disrespect to those that carefully collect data and make rigorous conclusions from it.
What we need need in Australia is scientists calling out the doomsayers.
The Flannery edict was so powerful that people on the ground, especially voters and politicians thought that our dams would dry and the ground would be so hot that water would not run off.
This affects real people,the last devastating floods at Wivenhoe being a case in point.
The dam did not follow the narrative.
Just as a point of correction, its not just Qld. around Brisbane that’s wet.
Its been pouring all the way down the Eastern seaboard of the continent of Australia.
Just to let our international readers a taste of the situation, our dams are overflowing.
https://www.waternsw.com.au/supply/Greater-Sydney/greater-sydneys-dam-levels
Regional climate models are garbage. Especially the region of Queensland -1.8million sq km
Every time someone models River Catchment X and comes up with a global warming hypothesis why the rainfall or flow changes, the hypothesis doesn’t work for adjacent River Catchment Y.
The claim was that
“While the experts (remember Nicholas Stern) have been claiming it would get drier along the east coast of Australia”
and that is just not what they claim. You may doubt the basis for what they really do claim, but it’s important to quote them and get it right.
One sparrow a summer does not make.
This is more a summer for ducks. But the point of this article, as far as I can tell, is that the experts predicted drying, and look at all this rain! Well, they didn’t predict drying, and they did predict more intense wet seasons. A wet summer doesn’t prove them right in the long term, but it sure doesn’t make them wrong.
Depends which State you are in 🙂
Good to see you posting , Nick
You will know this Australian poem from 1921
Said Hanrahan“We’ll all be rooned,” said Hanrahan,
In accents most forlorn,
Outside the church, ere Mass began,
One frosty Sunday morn.
The congregation stood about,
Coat-collars to the ears,
And talked of stock, and crops, and drought,
As it had done for years.
“It’s looking crook,” said Daniel Croke;
“Bedad, it’s cruke, me lad,
For never since the banks went broke
Has seasons been so bad.”
“It’s dry, all right,” said young O’Neil,
With which astute remark
He squatted down upon his heel
And chewed a piece of bark.
And so around the chorus ran
“It’s keepin’ dry, no doubt.”
“We’ll all be rooned,” said Hanrahan,
“Before the year is out.”
“The crops are done; ye’ll have your work
To save one bag of grain;
From here way out to Back-o’-Bourke
They’re singin’ out for rain.
“They’re singin’ out for rain,” he said,
“And all the tanks are dry.”
The congregation scratched its head,
And gazed around the sky.
“There won’t be grass, in any case,
Enough to feed an ass;
There’s not a blade on Casey’s place
As I came down to Mass.”
“If rain don’t come this month,” said Dan,
And cleared his throat to speak —
“We’ll all be rooned,” said Hanrahan,
“If rain don’t come this week.”
A heavy silence seemed to steal
On all at this remark;
And each man squatted on his heel,
And chewed a piece of bark.
“We want an inch of rain, we do,”
O’Neil observed at last;
But Croke “maintained” we wanted two
To put the danger past.
“If we don’t get three inches, man,
Or four to break this drought,
We’ll all be rooned,” said Hanrahan,
“Before the year is out.”
In God’s good time down came the rain;
And all the afternoon
On iron roof and window-pane
It drummed a homely tune.
And through the night it pattered still,
And lightsome, gladsome elves
On dripping spout and window-sill
Kept talking to themselves.
It pelted, pelted all day long,
A-singing at its work,
Till every heart took up the song
Way out to Back-o’-Bourke.
And every creek a banker ran,
And dams filled overtop;
“We’ll all be rooned,” said Hanrahan,
“If this rain doesn’t stop.”
And stop it did, in God’s good time;
And spring came in to fold
A mantle o’er the hills sublime
Of green and pink and gold.
And days went by on dancing feet,
With harvest-hopes immense,
And laughing eyes beheld the wheat
Nid-nodding o’er the fence.
And, oh, the smiles on every face,
As happy lad and lass
Through grass knee-deep on Casey’s place
Went riding down to Mass.
While round the church in clothes genteel
Discoursed the men of mark,
And each man squatted on his heel,
And chewed his piece of bark.
“There’ll be bush-fires for sure, me man,
There will, without a doubt;
We’ll all be rooned,” said Hanrahan,
“Before the year is out.”
Thanks Tony,
Yes, we’ve always had droughts and farmers complaining about them. But that doesn’t mean they can’t get worse, as they definitely have in SW Australia.
There are three things that bring rain to parts of our dry continent
1. Westerlies in winter (Roaring Forties) for SW WA to Vic/Tas
2. SE Trade Winds for East Coast
3. Monsoons for the North
Of these the westerlies are receding to the S, and the monsoons are advancing. No clear expectation of change in the Trades. Some parts get wetter, some drier.
Who are “they”?
“They” is one model presented by Nick.
Apparently, they/them are the model’s preferred pronouns.
They did predict drying at the time because it was a dry time. Since it is now wet, they predict more “intense” wet seasons. Whatever keeps the OPM flowing.
Stern Report can be found here:
https://webarchive.nationalarchives.gov.uk/ukgwa/20100407172811/https:/www.hm-treasury.gov.uk/stern_review_report.htm
To quote from Part II, Page 8:
“At the same time the east coast – home to over 70% of the population and location for most major cities – has suffered longer droughts and declining rainfall.”
“Drier and hotter summers threaten the survival of the Queensland rainforest.”
Frankly, to say that the Stern Report is Alarmism on steroids is being kind. It’s about as biased and one-sided as it’s possible to get.
Then quote Stern, Nick, not just someone spouting the current dogma.
You use a report written after the massive 2011 flood to rebut a claim that The Science in 2006 said it would be drier.
Extremely dishonest.
“You use a report written after the massive 2011 flood to rebut a claim that The Science in 2006 said it would be drier.”
OK, here are some of the things the IPCC AR4 said in 2008 (Chapter 11):
“Changes in rainfall in northern and central Australia are uncertain. Extremes of daily precipitation are very likely to increase.”
…
“On the east coast of Australia, there is a tendency in the models for an increase in rain in the summer and a decrease in winter, with a slight annual decrease. However, consistency among the models on these features is weak.”
…
“Recently, Abbs (2004) dynamically downscaled to a resolution of 7 km current and enhanced greenhouse cases of extreme daily rainfall occurrence in northern New South Wales and southern Queensland as simulated by the CSIRO GCM. The downscaled extreme events for a range of return periods compared well with observations and the enhanced greenhouse simulations for 2040 showed increases of around 30% in magnitude, with the 1-in-40 year event becoming the 1-in-15 year event.”
They aren’t certain, but they aren’t predicting drier summers in Qld, as claimed here. In fact, it’s pretty consistent with what has happened since.
There is a reason for my use of “The Science”. Its cherry picked for media releases. Only research predicting drought is re referred to when dry. The other half gets dragged out when it rains. Stern chose to report that The Science says drier.
And its “by up to 30%” by 2040 in SE Queensland when extreme weather events happen, which will be less often. This is still short of 1893.
“Commonly, return periods of extreme rainfall events halve in late 21st-century simulations.” so not predicting that this will be more often, Just 30% wetter when it does.
Its written so that anything that happens can fit the prediction for superficial people.
“but they aren’t predicting drier summers in Qld”
…but the Stern report DID, which was the point made originally – see the quote in my previous post above
It didn’t. It said there had been droughts (true) and said that somewhere, rain forests might suffer from the heat.
You presented that ONE model that doesn’t predict it to get drier…in 2090.
How does anyone ever take you seriously?
I presented the current advice from the Qld Office of Climate Change.
What no-one has presented is quotes of any expert saying that it would get drier in SE Qld, as claimed in the article. All we have is Stern noting that there have been recent droughts, and saying that somewhere (probably Far NQ) rain forests might be damaged by dry heat.
Can you say “La Nina” ? Nothing to do with “climate change”.
Didn’t you also say the other day that the Ravenshoe weather station has had numerous moves ? Well, from my recollection, according to what JM has written, it hasn’t moved and this is a statement supposedly made in its official record.
No, I’ve never said anything about Ravenshoe.
While being very variable there has been no apparent rainfall ‘intensity’ trend (tracker-> northern wet season-> Queensland) while the atmospheric CO2 concentration has risen monotonically from 300 – 400ppm.
I’m not sure you’re understanding what rainfall intensity means. I don’t see how you get any information about rainfall intensity from the link provided. Think through it logically: with a possibly shorter wet season but more intense rainfall events, on average, what would you expect to happen with:
1) Total rainfall in the wet season?
2) Number and severity of flooding events in the wet season?
3) Total amount of water “captured” (By soil/dams etc) during wet season.That is, the amount of water which is not lost to run-off?
4) Level of soil moisture on the date the dry season used to start?
The rainfall for Queensland never goes above 200 mm above the average for 1961-1990 in the first half of the 20th C. It then has years 500 mm above the average starting in 1949.
“ For example, the intensity of the 1-in-20 year
daily rainfall event is likely to increase by up to 10% in parts of
South Australia by the year 2030 (McInnes et al., 2002), by 5 to
70% by the year 2050 in Victoria (Whetton et al., 2002), by up
to 25% in northern Queensland by 2050 (Walsh et al., 2001) and
by up to 30% by 2040 in south-east Queensland (Abbs, 2004)’
I don’t even know how to interpret this. 30% more than the average of 622 mm is 200 mm. Extreme years went up 250 mm before Human emissions could be responsible. Most likely due to poor records but could be natural climate change. And yet the 30% increase is predicted by 2040.
Three of the 300 + anomalies are before 1974, two within a 10 year period, 70 years ago. The plot will be update at the end of the year to include 2022 so that there will be two such events in the past 11 years.
It is only consistent with The Science if you are superficial.
what that means is mostly it doesn’t rain, except in short intense epic downpours which flood.
I guess ‘on average’ between severe drought and severe rainfall you can twist it to ‘normal’ average rainfall
ROFL so now it’s average except between drought and epic rainfall … we used to call that weather 🙂
griff, have you ANY idea of what are the characteristics of temperate climates (I am beeing nice to you: don’t need to go to Kopen, just to the older, simpler classification)? Of the difference between temperate cold and temperate hot climates? Of the distribution of rainfall in those climate classes? Of the monthly/seasonal distribution of rain in those classes? The annual range of precipitation in each of them?
Probably not. Because if you had ANY rough idea about that, you would understand the meaning of “averages” in this context. By the way, climatologists, i.e., the real specialists of climate, know the answers to all those questions very well: it is fundamental, all scientific knowledge of climate starts from that.
So climate change leads to more intense normality?
“what that means is mostly it doesn’t rain, except in short intense epic downpours which flood.”
As I have said before, welcome to Australia – that is precisely the nature of the climate. Floods and droughts are the norm, not the exception.
Jennifer Marohasy showed the data for rainfall in Australia over the past 120 years or so – and guess what, lots of year-to-year variation, but the only trend is a slight increase in annual rainfall.
Nick,
The stern report gives no hits to wordsearches for Bureau of Meteorology, BOM, CSIRO, HiGEM, Queensland Office of Climate Change.
One is therefore left wondering where Nick Stern got his data from, for in his Review we can read (verbatim) at page 8
” Drier and hotter summers threaten the survival of the Queensland rainforest. Warmer winters and reduced snowfall endanger the habitat of mountain top fauna and flora. Rising ocean temperatures threaten the future of Australia’s coral reefs and the $32 billion fishing and tourist industries. Over 60% of the Great Barrier Reef suffered coral bleaching in 2002, 10% of it permanent. Studies show ocean warming could be fatal to large tracts of reef within 40 years. Higher inland temperatures are likely to cause more bush fires”
This is easliy read to be at odds with what you have written above.
How to you match up what you wrote with what Stern wrote with what Jennifer wrote?
“Drier and hotter summers” would seem to be at odds with your offering of “Although the wet season becomes shorter, it also becomes considerably more intense, so that overall rainfall does not change””
Calling you out here, Nick. Cheers Geoff S
Stern’s report and expertise was economic, not meteorological, and it was written in 2006. None of the bits you refer to are inconsistent with heavy monsoon rains in SE Qld. The only thing that even remotely relates to rainfall there is the statement about rain forests, though that probably refers to NQ. But even so, the specific Qld statement I quoted says that the wet season will shorten, which means more dry heat in Dec/Jan.
But Nick,
Where in the Stern Review is there a link to your words about wet season will shorten? I cannot find anything like it.
So far as I can discern, the words used by Jennifer were an accurate reflection of what Stern wrote. Geoff S
As I said, with link, the quote was from the Qld Office of Climate Change. They are giving the specific advice for Qld. The Stern report was about other things.
Nick,
This is how it started:
“While the experts (remember Nicholas Stern) have been claiming it would get drier along the east coast of Australia, a few of us have theorized that it could get wetter.”
I don’t see a quote there of what Stern actually said, but generally coastal Queensland is not expected to get drier.
You didn’t criticise Stern’s credentials in your original post. You asked for a quotation. Well you got one and it backed up what jennifer said. Nor did you make any mention of the year of publication. It was only after it was shown that jennifer was correct that you had to fall back on the credentials and date of publication red herrings.
“Well you got one and it backed up what jennifer said.”
It didn’t. But in fact the expert predictions have always been for heavier summer rainfall events in Qld.
Again, what she said was
“While the experts (remember Nicholas Stern) have been claiming it would get drier along the east coast of Australia”
“Stern’s report and expertise was economic, not meteorological, and it was written in 2006.” Just spinning it now, playing with words. Now his report doesn’t count it seems. What is your comment on Flannery’s statement that the rain that falls won’t fill our dams?
It takes a lot of spinning to turn a remark about past droughts and a warning of possible damage to rainforests, which is all that is quoted from Stern here, into an assertion that “the experts have been claiming it would get drier along the east coast of Australia” . Not a single expert has been quoted saying that, including Stern. I have quoted many experts decidedly not saying that.
Nick, you again blow warmunist smoke. A more “intense” rainfall season (with no change in amount) is predicted by the UN IPCC CliSciFi models in 2090, presumably using your old friend RCP8.5. It is not supposed to be happening today, according to the current government propaganda you cite. But, since it is currently wet, CliSciFi profiteers use that as proof of CAGW. Wet, dry, whatever; we’re all gonna die (from CAGW).
Slightly mixed on this.
Back before my career change back into the Mechanical field I spent about 3 years doing civil drafting. (Hey, I needed the money, don’t judge me!)
Vast majority of my work was sub-divisions and the meat of sub-division work was making sure the stormwater worked. While I was never high on the responsibility food chain and never had to formally sign off on anything, I did do enough to understand the principles.
The base one (after ‘water flows downhill’) is that anything that falls in the catchment area has to go somewhere and the way to prevent flooding is to ensure it drains off to ‘somewhere’ at an equal or greater rate than it is arriving.
If my memory serves you designed to 1 in 10 year rainfall. Anything greater and you assume the road itself will hold the excess until it can drain. Anything greater (1 in 100 events) and you assume the entire road plus the footpaths will flood and your cross sections were designed that the entire road reserve (which is property boundary to the property boundary across the road) is a shallow depression that can hold water.
So I look at these pictures and wonder who took design shortcuts.
Re the residential shown by Jennifer, looks to me like the clutter there is from the ground floors of the houses where only a few inches of water is sufficient to wreck furniture. Note the Frig standing upright further down the street, water damaged and told it would cost more to repair than buy new (looking at costs of new frigs I doubt that). Could well be from a new area designed in accord with your principles, but note road goes uphill into the distance. All the water there would have come down to settle in the lowest part of the road.
Re the flooding at the shops, they are typical of pre-war (which war) design when shops were put up with no reference to flooding.
Have seen good pictures on the TV of the flooding, including one with water level just below the green lamp on a set of traffic lights, but the lights still working. Good design.
I’m just south of the border, on top of a hill, no problem with flooding! Had to top up my pool as the wateer level was too low, If I had waited a few days could have filled it from half empty! But because of the grey skies my solar heating has been using the reserve mains connection, and I am sure all the roofs I see with solar panels have contributed noting to their owner’s pockets.
Yeah, doesn’t take much water contact to utterly ruin some items, although with some others (like the traffic light) they just don’t really care.
(although traffic lights are relatively basic beasts at the pole end. I think the relays that control them are a lot more sensitive, but the poles are basically just methods of keeping the physical lights above the ground.)
I just feel that unless you are physically in a flood plain or the middle of a river valley you shouldn’t be flooded. Water isn’t a dark art. We have enough records to be able to extend our bell curves out to extremes. We may not be able to control the weather, but we should have a solid understanding of the possible effects of weather and SHOULD have engineered solutions.
And after the 2011 floods – once bitten twice shy?
Still, at least as far as I know Kevin Rudd isn’t wading around dobbing in elderly gentlemen in to the cops.
I’m inner suburb of Brisbane at 24m above AHD … been looking forward to building my jetty out front for some time based on Nick’s opinions … no waterfrontage for me yet 😉
Somebody back in the 1800’s. These are old suburbs … some newer ones built on old flood plains have problems. Nowadays there are no design shortcuts, the operational works permit process will make sure of that.
Craig
You are generally correct.
Modern applied hydrology dates from the 1960s.
All subdivision rules tightened in late 1980s early 1990s depending on jurisdiction .
Here in Victorian, Australia (1988 Subdivision Act).
The vast majority of drainage issues occur in pre 1960s developments.
Additionally, Urban Flood Mitigation is well urban. Historically farmers sought out locations that flooded. Historically, pre roads, people settled along rivers for transport.
Global warming of one degree over a century should increase the annual rainfall by 7%. About 40 mm on the graph….if you look closely you can see it…..
Do I need the /s ?
When ever someone talks about how wet or dry a particular year or period is (or was) I send them here. Used to have an up-to-date poster on my office wall and was always a greater talking point.
Have there been any sightings of Tim Flannery around Queensland recently?
They should be hold festivals and parades (probably in boats, but still) is his honor!
Tim has the same effect on rainfall that Al Gore has on snow storms whenever he visits somewhere.
Unprecedented!
Thank you for the great data on rainfall.
I must congratulate your brave daughter for pushing back so brilliantly against that principle…. What a jerk and so disappointing from an educator to present such prejudice.
I admire your work…. Thank you.
Yes, I quite agree…unbelievable that she had to go through that. However, I’m sure she has learnt valuable lessons from that event (and her mother).
rain will be a rare and exciting event….children just won’t know what it is…./sarc
Inigo Jones weather warned of this for the last 3 months but Facebook blocked him with this: This Page has repeatedly shared false information.
When are these “fact deniers” going to be held accountable??
because you cant get negative daily rainfall, if you wait around long enough you will always get a new maximum daily record.
Yes, its difficult to get a long-term downward trend in something that can’t go negative, so climatologists invented “accumulated-rainfall-deficit”, deficit being relative to “normal” rainfall, which is conveniently defined using the rainy period around 1970.
So history does repeat itself with climate. Who’d have thought?
I’m not convinced, a quick search on Trove brought up two reports from 1908 and 1928 that both make reference to the 1893 flood:
“Reports from Colinton, at the head of the Brisbane River, state that 13 in (330 mm) of rain have fallen there during the 24 hours, and the river at Cressbrook was as high as in the 1893 flood …… The rainfall in’ Brisbane and suburbs the past 24 hours ranged from 8 (203 mm) in as high as 12 (304 mm) in according to locality” (The Adelaide Advertiser March 16 1908).
“Heavy rains are reported from the tipper [upper] reaches of the Brisbane and Stanley Rivers in the vicinity of Mount Stanley, where the water is the highest since 1893 flood” (The West Australian Feb 1928).
Scattered freak downfalls that happen to be recorded at particular locations in generally heavy tropical rainfall conditions indicate nothing about the long term trends or climate change IMO.
This facebook page has pictures of Brisbane floods going back to 1800’s … Old Brisbane Album (1) Old Brisbane Album | Facebook
I have no doubt that the climate pundits will reveal that they had predicted flooding all along, and it’s all down to fossil fuels.
Nick Stokes is already claiming such.
Along with Griff except when there is a drought somewhere then it will also be Climate Change. Whatever is in the News is Climate Changes fault.
I dare say if you look around at greentards there will be one claim that Ukraine is Climate Change at work.
The Guardian have already printed that. Kerry has already publicly stated saving the planet from CO2 is more important than saving Kyiv.
WE must not allow these distractions to take our focus away from the real dangers. He is past the delusional stage and well on the way to full blown crazy.
(1) The dam(n) bureaucrats are at it again! Wivenhoe Dam is 55% full … a long long way from the fateful 2011 floods when the dam was near capacity and the sudden huge releases were made at the peak of that devastating flood. These people are making the flood damage worse yet claim that it is not impacting levels … can you believe it ? I’m sure this is a result from the damning conclusions of the Commission of Inquiry.
(2) Water shortages in our major cities, particularly Brisbane, are caused through a lack of storage capacity, dams that the socialist state governments won’t build. Our population in Brisbane has almost doubled since the last dam was built. Wonder why drought is such an issue for us ?
I have some data from the Seqwater people on the Somerset and Wivenhoe Dams.
6:18 PM 26-02-2022
Full Supply Volume 1,615,240 megalitres
Operational volume 1,051,460 megalitres
Current Volume 1,469,159 megalitres (126.1% of capacity)
2:58 AM 27-02-2022
Full Supply Volume 1,615,240 megalitres
Operational volume 1,051,460 megalitres
Current Volume 1,730,810 megalitres (148.5% of capacity)
6:16 AM 27-02-2022
Full Supply Volume 1,615,240 megalitres
Operational volume 1,051,460 megalitres
Current Volume 1,822,720 megalitres (156.4% of capacity)
The inflow was 90,000 million litres in 3 hours.
Sounds like “perpetual drought” to me.
“Lowood was one of the sites John Abbot and I used to test our capacity to forecast monthly rainfall, as detailed in the research paper entitled ‘Using lagged and forecast climate indices with artificial intelligence to predict monthly rainfall in the Brisbane Catchment, Queensland, Australia’ published in the Journal of Sustainable Development and Planning, Volume 10 back in 2015.”
So did it work? It seems like this would have been the ideal month to be able to forcast rainfall in advance.
‘Again’
and once again we see a new rainfall and flood records…
“Some of the rainfall totals that we’ve seen over the course of this event have been approaching rainfall totals that we would normally expect over the course of a year,” said Bureau of Meteorology forecaster Diana Eden.
This IS climate change… a pattern of sever drought/wildfire alternating with torrential, epic rainfall.
This is the 4th off the scale rain event in the last year.
Had an Aunt who lived in Lismore when I was a kid in the 1950s.
She had to come and stay with us in Brisbane every summer rain season.
Then Dad used to have to go to Lismore after the annual flooding of the Wilson and Tweed Rivers and clean up her house.
Funny, as kids we knew that every summer brought floods to our little part of the world.
Our school teachers didn’t even need to tell us these were climate change events, they just warned us to stay away from the creeks.
Seems to me people were more informed back then just by what they saw and experienced for themselves – no “experts” were required to save us from what we knew nature would present.
Only to your Griff because you are special 🙂
” This is the 4th off the scale rain event in the last year ”
That is the simple proof that climate IS NOT changing: did you count all the WEATHER events that WERE NOT “off the scale”, as you say? (if you did, let me guess: you found more than 350? … Against 4, that is fairly stable…)
Again how many records could you reasonably expect to fall each and every day in a world as big as this with historical records as short as we have? The answer is a lot. Griff you are nuts.
“This IS climate change…”
Only in your eyes.
In the real world, not so much…
My recent composite rainfall reconstruction for Brisbane, an area with a strong gradient, much more rainfall at the coast than inland. No sign of the widely reported “new-normal” drought, and indications of heavy transient rainfall in the past:
There will be more rain in Australia. La Niña is not going away. Index SOI is around 10.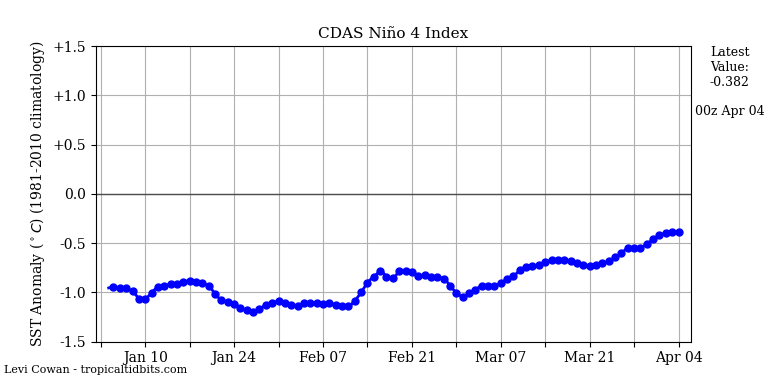

We bought a home in Jindalee, a Brisbane suburb, in Feb 1973 and sold it in July that year to go live in Sydney. My wife liked a near-hilltop Jindalee position and remarked darkly about the stupid people building big homes right on the Brisbane River, at the bottom of the hill.
Jennifer notes ” … the Wivenhoe Dam that was built for flood mitigation after the terrible flooding of 1974″.
Many of the riverside homes, we were told, were in water up to the roof in that 1974 flood. The home we sold was one of several able to house and feed the residents of such.
Common sense seems to be even shorter supply nowdays, when you try the mental gymnastics of, for example, electricity generation in the modern era. Geoff S
If you live on a volcano
Don’t be shocked by lava in the living
If you live in the path of hurricanes
Don’t be miffed by a missing roof
If you live on a floodplain
Don’t be surprised by floating furniture
Can we get the name of the school principal so we can ridicule him?
Isn’t this near the place where the spectacle of Koala-killing droughts and fires dominate the news every 5 years or so? From someone looking in from the outside, this is a water management (storage and transport) issue. Our people use to be great engineers, building dams, canals, and pipelines. We don’t need to be victims of the natural world.
yes.
Because they now alternate between drought/fire and a year’s rain arriving in one go.
“they now alternate between drought/fire”
Wake up!! They always did! This is nothing new
I love a sunburnt country
a land of sweeping plains
of rugged mountain ranges
of droughts and flooding rains.
Dorothy Mackellar
Written a century ago. I wonder why …..
Keep quoting it Ed. It is a truism that really pisses off alarmists (“If I hear that one more time….!”) because it is, well, true. It offends their silly belief system.
They would be in shock if they could read my mate’s family farm diary recording daily weather conditions in country Australia, records back before 1900.
IMHO the criticism of Wivenhoe Dam operators in 2011 reeked of “being wise after the event”
Any notion that they should have released drinking water to the sea on basis BoM forecasts is risible.
BTW the authors preferred Lowood rain data is missing Feb 1893 – month of notable Brisbane flood.
But Esk Post Office 40075 a bit further north and nearer the Wivenhoe catchment scored just over a metre of rain for Feb 1893.
Biblical.
Wivenhoe was originally a purely flood mitigation dam, not water supply. It then became dual-purpose, with 50% of actual capacity reserved for the original purpose. it was at 150% nominal capacity during the rain, but water wasn’t released despite the forecast (and rain radar) showing heavy rainfall in the catchment over the next 24 hours.
That made some sense, because early controlled release would have added to the existing flooding.
Instead, when the rain did arrive, a much larger release occurred, which greatly increased river heights.