
.
This video examines the dishonest misinformation regarding sea level rise.
Disturbingly, the UN members of the COP26 Climate Conference, America’s Department of Defense, National Public Radio, and mainstream media have all been intensifying sea level rise fear-mongering to amplify the COP26 climate crisis agenda.
All their fearful narratives ignore measurements of Absolute Sea Level which is the only relevant measurement by which to measure climate change. Absolute sea level rise reveals their fear mongering
A transcript is available at
https://perhapsallnatural.blogspot.com/2021/11/sea-level-rise-misinformation-fear.html
Jim Steele is Director emeritus of San Francisco State University’s Sierra Nevada Field Campus, authored Landscapes and Cycles: An Environmentalist’s Journey to Climate Skepticism, and proud member of the CO2 Coalition
All their fearful narratives ignore measurements of Absolute Sea Level which is the only relevant measurement by which to measure climate change. Absolute sea level rise reveals their fear mongering
__________________________________
The only thing the locals care about is the sea level rise at their local tide gauge. Which doesn’t have anything to do with carbon dioxide, or global temperature.
They don’t actually care about sea level rise at their local tide gauge as Steele pointed out. If they did, they would see that it’s minuscule. They only care about alarming climate model predictions and who can inflate the numbers more. They like being alarmed. It’s like a prolonged buzz. Data and science are a buzz kill.
Sea level rise obtained from a “local tide gauge” is meaningless if that gauge is not adjusted, say, on a yearly basis for uplift or subsidence of the land to which it is anchored.
“Sea level rise obtained from a “local tide gauge” is meaningless”
Meaningless is not correct, at all.
As Steele points out, absolute SLR is generally given as 8.5 in/century. Sometimes people want to argue the fine points and values of ~6 to 12 in./century will be tossed around. I would not bother to dispute any number in that range, it’s all good.
Let’s get back to local tide gauges. The vast majority show 9 inches (eustatic) +/- 3 in./cen. for uplift or subsidence. That brings us right back to ~6-12 in./century. You can add or subtract a bit for your favorite eustatic value. Fine.
The point:
Any tide gauge shows that crazy predictions of 10 ft./century are just that, Crazy.
The projection of 10 ft. of rise by 2100 is 12.5 ft./century. This is their Armageddon scenario. That’s right, a funky Sci.-Fi. movie starring Bruce Willis. That’s right, any local tide gauge shows that all they are doing is writing bad Sci-Fi movie scripts.
Also, even uncorrected tide gauges often have wonderful long consistent records. These are proof positive against SLR acceleration. If theories of CAGW going back to even a modest 1980 start were correct, we would see acceleration by now. We do not. Another CAGW prediction bites the dust.
“Meaningless is not correct, at all.
As Steele points out, absolute SLR is generally given as 8.5 in/century. Sometimes people want to argue the fine points and values of ~6 to 12 in./century will be tossed around. I would not bother to dispute any number in that range, it’s all good.”
So, you admit to willingly accepting values of 6 -12 inches per century (1.5 – 3.0 mm/year). That’s an uncertainty range of ± 33% about the mean.
You may argue a “scientific” value having uncertainty of ± 33% is “all good”.
I, however, stand by my statement that such a value is meaningless in the context of establishing “climate change” over several centuries, which is the topic of the OP to which I responded.
To clarify:
I take my value of eustatic SLR as ~8.5 in./century. We see further down this very thread estimates if almost 12 in./century from the CU group (Sat data) and one person with 6 in./century. So the battle rages. I just do not feel the need to join in that battle.
Back to tide gauges:
The one most dramatic feature of the entire collection is that they are linear. As in Linear, even over 100 years or more. Many of them have data sets in excess of 1200 data points. The 95% confidence interval lines are incredibly tight. Almost no error left at all.
So what do we have?
All your tide gauges are showing linear, linear, linear.
Therefor:
It follows that eustatic SLR *must* be proceeding at a fixed linear rate. Period. Now you can pick any eustatic SLR you like but it must be constant. We have observed that SLR is constant for the last century *and* with no sign of change currently, so far.
Now you have a basis for establishing “climate change” over a few centuries as you desire.
My point is perhaps this:
Perhaps the data is not just what you might want. Still, there is much valuable information contained within the data we do have. Much can be learned. We should not discard a data set, or discount it out of hand, just because it is not exactly just what we would have wanted. We can do better.
The argument is NOT that we should “discard” the RSL data sets, certainly not the local sets. The argument is unless vertical land movements are accounted for, the RSL data set is absolutely worthless for attributing sea level changes to climate change.
However by comparing a relative sea level rise that is high vs an absolute rate of sea level rise that is low, the data sets suggests to land managers the real issue is dealing with subsidence or some other factor. The issue is: all this climate change misinformation about sea level is misguiding our efforts to protect coastal homes and businesses
“The argument is unless vertical land movements are accounted for, the RSL data set is absolutely worthless for attributing sea level changes to climate change.”
Great. That is the argument, and it is a bad argument.
RSL has been rising at a *constant* rate since long before any AGW or “climate change” could have started. Constant rate then, constant rate now, no change. No AGW, no climate change. The climate is now doing exactly what it has been doing sinse the tide gauges were installed. In spite of yammering about 1.5 deg or 2.0 deg temperature rise since 1880, it was understood by the IPCC that no AGW occurred before the end of WWII. There simply was not enough fossil fuel usage to support any such claim. And this time frame is right smack in the middle of the modern tide gauge record. Linear. No change.
Do the attribution. Climate Change SLR = 0.00 mm/yr. Done.
TonyL posted:
“RSL has been rising at a *constant* rate since long before any AGW or “climate change” could have started.”
(my underlining emphasis added)
Well, RSL has been falling along the coasts of Finland and Scotland (ref: https://slate.com/technology/2017/08/why-sea-level-is-falling-in-finland-and-sweden.html )
In Alaska and a few places in the Pacific Northwest RSL has been falling (ref: https://www.climate.gov/news-features/understanding-climate/climate-change-global-sea-level )
“Global sea level changes are also affected by changes in terrestrial reservoirs of liquid water. Withdrawal of groundwater and storage of fresh water through dam construction (Chao et al., 200829; Fiedler and Conrad, 201030) in the earlier parts of the 20th century dominated, leading to sea level fall . . .” (ref: https://www.ipcc.ch/srocc/chapter/chapter-4-sea-level-rise-and-implications-for-low-lying-islands-coasts-and-communities/ )
“For example, adjacent to an ice sheet losing mass, reduced gravitational attraction between the ice and nearby ocean causes RSL to fall, despite the rise in GMSL from the input of melt water to the ocean.” (ref: https://www.ipcc.ch/srocc/chapter/chapter-4-sea-level-rise-and-implications-for-low-lying-islands-coasts-and-communities/ )
“ ‘Sea level is one of the most important yardsticks for measuring how humans are changing the climate,’ said Josh Willis, an oceanographer at NASA’s Jet Propulsion Laboratory (JPL). He and colleague Carmen Boening have watched sea level creep upward at a slow but steady three millimeters per year. ‘We pay a lot of attention to this number,’ Willis said, ‘so it was kind of surprising in 2010 and 2011 when we saw a dip, a reversal.’ Sea level had suddenly dropped a half centimeter . . . sea level data from a series of remote-sensing missions . . . indicated that sea level steadily rose an average of three millimeters per year. The dramatic drop during 2010 had not only negated the average annual 3.2 millimeter rise, but dropped sea level an additional two millimeters . . . The strong La Niña had affected the oceans to an unusual extent, not by cooling the water so much as by moving the water on to land. Rainfall follows warm pools of water, and during El Niño, more rain tends to fall over the Pacific Ocean. But during La Niña, cooler oceans push that rainfall over continents.” (ref: https://earthdata.nasa.gov/learn/sensing-our-planet/when-oceans-drop )
So, the claim of RSL “rising at a *constant* rate” is certainly falsifiable over Earth’s surface and over timespans of several years or more.
And, as the last article quoted above demonstrates, there are natural processes that can cause RSL to fall that are outside of the “usual suspects” of thermal contraction of ocean water, ocean winds and currents, and land uplift.
Jim,
Excellent! You said it much better than I attempted to.
Is it reasonable to suggest that the likelihood of temperature and sea level changes are cyclic? If so the linear(ish) part of a rising wave immediately precedes a reduction in rate as the peak of the wave is approached.
If that is the case the only way for the rate of rise to go is down.
Yes. meaningless if you study thermal expansion of water, but with all the meaning in the world for coastal populations … if absolute level is not rising, there is no problem with sea level.
iggi,
Land subsidence in a costal community (such as in areas around Miami Beach, Florida) can cause flooding even if the nearby ocean’s absolute level is not rising . . . EVEN IF the nearby ocean’s absolute level is rising, but at slower rate than the land is subsiding.
As soon as these people sell all their sea-level properties and stop vacationing there, I will believe in global warming.
Really? Why? Whether they sell or not, Global Warming/Climate Change/The Climate Crisis/The existential Crisis of our Time or what ever they rebrand it next week, will still be bullshit.
I agree, they will never sell, and global warming is not something I will believe, ever.
(-:
Yeah, when Gore and Obama sell out and leave the coastal areas it just means they’ve drunk their own Kool Aid or else its virtue signaling. Whatever it is, there’ll be hypocrisy attached.
Sell? They should abandon their waterfront properties and run in fright when the tide gauge shows one millimeter rise
That’s the equation put crudely: oceanfront property owners in Martha’s Vineyard or Malibu want to retain their property values and peace of mind by preventing those in the Third World from aspiring to the standard of living they themselves enjoy even though their fears are unfounded.
I’ll believe my lying eyes. I live on the west coast and go to the ocean often. I’ve not noticed any visible change in its height or depth of the water in 40 years. So I’m sticking with the same belief, when the beautiful people start moving away from their new beach front properties, I might start to take a few measurements.until then, follow the money.
From the link:
Coastal Californians, prepare for the ocean
to rise 10 feet by century’s end. GRIST
_____________________________________________
10 feet x 12 inches per foot times 25.4 millimeters per inch divided by 79 years until 2100 comes to 38 millimeters per year. Or way more than ten times the current rate. When is this supposed to begin to happen?
Tomorrow, obviously…
No no no, the timeframe is always “in the next 10 years we’ll pass the tipping point, unless we spend gobs of money now on pet projects which happen to be the main business of these companies of friends who donate tons of money to my political campaigns.”
People who claim to be able to predict the future are charlatans. Always have been, always will be.
“If they could predict the future, they would be at the horsetrack” as my mom used to say.
Oh, the scenario is that Greenland and part of Antarctica will collapse into the sea, starting sometime right soon now, never mind there is no indication of either right now, but where is my check?
What has Greenland to to with SLR ?
(chart missing)
Missing chart
The concept of runaway climate effects is ever present in the urgency narrative.
COP26 was portrayed (yet again) as the last-chance saloon for mankind. But a clue that things ain’t quite so urgent can be found in the fact that they’ve set arrangements in place for COP27 and COP28. So clearly the ’emergency’ isn’t so urgent that there’s still time for at least two more jollies at taxpayers’ expense for the the 1000s of parasites who flocked to Glasgow. I gather that the Nigerian contingent, at least, were honest enough to admit that it was all a big jolly for them.
It is right up there with the probability of another dinosaur-killing asteroid hitting the Earth by 2100. However, the MSM-apologists for the climate alarmists ignore other low-probability but high-impact events.
Steve, they didn’t expect anyone to do any actual arithmetic on their fabrication….
“When is this supposed to happen?”
At the time Congress calls the vote to pass Biden’s $1.75+ trillion “Build Back Better” spending bill.
Soon thereafter, the science will be “re-adjusted” to be consistent with the NOAA satellite observational data documenting that absolute global sea level rise is 3.0 ± 0.4 mm/yr, as it has been since 1993 (ref: https://www.star.nesdis.noaa.gov/socd/lsa/SeaLevelRise/LSA_SLR_timeseries.php ).
So much for Joe Biden’s direct promise to the American public to “follow the science”.
Do you think he can remember his promises?
Does it matter if he remembers? He won’t keep them anyway.
Maybe when the San Andres fault let’s go?
Well before that – like Guam the build-up of loaded containers will have tipped California
It already started, only a fool cannot see it. Your data is wrong. /s
According to the (old) “Settled Science”, about 10 to 20 years ago.
(Back when the Arctic melted and kids didn’t know what “snow” is and trip to Florida would involve a submersible.)
Everytime you see fear of sea level rise it’s that sort of garbage and always on century timescales which is meaningless.
A handmade tale.
That said, natural perturbations, nothing but perturbations, and subsidence.
I would have appreciated a written summary. 13 minutes could have been reduced to 2 minutes with a more lasting effect on me. Maybe I’m a fossil fool in a video world, but …
A TRANSCRIPT was provided (-:
Excellent Dr. Steele,
I too use sea level rise data in my arguments. Sea level rise is the sum of polar ice melt, and thermosteric sea level rise.
Polar Ice melt? It’s really cold in Greenland and Antarctica so there’s not much melting going on there. Yes, there’s some surface melt in the summer sun, but as soon as the melt water is in the shade it freezes, just like the icicles that form on your house on sunny but cold days in the winter. Any ice loss or gain in the polar ice caps is a function of how much snow falls and how much ice calves into the sea as icebergs. Temperature hasn’t got much of anything to do with it.
No melting? Did you recently hear of “The Norttwest Passage”
Mr. Layman here,
The North Pole ice is like an ice cube floating in a glass of water. It floats because it if less dense than liquid water. When it melts the water in the glass does not rise. Melt all the floating ice in the world and there will be little to no difference in Sea Level. When the water was frozen and floating, it has already displaced it’s own volume before it melted.
PS The (A?) Northwest Passage was found long before the current one.
What was the “normal” sea level then?
PPS ” the McClure Arctic Expedition discovered the Northwest Passage in 1850.”
Who are you really?
Do you make gobs of money in your own home?
Is that the coming message?
Both Antarctica and Greenland also have high elevations (Greenland averages about 2000m, Antarctica, about 3000m). This is well above that of the snow lines in the temperate zone, nevermind that they are in the high latitudes. The climateers generally neglect to mention this.
Forgot to mention that thermosteric sea level rise is local. If the middle of the Pacific warms up, it’s not going to affect sea level in New York harbor.
Hmmm . . . and all along I thought that thermal expansion of any particular section of the world’s oceans would eventually cause geopotential-gravitational equilibrium across all of the world’s oceans.
Who knew?
“Eventually” perhaps. The oceans are quite large and they don’t homogenize quickly (they probably never really homogenize). There are temperature differences and salinity differences that change the density of ocean water, so where it’s less dense (e.g. the Baltic in spring melt) the equipotential surface is higher (further from the centre of the earth)
This may also be involved.
https://www.foresitegroup.net/elevationmeasurements/
Good report. Thanks.
Climate change (and scenic value) aside, how smart was it to build the “surfliner amtrak” train route on sand along California’s Pacific shore? Isn’t that kind of a recipe for trouble?
The original coastal routes are late 1800s (to early 1900s) engineering compromises. Ideally, you’d find a low gradient line on stable soil leading from one destination to the next. However, the Coast Ranges, crumpled up plate edges from the collision of the NA continental plate(s) with the Pacific ocean plate(s), make for short level runs and short steep grades, with lots of unstable ground, except for the wave cut benches and beaches along the coast itself.
So, do you build and use the railroad now, or spend time and treasure cutting through unstable cliffs hoping that in 20 years you will make money? Or build on the shifting sands and gravels, and maintain it as necessary while using (and profiting) from it now. In Southern California a railroad was run from Oceanside up a canyon the the “Inland Empire” valleys of Riverside and San Bernardino, only to be washed away in a huge rain event shortly after construction. The quickly run up replacement went along the coast, and has severe speed restrictions to this day, but it can (absent insane bureaucracy) be repaired in short order should it fail.
It almost sounds like a risk worth taking for Amtrak. I guess tracks can be re-routed if they get undercut. Unlike a house. Looks like a fun ride, actually.
Alarmists worry about climate. They ought to keep their sights trained on things they can fix. Coastal waterways, inland flood plains, unstable fault lines and fire-prone forest interfaces are all paved with “engineering compromises” – and compromised engineering. I guess if you’re born on an island and big waves threaten your family home, you may have some tough choices to make. But standing in the surf and moaning that the sky is falling doesn’t seem like a smart alternative to moving or taking some other authentic defensive action.
I frequently walk the coast along Pacifica CA just south of SF, and see the remnants of the the old Ocean Shore Railroad built into the sea cliffs and running between San Francisco and Santa Cruz (with a few gaps) and operating from 1905 until 1921 until it went bankrupt. Collapse of segments and avalanches blocking the tracks are clearly seen and reveal the engineers did not understand the fragility of the coastal bluffs, especially when shook by earthquakes.
I’m reading a book written by an American marine about his service fighting the Japanese on a number of Pacific Islands, particularly Okinawa.
He describes most of the island as being of coral origin. It’s a series of ridges. Obviously the coral formed when the sea was considerably higher. Any geologists out there who knows how old this coral is? And when was the sea that high? And how much higher?
Joseph, here a picture of an island in the Zanzibar chain. As can be seen the sea level used to be quite a bit higher. Roughly 130,000 years ago the sea level dropped over a meter.
There is much data that the ocean high stand in the Pacific was about 6000 years ago and then fell as the earth entered the Neoglacial. I’ve seen estimates of 2 to 6 meters higher than today
And if the climatistas were around then- they would have blamed it on humans and whined that that coral was dying.
“within a few years children won’t know what water is”!
Hmmm after viewing the You Tube, there’s no mention of the satellite sea level data? The folks at Colorado University’s Sea Lever Research Group (C-SLRG) pronounced “C Slurg” has steadily manipulated the satellite data. The earliest releases of their report available on the Internet Archives Way Back Machine are from 2004 LINK and DATA . Here’s a illustration of what that looks like compared to various releases up until 2016:
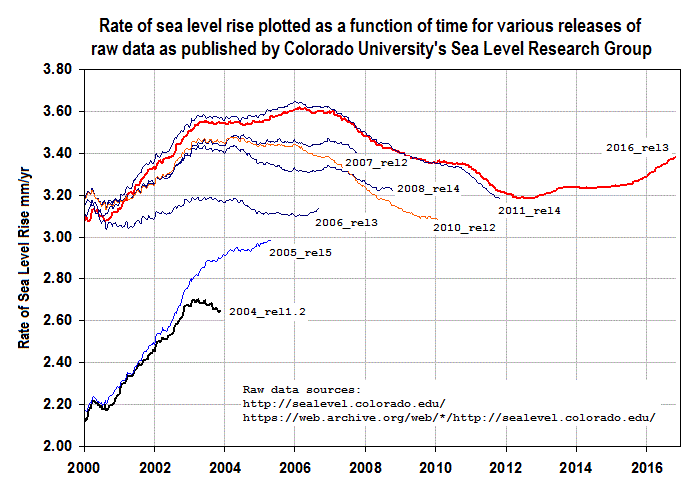
Each plotted point represent the rate of sea level rise since the beginning of the satellite measurements in December 1992. Note that release 1.2 from 2004 shows the rate at that time to be a little over 2.6 mm/year, and by release 3 from 2016 the 2004 rate is shown to be almost 3.6 mm/year.
Revising, correcting and in general re-writing historical data seems to be the hallmark of climate science. It’s a matter of opinion why climate science changes old data, but it is a matter of fact that they do. But more to the point, the changes always seem to favor the narrative.
Never mind the fact that the precision of the radar altimeters on even the latest generation JASON-3 satellites orbiting 800 miles above the earth is about 3 cm and can’t possibly measure sea level height to a precision of a fraction of a millimeter. And of course there’s the discrepancy between tide gauge trends and satellite-measured trends which the alarmists explain as an “acceleration” in sea level rise when it’s simply an artifact of the different measuring instruments.
What C-SLURG did was make the rate of sea level rise from 1992 to 1998 flat so that a 2nd order polynomial (acceleration) curve would then produce the sought after acceleration that they wanted. Here are their papers on that:
This one they’re hoping and praying to find acceleration:
Is the detection of accelerated sea level rise imminent?
And here’s the one where they do the Happy Dance
Climate-change–driven accelerated sea-level rise detected in the altimeter era
Could they be any more transparent?
I didnt want to go into the issue of satellite measurements yet, in part to keep the video from going longer and in part due to several issues regards which group is analyzing the data
However the SONEL.org site does provide satellite data and compares it to tide gauges. For instance , using thee AVISO satellite data for sea level rise from 1993 to 2015 they calculate just 0.64 +/- 0.49 mm/yr vs LaJolla tide gauge with 2.65 +/- 0.65
Google La Jolla GPS and the Sonel site should be at thee top of th list
Thanks,
I look forward to your future comments on Colorado University’s Sea Level Research Group.
But should not the satellite system, assuming it is as accurate as claimed, and correctly calibrated and reported, measure absolute sea level rise, not relative sea level rise as with tide gauges? What your paper shows is that the difference between what we are told the satellites say (~3 mm/yr and increasing) and what the corrected tide gauges say (a few tenths of a mm/yr and not increasing) is incomprehensibly large. Clearly the satellite numbers must be wrong.
The problem is the satellite data suffers from different processing models and worse different adjustments. Satellite data is calibrated against averages of tide gauge data.
The when satellite data resulted in an apparent global sea level rise acceleration from 1993 to 2002 of about 3.5+ mm/yr, the alarmists cheered stating finally the acceleration matched what their models predicted.
But then between 2003-2011, the data from the same processing reported a rapid deceleration to about 2.0+ mm/yr. (chart a)
So, as seen in the attached charts from Cazenave 2014, they estimated how much rainfall fell on the land due to La Ninas vs falling in the ocean due to El Ninos, plus added 0.3 or 0.5 adjustment for an expanding ocean basin and to get the adjusted satellite data to still show an acceleration to about 3.1+ (chart b) to support what they thought should be a climate effect.
Thanks Jim,
A post on your thoughts on the satellite data would be very useful…Willis did this some time ago but your thoughts would be of great interest too. We need all the data we can get to expose this fraud.
Thanks for the info Mr. Steele. But do you know by what process “Satellite data is calibrated against averages of tide gauge data?” It seems that could be done to establish a zero point for the start of the satellite database but after that, as we have seen, tide gauge data should have little to do with something that supposedly measures absolute sea level changes. In other words, how can one correctly determine the health and retail value of the apples in your orchard by measuring the fruit in your neighbors orange orchard? Their only commonality is that they are both trees. And what does rain have to do with it? It nearly all originates from the ocean in the first place. What a mess! I agree with Mr. Brickell. We all need more of your help on this matter.
Nobody ever drowned from being over their head in hypothetical or virtual water.
Jim, you are a true scientist and a true hero.
Many many thanks for your terrific and admirable analyses.
Good report by Dr. Steele. Never mind the relative sea level change, where local dewatering of coastal sediments causes relative sea level rise, or where rebound after ice age load depression produces relative sea level lowering, consider the many factors involved in absolute sea level change. The Greenland Tectonic plate is moving a little southerly and so is the Antarctica Tectonic plate (the plate is getting its geographic center closer to the geographic South Pole). So Greenland should, all else being equal/unchanged, lose ice and Antarctica, all else being equal/unchanged, should gain ice. The capacity of the ocean basins is constantly modified by by undersea volcanism working against river delivered sediment filling, as one other example. Dr. Steele shows an extremely small actual sea level rise, and as we have often mentioned the normal sea level change for the planet earth, at this time, is 50 meters higher and 150 meters lower sea level. Trying to accurately predict this very small actual sea level change against the very large natural variation is impossible.
The “global” (average) sea-level trend is so slow that in many places it’s dwarfed by local factors, like vertical land motion, sedimentation & erosion.
Greta Thunberg’s hometown of Stockholm is one such place. Here’s an “interactive” graph. To see precise values, hover your mouse cursor over the graph traces (or touch the graph on a touch-screen):
https://sealevel.info/MSL_graph.php?id=Stockholm&boxcar=1&boxwidth=3
Here’s a “static” version of the same graph:
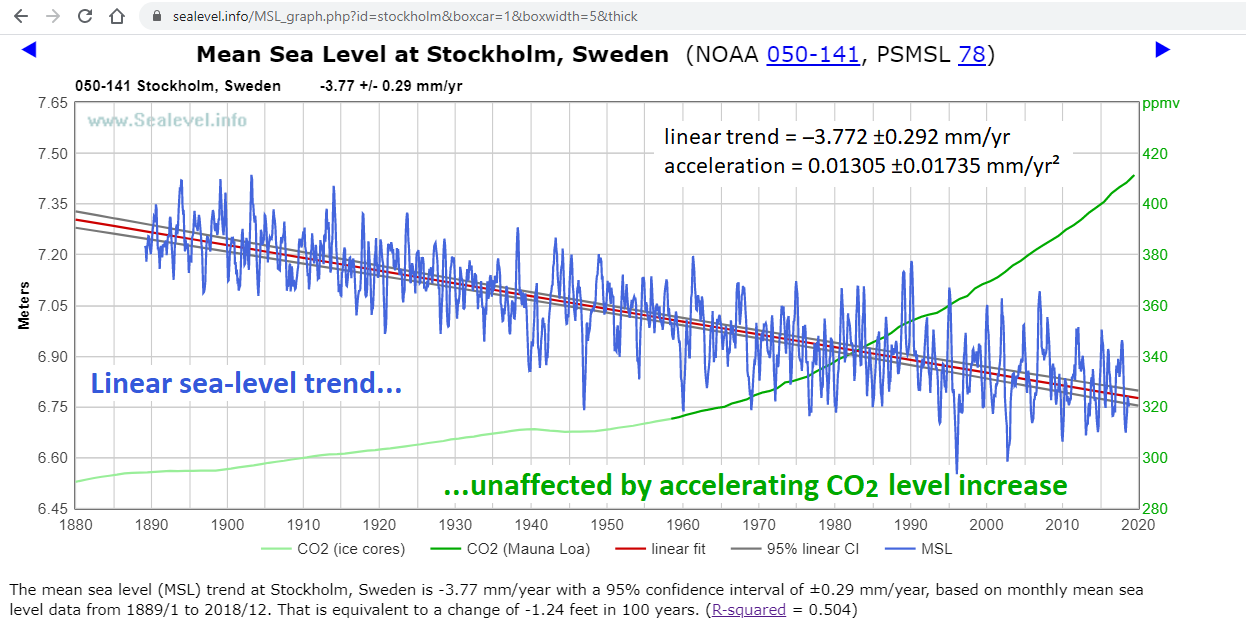
If sea-level rise accelerated significantly, it would help with Stockholm’s dredging expense. Unfortunately for the Swedes, there’s been no significant reduction in the rate of sea-level decline there.
At La Jolla, California, the measurement record is a bit shorter, but we have continuous sea-level measurements from Nov. 1924 thru Sept. 2021. The linear trend is +2.041 ±0.229 mm/yr (95% CI), and the acceleration (determined by quadratic regression) is 0.000349 ±0.018310 mm/yr². Here’s the graph:
https://sealevel.info/MSL_graph.php?id=La+Jolla&g_date=1920/1-2024/12&c_date=1920/1-2024/12&s_date=1920/1-2024/12
Here’s a “static” version of the same graph:
2.041 mm/year for 100 years would raise the local (“relative”) sea-level by 100 × 2.041 = 204.1 mm = just 8.0 inches per century.
What’s more, as Jim points out in the video, part of that rise is due to local land subsidence. The global average sea-level trend is only about 6 inches per century.
(However, I do not share Jim’s confidence in the GPS measurements of vertical land motion [VLM]. They are very rough, and their VLM measurement records are very short, so using them to correct much longer sea-level measurement records at tide gauges requires the assumption that the VLM trend is unchanging, which is unprovable, and probably incorrect.)
As you can see, there’s no sign of a recent acceleration in the rate of sea-level rise at La Jolla, and no sign of a significant effect from rising CO2 levels. Acceleration of 0.000349 ±0.018310 mm/yr² is a fancy way of saying “zero acceleration” or “it’s linear.” 0.000349 mm/yr² acceleration, continued for 100 years, would add 100² × 0.000349 / 2 = just 1.745 mm (= 1/15 inch) to sea-level.
Some other sites have seen a very slight acceleration in the rate of sea-level rise, but mostly more than ninety years ago, and not enough to be of practical significance.
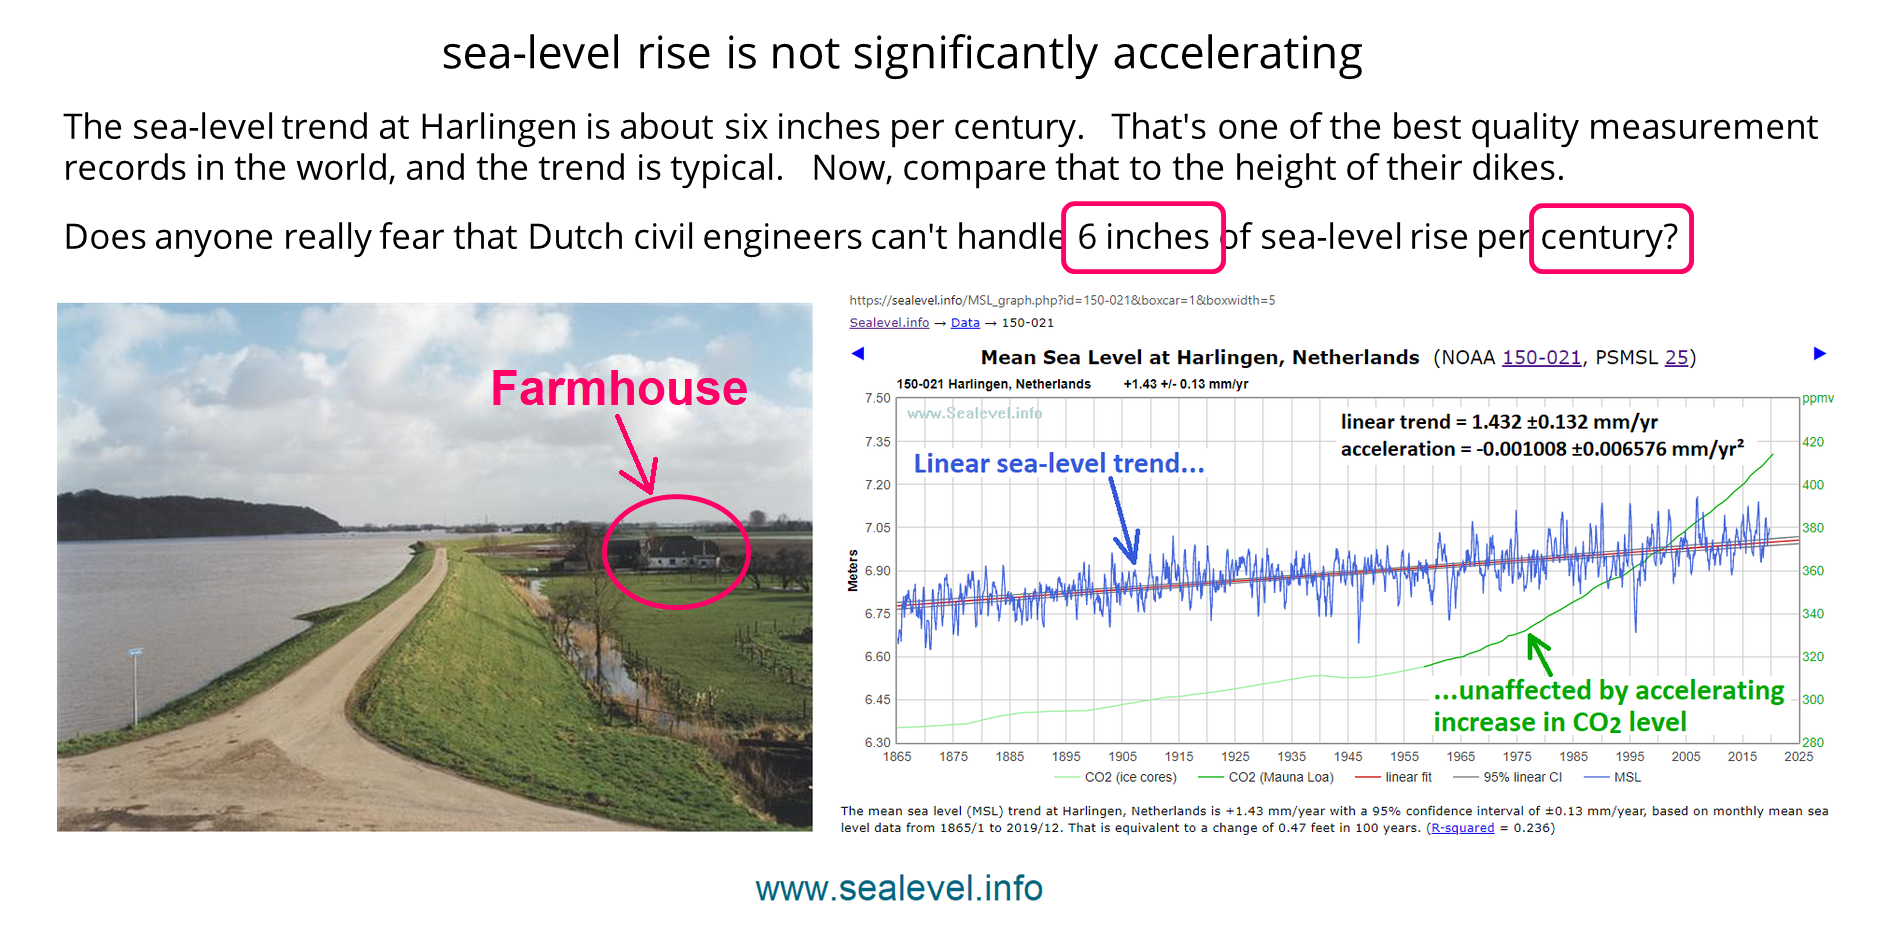
The Dutch have been carefully measuring sea-level for a very long time, for obvious reasons. Their tide gage at Harlingen has one of the best long measurement records in the world. Here’s the graph:
https://sealevel.info/MSL_graph.php?id=150-021&boxcar=1&boxwidth=5
The attribution of sea-level rise to manmade “climate change” is unsupported by good evidence, and predictions of wildly accelerated sea-level rise are utter crackpottery. Putting the people who make such predictions in charge of writing UN reports and setting public policy on climate and energy is as ridiculous as it would be to put flat-earther Mark Sargent in charge of the space program, or to put Joseph Mercola, Andrew Wakefield, Jon Rappoport, RFK Jr, and Mike “Health Ranger” Adams in charge of vaccinations.
Hey Dave, I agree the GPS data has much uncertainty due to different methods of analysis. Nonetheless, it does provide ballpark numbers from which we can compare relative sea level to absolute. As seen in the Boretti (2020), each station experienced different vertical land movements and tide gauge measurements, so that each station suggests a different Absolute Sea level rise. But despite any uncertainty, discussions of sea level rise must push absolute sea level front and center. The difference between relative and absolute provides agencies with the best clues for the best management strategies. If absolute is negligible but relative rise is high, then protection against subsidence or sediment build up is the best answer versus controlling carbon emissions that would be worthless.
This is a bit off-topic, but I thought I would pass it on here because it sounds like pretty big news. The Guardian is reporting that the Biden Administration is auctioning off leases for large tracks of the Gulf of Mexico for oil and gas exploration…..
US auctions off oil and gas drilling leases in Gulf of Mexico after climate talks (msn.com)
“The US federal government is on Wednesday launching an auction of more than 80m acres of the gulf for fossil fuel extraction, a record sell-off that will lock in years, and potentially decades, of planet-heating emissions.
The enormous size of the lease sale – covering an area that is twice as large as Florida – is a blunt repudiation of Biden’s previous promise to shut down new drilling on public lands and waters. It has stunned environmentalists who argue the auction punctures the US’s shaky credibility on the climate crisis and will make it harder to avert catastrophic impacts from soaring global heating.”
I have to admit that this news seems to indicate that there are actually some sane and rational thinking people in the Biden Admin after all. If this report is true, I am surprised to see it happening so soon after COP(OUT) 26. Now COP(OUT) 26 looks like an even bigger farce than before..
If Greta and Bill McKibben get wind of this, some serious temper tantrums are going to be thrown.
Democrats are getting very nervous about next year’s elections. The city of Columbia NC went for Biden by 40 points last year. An R just won the mayor’s seat in Columbia with a comfortable margin. There are a number of similar examples popping up around the nation.
https://wattsupwiththat.com/2021/11/17/cop-26-encore-u-s-to-hold-huge-crude-oil-sale-in-the-gulf-of-mexico-lets-go-brandon/
Mr. Steele, in your talk you state that absolute sea level rise of approximately 0.15mm/yr is a consequence of “climate change” and by that I assume you mean a rise owing to rising temperature of seawater or due to melting of land-born ice. What is the basis of this conclusion? Could not the observed absolute rise be a consequence of plate tectonics leading to changes (a decrease in this case) of the ocean basin volume? Has this matter been investigated by competent authority?
The usual assumption is that, as a result of meltwater adding weight to ocean basins as the great northern ice sheets retreated 8-10K years ago, the ocean basins are sinking and broadening (GIA). It is not measurable, but I’m aware of two model-derived estimates of the effect.
The most commonly used estimate is that GIA (sinking and broadening of the ocean basins) reduces the global sea-level trend by 0.3 mm/year. That figure is from Toronto Prof. Richard Peltier. To the best of my knowledge Prof. Peltier and his colleagues have not published an uncertainty estimate for that figure.
To my annoyance, many organizations inflate reported global (average) sea-level rise by adding that 0.3 mm/yr isostatic adjustment as a fudge factor to whatever they calculate or measure. Aviso is one of them. They add 0.3 mm/yr to all their reported satellite-measured sea-level trends. (It used to be optional, but they removed that option.)
Of course, that sum isn’t really a rate of sea-level rise (SLR). It’s what they think the rate of sea-level rise WOULD be if the ocean floor weren’t sinking. Calling it SLR is misleading.
The other estimate that I know of is from Tamisiea, 2011. He gives a broad range: 0.15 to 0.5 mm/year.
There might be other estimates, from other sources, but I’m not aware of them.
I do not have an opinion about the accuracy of those estimates.
Note that local vertical land motion (VLM) also affects local sea-level trends, and that, too, is called “GIA.”
When doing my AR5 WG1 “expert review,” in comments about several different parts of the Report I complained about the addition of Peltier’s 0.3 mm/yr GIA adjustment to arrive at their inflated 1.7 mm/yr rate of 20th century sea-level rise. In every case they rejected my complaints. But the excuses varied.
Sometimes they claimed that they did not include the 0.3 mm/yr adjustment (“the 1.7 mm/year rate does not have a 0.3 mm/year correction applied,” they wrote).
Other times they claimed that it was proper to include the 0.3 mm/yr adjustment (it was “done to extract the 1.7 mm/yr SLR supposed to reflect climate processes only,” they said).
I suppose that inconsistency happened because they had multiple people writing the responses, but it is telling that those people didn’t agree except about the result: “Rejected.”
Of course, since I didn’t get to see any of their responses until after the final report had been released, there was no way to point out their confusion to them. IMO, for the IPCC to call their process “expert review,” a phrase which sounds very much like “peer review,” is deliberately deceptive. It is nothing at all like peer review.
Imagine an academic journal which ran its peer-review process the way that the IPCC runs their “expert review” process: the reviewers write comments, the authors ignore them, the journal publishes the paper, and eventually the authors write excuses for ignoring the reviewers’ comments, which they do not even show to the reviewers until after the paper has been published. Would YOU trust such a journal?
It seems then Mr. Burton that all of the GPS corrected sea level changes that Mr. Steele talked about are accounted for the by the best available estimates concerning the size and shape of the “tub.” No new water nor any ocean temperature change needed. None.
That is like bragging about what one’s savings WOULD be if interest rates were higher. It is a fiction that has no meaning with respect to the practical issues of how much money one has or whether there is risk of flooding or beach erosion.
The proper way to discuss the dynamics is to make a ‘ledger’ sheet of the gains and losses that contribute to the RSL, and not add in virtual water to make the situation look more scary than reality.
For boats and shoreline structures, the RSL is relevant; for the impact of warming, the ASL is relevant.
I agree that my statement was too general and a tad misleading. I was trying to say you cant even begin to attribute a change in sea level unless you are using a reliable measure of absolute sea level rise. Plate tectonic movement at the local level would be accounted for by local GPS and thus accounted for in the absolute sea level rise, but is possible for a more global effect.
For example, after the melting of the Ice Age glaciers, the weight of the water should have depressed the ocean basins which would allow greater ocean volume without detecting a sea level change. Based on that assumption that basins are still sinking, those pushing a climate attribution add on 0.5 mm per year to the global average.
I also believe that ground water flowing into thee oceans make a significant contribution to sea level, and that is just being considered, but it is not easily measured. I blogged about that impact about 3 years ago
https://perhapsallnatural.blogspot.com/2018/03/will-advances-in-groundwater-science.html
Bingo – Most tide gauges show sea level rise since the middle of the 19th century maybe earlier, and continues right up to this day. Just about everything that Climate Science tells us is due to CO2 induced climate change has happened before, or (like sea level rise) has been happening right along. A lot of what Climate Science says is happening isn’t happening.
I wonder if the BBC’s Specialist Disinformation Reporter will report this.
Incidentally, is the SDR employed by the BBC’s equivalent of the Ministry of Truth?
https://www.bbc.co.uk/news/science-environment-59308958
Nice video, Jim.
I have written about the topic here several times before. The best summary post is “SLR, Acceleration, and Closure”. The closure part proves sat alt is ‘wrong’ and diff GPS corrected tide gauges ‘right’. The reasons sat alt must be wrong were for Jason 3 given in its ‘fit for purpose’ post. And that the new bird Sentinel 6 does not fix the intrinsic problems were discussed in my two recent posts on Sentinel 6.
Sea level is rising because the oceans are getting less sunlight. That slows down the water cycle with the consequent that the oceans retain more heat.
It is impossible to get heat into the deep oceans at low latitudes because the water column is constantly upwelling due to surface evaporation. The cool water from high latitudes feeds the evaporation at low latitudes.
Oceans take heat in the tropics through evaporation. That water gets chilled as it circulate to higher latitudes; cold water drops out and gets fed back to the low latitudes in the lower sanity channel between 500m and 1500m depth.
RickWill, you lost me at “the oceans are getting less sunlight.” (Evidence?)
And again at the claim that the water cycle has slowed. (Evidence?)
And again at the claim that getting less sunlight would make the oceans warmer.
More cloud cover at night could help warm the surface (whether land or ocean), but less sunlight would not make the surface warmer.
It is all set out here with references to the data sources:
global-water-cycle
Dreaming of the Maldives, then you will enjoy this blog where in the opening sentences the writer describes the growth of Maldivian airports.
https://www.dreamingofmaldives.com/maldives-blog/list-of-all-maldives-airports-and-their-respective-atolls/
There were 5 airports in 2010. Today they number 18 of which 5 are international airports.
That is a lot of on island fossil fuel storage, not to mention the ships which bring it, and the diesel to run the electrical grid, plus all that jet fuel burned to get there.
What will Maldives do with their handout from rich countries? Build another airport?
You simply misunderstand.
The airports are “aerial evacuation centers”.
All those hotels are emergency gathering centers before paddling to the aerial evacuation centers.
Base on holistic thinking, fear, and positive visualization they have increased the area of the islands over the last couple decades.
Tony robbins would be so proud
Australia is known to be a pretty stable land mass so sea level changes, and if used as a proxy for thermal expansion via temperature changes, does not seem too dire as seen here.
https://kenskingdom.wordpress.com/2021/08/23/the-worlds-biggest-thermometer/
There is an exception on the south to central West Australia Coast. It was used to create an Eemian WAIS tipping point via blatant academic misconduct by O’Leary. Exposed and illustrated in essay ‘By Land or by Sea’ in ebook Blowing Smoke.
This guy is a huckster for the fossil fuel lobby
AND YOU ERNEST YOU ARE A LYING DISGUSTING TROLL TRYING TO DENIGRATE SCIENCE.
Do you have any evidence to support such a claim, or do you just believe that anyone who presents evidence that refutes your belief system must be someone evil?
Another retard
SLR is their new bogeyman because they can cheat, get away with it, and still instill fear. Temperature? Removed from their lexicon because it’s obvious even to the layman that prediction both failed in number and severity of consequences. I predict next they’ll move onto racism being caused by AGW. It’s already starting.
Climate change theory was planned all along to instill fear into the population so that “necessary” measures would be enacted that would curtail liberties and bring the population under surveillance. This is what the Great Reset is about. After Covid, catastrophic warming will be used to scare us into a state of intolerance, and hence, to ensure the curtailing of the rights of a significant faction of the population. Liberty and tolerance go hand-in-hand. All of this will be necessary to “stay safe.”
level rise from the sharp end
https://youtu.be/EPNhTVicEe4
I actually hope the oceans rise about 22′; I’ll have ocean front property then.😇😇