By P Gosselin on 14. November 2021
Data from the Danish Polar Portal shows Greenland ice melt slowing significantly over past 10 years. Increasingly rapid mass loss is a myth.
German climate site Die kalte Sonne here looks at whether Greenland is really melting faster or not in its 78th climate and energy video (3rd segment).
Satellite measurement has allowed accurate measurements over the years and so reliable trends are detectable.
Greenland has added mass since July
Over the past year, since September 2020, Greenland has seen a number of heavy snowfalls, as depicted by the solid blue line in the chart by the Danish polarportal.dk:

Image cropped: Die kalte Sonne.
When looking at the net gain or loss in billions of tonnes, we see a net gain since July (blue curve):

Image cropped: Die kalte Sonne.
The last months stand in stark contrast compared to the large net loss seen in 2012, depicted by the red curve.
Despite the recent 30 billion tonnes of net gain beginning in July, that didn’t stop media outlets like Der Spiegel from announcing doomsday warnings of runaway ice melt.
Greenland mass loss rate has declined significantly
Another important aspect of Greenland ice mass change are the data measurements of the ice edge and calving rates, in addition to the surface mass variations. Each year the Danish Polar Portal reports the sum both of these factors. “This determines whether Greenland ice is growing or shrinking,” says Die kalte Sonne.
The following chart plots the total mass balance changes since 1985:

Image cropped: Die kalte Sonne.
Greenland ice mass change bottomed out in 2012, and has been seeing less and less loss for 15 years. Each year mass loss has been declining.
Currently Greenland mass balance change is at levels seen in 2000. The days of rapid mass loss are behind us, at least for now. The year 2021 is expected to come in at -100 gigatonnes. In 2017 and 2018 mass was actually added.
False media narrative
When it comes to Greenland ice mass, Die kalte Sonne summarizes: “The usual media narrative of an alleged increasingly rapid ice melt in Greenland is thus not correct.”
What a pity the records are so short. It could be related to the AMO.
Or it might not
Not sure we have enough data to say anything meaningful yet.
Yeah, we are living through a time of signs and portents, all pointing in the opposite direction to the Green blob.
“The usual media narrative of an alleged increasingly rapid ice melt in Greenland is thus not correct”
Well, imagine my surprise!
The average global sea level rise rate is 1.7-1.8 mm/yr. Source NOAA.
You know what? The water has to be coming from somewhere.
Its been rising for 8000 years – since the end of the last glaciation and its highly local. In Sweden sea level is dropping at 2 mm per year.
If you follow the NOAA link, it says:
Areas experiencing little-to-no change in relative sea level are illustrated in green, including stations consistent with average global sea level rise rate of 1.7-1.8 mm/yr. These are stations not experiencing significant vertical land motion.
OMG. 1.8 mm/year! That’s 180 mm/century (7 inches) – run for your lives.
OMG. 1.8 mm/year! That’s 180 mm/century (7 inches) – run for your lives.
_________________
An analysis of PSMSL data says about 6.5″ by 2100 and that includes an acceleration of 0.01mm/yr² but let’s not quibble.
That assumes sea level rise will continue linearly. You don’t know that and neither does anyone else.
Yes, where is our favorite Arctic protector troll to explain this all to us.
Reading comp.
“….and that includes an acceleration of 0.01mm/yr²”.
But the vaguity of “an analysis of PSMSL data” is fair game.
Sea level rise is not associated with human activity. Except in the minds of some delusional people who see human fingerprints in everything.
We shouldn’t be worrying about something we have no control over.
“that includes an acceleration of 0.01mm/yr² ”
What makes you think sea level rise increases are non linear?
True sea level rise is not local, it is world wide and uniform over time. Relative sea level rise is affected by the changes in elevation of the land. “Local” sea level rise does not require more water. PSMSL.org is the best site for seeing this because they show world wide sea level gauge results and GPS elevation data for the gauges where available.
explain this further “True sea level rise is not local, it is ww and uniform over time’ There is no such thing. There is ONLY Relative sea level period. IF none of the landmasses moved up or down it would take additional water to raise the level, or expansion of the water by heat. So given the known factors there is not more water being added to the oceans and the heat is so stable its laughable that anyone thinks it impacts sea levels beyond a mm or two. For example, the East coast of North America is subsiding and eroding https://news.harvard.edu/gazette/story/2019/02/study-of-sea-level-rise-finds-land-sinking-along-east-coast/ So this sinking only allows more water to cover the sinking land, which takes away from the available water that will impact sea level anywhere else, a net negative to all other locations. Now repeat this all around the globe and you get a net Relative Sea Level. Most studies and observers get the results very wrong. As the estuaries and coastal plains along the NA Coast are vast and shallow. The extra 1,3,5 at the Sea Surface is then distributed over the available land mass equal to or below the current Relative Sea Level. As such, if you added 3 mm to the top layer of the ocean at high tide, it would not result in 3mm rise at the shore due to the distribution of the volume over the area. You might get 1mm rise. The entire topic of sea level rise is so full of conjecture and ignorance of basic geology it is sad. What also is not accounted for are the vast and enormuous undersurface aquifers that replenish when the sea water filters down through the soil. Mass can neither be created or destroyed, there is no way around that.
Saltwater incursions are not aquifer replenishment!
Dissolved salts do not filter out.
It is my understanding that currents and wind have an effect, albeit relatively small, on local sea level readings.
Don’t get me wrong as I’m the first to say that the “climate crisis” is a scam but melting of grounded ice will raise the sea level.
Besides tectonics, some aspects of sea level rise are local. Thermal expansion is an example. Just because the middle of the Pacific Ocean warms up during an El Niño doesn’t mean the water in New York harbor is affected.
SC,
Why is New York not affected?
Surely contained water finds its own level?
Surely a rise in the central Pacific spreads out to re- level, even at New York?
Oh, wait. That rise in the Central Pacific was not caused by more water. It was caused by water expanded by heat, which does not change its weight and so does not provide a spreading force all the way to NY.
One missing ingredient from the warmistas’ text book is this: By how many mm (or inches) does sea level change for a 1 degree C change in global surface air temperature? Good luck finding an answer. No Greene knows, it seems, but they all say it happens and that it is dangerous.. Geoff S
Steve, you have no experience with water, do you.
Are you of the opinion that expanding water in the middle of the Pacific is just going to form a column of water out there in the Pacific???
Most of the current SLR is attributable to thermal expansion of water in the oceans, as ocean temperature rises by a tiny fraction of a degree.
Smart Rock,
Where are the numbers. One degree C change in global
surface air temperature = how many mm change in ocean levels? References? Geoff S
Assuming that’s correct (and there are doubts) there are loads of possibilities. Movement of tectonic plates affecting the sea bed is one; another is the rebound of the northern Eurasian after the end of the last ice age. The Baltic Sea is about 1.5 metres shallower than it was during the Crimean War, for instance. Given the surface area of the Baltic it the rise of the sea bed has been uniform across it all that alone would account for NOAA’s observation.
That assumes the volume of the ocean basin never changes. Perhaps the level rise includes additions of sediment and underwater volcanoes decreasing the volume. Perhaps the shape of the earth is still rebounding from the last ice age. I don’t know but the intuitive case that higher levels = more water isn’t necessarily a slam dunk.
You have a point to a certain degree(rebound;which according to my opinion should be over after so many years,otherwise it would manifest in some serious earthquake as the rebound would not be homogeneous at all and would also create new islands all the time.
+ we have to consider that each kind of rebound is constantly losing dynamics and deccelerates )
The volcano and sediments stuff – Well,we have almost 400mio squarekilometers of water on this planet.
Therefore either the output of volcanos must be very massive(including effects like massive pollution and many dead fish) and the loss of earth that ends up as sediment should be massive too.
Therefore imo opinion thermal expansion may be the only real option- and thermal expansion should only go along with melting ice as when oceans get warmer the earth should be getting warmer too = more snow and ice melt.
Averaged over the land area, there is the equivalent of a couple of hundred meters of what we would term “groundwater” alone. A couple of millimeters a year is irrelevant….continental drift forces could change ocean levels by several meters over some epoch of geological time but we haven’t been around to record it nor smart enough to analyze it.
https://www.latimes.com/science/sciencenow/la-sci-sn-modern-groundwater-20151116-story.html
Don’t forget hydrothermal vents. Although their total number is unknown, I am not suggesting they play any significant roll in SLR, but only to point out there is still much we do not understand about the geosphere.
Most of the sea level rise (SLR) is from thermal expansion, not from melting polar land ice loss from Greenland and Antarctica.
When both the PDO & AMO are in their 30-year cool cycles, SLR rise will taper off and may actually start falling if both the Antarctic and Greenland ice sheets start gaining land ice mass.
Regardless, CAGW’s crazy dire predictions of 10~20 feet of SLR by 2100 is already laughable and certainly not supported by 40 years of satellite data.
Samurai san
I know that is the accepted idea, however if true it also means that the warming oceans must be outgassing carbon dioxide to the atmosphere.
Quite, That could be one of the reasons the CO2 continues to quietly rise in the atmosphere. If the cyclical predictions of the coming cold climate cycle are correct, we could see a slowing of that steady increase, despite our best efforts to keep it rising to ever more helpful ecological levels.
Precisely
If, in fact, the oceans are warming, it would follow that there would be some outgassing of CO2. Given that the thermal inertia of the oceans is approx. 1000 times that of the atmosphere we would expect a significant lag time for the warming of the oceans to any considerable depth. 800 years? Certainly could be. If that’s the case we may actually be seeing outgassing as a result primarily of the Medieval Warm Period, coincidentally happening at the same time that humans are putting extra beneficial CO2 into the atmosphere.
Samurai,
Discuss:
If a patch of water in mid ocean warms and expands, it will not affect coastal tide gauges because no water has been added, hence no force is created to shift the effect to the coastal tide gauges. Geoff S
There has been a force. Expanding water displaces nearby water, which in turn displaces nearby water, all the way to the various coast lines.
MarkW
That makes sense to me…surely if say, the entire Pacif Ocean really heated up (think the dreaded ‘global heating’ on steroids) and expanded to twice it’s volume that must surely have an effect on the sea level seen at NY and everywhere else?
Not if the temperature is rising and the water is expanding. Nothing is ever straightforward.
Yet there has been no ice loss in greenland or Antarctica in the last 10 years, so they can’t be the cause. so how is sea level still rising?
Displacement from that swirling mass of plastic the size of Belgium?….sarc
Steve Case, you demonstrate that you completly lack knowledge in most issues. Glacio-Eustatism is just one of the factors in sea-level variation.
The most likely “short term”, geologically speaking, major cause of global sea-level rise is just the thermal expansion of the world’s oceans as they continue heating up (i.e., volumetrically expanding) from the last 100,000 year glacial period on Earth, which ended only about 12,500 years ago.
Then too, you might want to consider that if the ocean basins are becoming shallower overall, or of less areal extent overall, (say, due to land subsidence and/or plate tectonic movement) then a fixed volume of ocean would necessarily have to rise relative to land.
You can see that SLR does NOT necessarily have to be associated with addition of water (say, from the melting of ice on land).
In fact, the graph below gives strong indication that the melting of ice on land (e.g., glaciers) reached an asymptotic limit around 6,000 years ago on its ability to contribute much meltwater to the worlds oceans:
Not really. If you have a basin and the water level at the edge of the x, and you then begin to push up the bottom in the middle of the basin, the water level at the edge becomes greater than x. I am not saying that this is the case, but you do not need more water to have higher sea level at the edge of the oceans.
Uplift anyplace, actually including the edge results in an increase in the water level. Life is not so simple, even if folks looking at stuff are.
My my my, 10 dislikes (so far). What don’t they like?
The link that says 1.7-1.8 mm/yr?
The notion that the water has to be coming from somewhere?
If you believe tectonics are responsible, then you must think that the planet is growing.
Pumping out ground water? Well sea level has been rising at a nearly steady rate for the last 175 years. We weren’t pumping out ground water then.
There are all sorts of examples of glaciers retreating around the world. I’ve known that since I was kid.
Most of the tide gauges around the world say that sea level is slowly rising. You can Google “The Permanent Service for Mean Sea Level” download the data and analyze the data for yourself.
175 years of consistent rise. And where is the disaster?
You left out thermal expansion, seabed changes, earth oblateness and spin speed changes. They tried to tie some of the oblateness and speed changes to Climate Change but most of the changes don’t line up and it’s still listed as a science mystery although there are hints it is tectonic in nature.
”seabed changes, earth oblateness and spin speed changes.”
Yep I was going to say the same thing. It would not take much of any of these to make a difference. So no, the water need not necessarily have to ”come from somewhere”
Lets see, actual people who are actually in Greenland show that the ice and snow are NOT melting away rapidly so you start screeching about sea level. Then you wonder why you are treated like a slow witted, pedantic child and laughed at. As has been pointed out to you several times sea level has been rising for thousands of years, it is not suddenly and catastrophically rising. It, just as climate, is doing exactly what it has been for millennia. These facts undermine your politically driven religious hysteria and that makes you sad. Don’t despair! There are always idiots who will believe your doomcrying.
Well, there are high density rocks and there are lower density rocks . . . and high density rocks can be transformed naturally to lower density rocks over geologic time.
And there are low density rocks that are created out of aqueous solutions of minerals in water.
We weren’t pumping out CO2 back then, either. So what is the rise attributed to?
“The notion that the water has to be coming from somewhere?”
Thermal expansion accounts for most of the rise. This is basic stuff. Dunning Kruger comes to mind here.
What about thermal expansion? link
Given the error bars, the whole sea level rise could be due to a warmer ocean.
WOW that much … so if I live in my beachfront home for 100 years it might make it half way up the first step.
You really are a one trick pony. Too bad that trick does not include actually thinking beyond what environtards keep screeching.
** Drax station burns wood – each single MWh of electricity it makes releases 1 Tonne of CO2.
Cellulose/lignin are carbohydrates, each atom of Carbon comes with one molecule of water
BoE calculation says that, assuming a carbon atom weighs the same as a water molecule, each MWh from Drax releases 0.4 Tonnes of water
Same would apply to the loss of Soil Organics – reckoned to be 10 Tonnes of CO2 per acre per year at places where anybody has bothered to measure it
Mmmmm, maybe A Lot Of People have measured it.
Why’s it gone quiet in here?
Re: ‘ordinary’ emissions – I get that 40GT of CO2 emissions also come with 16GigaTonnes of water
## Generally reckoned that The Amazon Forest is ‘fertilised’ by about 40 MegaTonnes, annually, of dust that came off The Sahara.
It’s a pretty major trip across both the Atlantic AND the Equator – how much stuff, launched off the desert, actually made it to South America?
Anybody?
De we guess 1%, 0.1% or less
Thats a sh1t load of stuff falling into the water and just that one example
Scary innit – maybe The Planet/Globe/Whatever is cooling…..
You know what? The water has to be coming from somewhere.
Someone’s taking the piss.
Seriously though, SLR is a model output, an epiphenomenon of a hundred assumptions. It shouldn’t in any way be confused with real data. Such as that above showing well established Greenland ice recovery.
Danger Will Robinson! Run for your life! The ocean is rising 1.7-1.8 mm/yr!!!!!!!
The point is, Case, that Greenland is still losing mass, but at a rate that is neither accelerating or alarming. Case closed.
Steve Case
Have you considered that burning fossil fuels produces more water molecules than CO2 and that water has to go somewhere eventually.
For example Octane.
2C8H18 + 25O2 → 16CO2 + 18H2O
It might have added a micron or two to sea levels.
I was recently on Kangaroo Island off South Australia and read the following on a tourist information board:
“17000 years ago. The sea retreats to the edge of the continental shelf during the last ice age. Humans cross to the island. About 7000 years ago, the sea rises to its present position”
How many SUVs would the Aboriginals/First Nations people have used to cross to the island?
Seas rise and fall regardless of what we puny humans do – get used to it
Greenland is covered by 2.8 MILLION Gt of ice and snow.
+/- fluctuations of 100’s of Gt defies accurate measurement.
Popular, though, with all those millennials and their entitlement/participation PhDs.
And the science illiterate scumbag fake news MSM.
+42^42
Most if not all MSM journalists are innumerate, and have no idea of scales or magnitudes.
Most are journalist because they could not do STEM. For most of them, I will to bet the never had and advance chemistry, physic or math course.
The Greenland Mass Balance is almost always positive. Even in 2012 there was mass gain. Any time that chart ends above where it began there is mass gain.
But even then – at the worst melt day rate it would take thousands of years to melt. People are talking about the difference of a sheet of paper on the Empire State building.
The chart displayed shows annual mass balance. Negative values show a net negative change in total mass for that year. Mass change was positive in 2017 and 2018. The general trend of minor mass loss in recent years appears to decelerating since mass loss peaked in 2012. The data suggests the atmospheric/oceanic conditions that regulate mass balance today are similar to the early 2000s.
To clarify I am referring to this chart “Total Mass Balance”
As the AMO approaches it’s 30-year cool cycle, the Greenland Land Ice Mass trend will continue to gradually increase for the next 30+ years.
Moreover, Arctic Ice Extents will continue to gradually increase over the next 30+ years as they have since its historic low in 2014..
Leftists will have a very hard time explaining how CAGW is causing Greenland’s Land Ice Mass and Arctic Ice Extents to continue to increase, but I’m sure they’ll come up with some lame excuse, and the MSM will be more than happy to espouse the latest propaganda to keep the dream of climate catastrophe alive and well….
Just like the same recent excuse Nick Stokes tried to give when he claimed the Antarctic registering record cold temps was actually due to global warming…
” …. claimed the Antarctic registering record cold temps was actually due to global warming…”
“The Peculiar Negative Greenhouse Effect Over Antarctica”https://ui.adsabs.harvard.edu/abs/2017AGUFM.C21D1139S/abstract
“Greenhouse gases warm the climate system by reducing the energy loss to space through the greenhouse effect. Thus, a common way to measure the strength of the greenhouse effect is by taking the difference between the surface longwave (LW) emission and the outgoing LW radiation. Based on this definition, a paradoxical negative greenhouse effect is found over the Antarctic Plateau, which suprisingly indicates that greenhouse gases enhance energy loss to space. Using 13 years of NASA satellite observations, we verify the existence of the negative greenhouse effect and find that the magnitude and sign of the greenhouse effect varies seasonally and spectrally. A previous explanation attributes the negative greenhouse effect solely to stratospheric CO2 and warmer than surface stratospheric temperatures. However, we surprisingly find that the negative greenhouse effect is predominantly caused by tropospheric water vapor. A novel principle-based explanation provides the first complete account of the Antarctic Plateau’s negative greenhouse effect indicating that it is controlled by the vertical variation of temperature and greenhouse gas absorption strength. Our findings indicate that the strong surface-based temperature inversion and scarcity of free tropospheric water vapor over the Antarctic Plateau cause the negative greenhouse effect. These are climatological features uniquely found in the Antarctic Plateau region, explaining why the greenhouse effect is positive everywhere else.”
Also:
http://www.antarcticglaciers.org/glaciers-and-climate/changing-antarctica/southern-annular-mode/
“A strengthening of the circumpolar vortex leads to a deepening of the Amundsen Sea Low, cooling most of Antarctica but warming the Antarctic Peninsula, with drier conditions over West Antarctica and the Ross Ice Shelf and Lambert Glacier”
The AMO negative phase is already kicking in as the North Atlantic has cooled significantly in recent years. Cooler weather in the NE US and Europe will be hard to hide, though I’m sure that the adjustment process will try to hide the decline. It’s going to be an interesting decade as all of the climate disaster predictions fall to materialize.
I think we are seeing that they not hiding it, they are claiming “the science” predicted it all along and this is just another manifestation of human CO2 genocide.
Bad humans.
Everything is CO2, it’s so simple once you believe.
Why the surprise?
The narrative is the important thing, not the facts
As Biden said, we don’t need facts, we have the truth.
Ho, hum . . . just more climate-isn’t-settled data.
When will it ever stop? 😉
“Increasingly rapid mass loss is a myth. “
Funnily enough, that reasoning is applicable to any part of the green liturgy you care to name. When the facts show that there is nothing to be alarmed about, what do those in the Church believe?
“Rain falls on peak of Greenland ice cap for first time on record
…This is unprecedented. We are crossing thresholds not seen in millennia”
https://www.theguardian.com/world/2021/aug/20/rain-falls-peak-greenland-ice-cap-first-time-on-record-climate-crisis
Utter hyperbole.
“Greenland ice sheet on brink of major tipping point, says study
The new study, published in the Proceedings of the National Academy of Sciences of the United States of America, used temperature records, ice cores, and modelling to reconstruct the ice sheet’s elevation and melting rates since 1880. “
https://www.theguardian.com/environment/2021/may/17/greenland-ice-sheet-on-brink-of-major-tipping-point-says-study
Climate models rank below politicians and estate agents. When did you last believe one of those?
WW2 airplanes have been found under 86 meters of ice. Multiplied by the 1,710,000 sq.km. of the Greenland ice cap….is about 140,000 Gigatons of snowfall turned to ice since WW2, call it 2500 GT per year of snowfall…it really makes one wonder if the 1-200 GT net loss per year once claimed in the media is valid or a WAG.
The planes are sinking into the ice. The ice isn’t 86 meters taller.
Don’t think so….snow is falling on and around them….just like snow builds up around my ice fishing hutch while it sits on the lake all winter….
Doesn’t matter what you think, what matters is what is happening.
Those are glaciers. Snow falls on the top, and ice flows out the botton.
As a result, the snow that falls slowly sinks down into the glacier. Along with anything sitting on the ice.
The Antartic Neumayer Station has to adapt in hight every summer by 2m, else after 10 years the station will disappear under snow
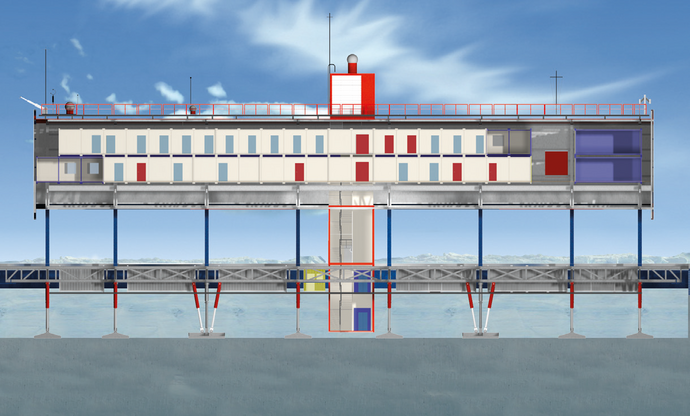
The base of those pillars, just like the planes, are sinking into the ice.
They just wrote disappear “under snow”, means falling snow from above.
Snow falling from above, is why the ice is sinking.
If Greenland were gaining 2m every year then it would be taller than Mount Everest in only 4500 years. Do you think that sounds plausible?
Did your calculations take into account the mass density of the airplane(s) relative to that of ice. That is, an aircraft would likely be sinking faster through “solid” ice than the ice is building up on top of it.
“Ice creep” underneath oil drilling platforms has been found to be a major design factor in limiting what rigs can be located on thick, floating ice in the Arctic.
https://www.flickr.com/photos/62440303@N04/5683785190/
World War II bomber found on the Moon
So? They overshot the landing just a touch – could’ve happened to anyone.
So that’s where I left it. Now if I can just find the keys.
Remember the National Enquirer “Doolittle Raider found on Moon.”
“The last months stand in stark contrast compared to the large net loss seen in 2012, depicted by the red curve.” The red curve shows a slight mass gain, not a loss, from September 1, 2011 to the end of August 2012, not a loss. Something is wrong.
“The following chart plots the total mass balance changes since 1985:”
No – that is surface mass balance and not total mass balance …. which is graphed here (includes basal melt and calving) .
https://arctic.noaa.gov/Report-Card/Report-Card-2019/ArtMID/7916/ArticleID/842/Greenland-Ice-Sheet

“Fig. 3. Total mass change (in Gigatonnes, Gt) of the Greenland ice sheet between April 2002 and April 2019, estimated from GRACE (2002-17) and GRACE-FO (2018/19).”
And …
https://essd.copernicus.org/articles/13/5001/2021/#&gid=1&pid=1
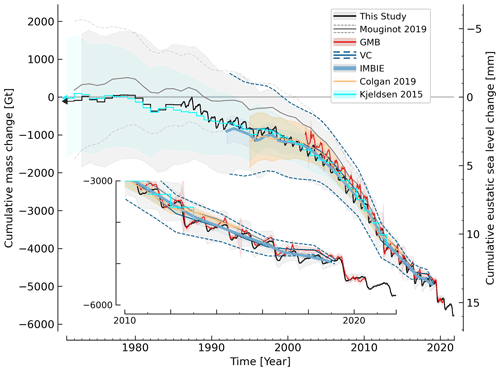
“Figure 4Comparison between This Study and other mass balance time series. Note that various products do or do not include basal mass balance or peripheral ice masses (see Table 2). This Study annual-resolution data prior to 1986 are the Kjeldsen et al. (2015) data adjusted as described in Sect. 5.4. Sea level rise calculated as −Gt/361.8. Inset highlights changes since 2010. Data product version 74 from 25 October 2021 used to generate this graphic.”
The GRACE mission was selected as the second mission under the NASA Earth System Science Pathfinder (ESSP) Program in May 1997. Launched in March of 2002, the GRACE mission is accurately mapping variations in Earth’s gravity field. Designed for a nominal mission lifetime of five years, GRACE is currently operating in an extended mission phase, which is expected to continue through at least 2015 (2017).
https://www.nasa.gov/mission_pages/Grace/overview/index.html
“The larger GRACE-FO trend uncertainty is due to the much shorter data record length. Even with this large uncertainty, we do observe a statistically significant reduction in the rate of mass loss during the first 11 GRACE-FO months, as compared to the full GRACE data span.
If you would have a look at your first linked graph you should be able to see a reduction / slow down in decrease of mass lost, don’t you ? 😀
Unfortunately “your” plot ends in 2019
So your assertion doesn’t refute anything.
No – that is surface mass balance and not total mass balance …. which is graphed here (includes basal melt and calving) .
The surface mass balance can be believed. GRACE volume data? Not so much.
Not that the ice loss could actually be measured to the accuracy claimed in the chart on a year over year basis, but, 4000 Gt of ice loss is still a rounding error compared to the total ice mass of Greenland.
The chart is meaningless and the wailing and gnashing of teeth over it is pointless.
Max P
No, it’s the TMB of Greenland. If you would accumulate the datapoints of the years since 1986 you would get a similiar figure to Grace.
BUT: you would not see clearly that the loss rate went down since 2012 wich is not explainable when the ice loss of Greenland would accelerate as one could hear it in some media. That’s the point of the graph in the post.
AbstractJakobshavn Isbrae has been the single largest source of mass loss from the Greenland Ice Sheet over the last 20 years. During that time, it has been retreating, accelerating and thinning. Here we use airborne altimetry and satellite imagery to show that since 2016 Jakobshavn has been re-advancing, slowing and thickening. We link these changes to concurrent cooling of ocean waters in Disko Bay that spill over into Ilulissat Icefjord. Ocean temperatures in the bay’s upper 250 m have cooled to levels not seen since the mid 1980s. Observations and modelling trace the origins of this cooling to anomalous wintertime heat loss in the boundary current that circulates around the southern half of Greenland. Longer time series of ocean temperature, subglacial discharge and glacier variability strongly suggest that ocean-induced melting at the front has continued to influence glacier dynamics after the disintegration of its floating tongue in 2003. We conclude that projections of Jakobshavn’s future contribution to sea-level rise that are based on glacier geometry are insufficient, and that accounting for external forcing is indispensable.
https://www.nature.com/articles/s41561-019-0329-3
This may agree with the chart below.
Damned ice and snow! Refusing to melt as the greenunistas command it to.
Will Greenland go the way of some parts of the US and appoint a Chief Heat Officer?
At last! A hockey stick!
I’d say it looks more like lacrosse than hockey, as far as stick drawings go!
There will be more coastal ice around Greenland this winter. There will be no shortage of snow in Scandinavia and Iceland.
Interesting that net loss is driven mainly by calving not melting. Increased melting apparently led to rapidly increased calving initially, but now there appears to be rapidly diminishing returns on that effect. Maybe as the ice floes thin out they stop moving as fast. Or maybe eventually the meltwater underwash exposes more solid rock that slows the ice floes down. Or a combination of both factors more likely. Just speculation though.
Given that on Greenland pressure from the mass of ice above it causes calving (like squeezing toothpaste from a tube) and that a small amount of melting could act as grease to the wheels, chances are that the melting has stopped and the ice movement has slowed right back down.
Meanwhile, Greenland’s minimum snow cover (the area of land still covered by snow at the end of summer) has grown by about 100,000 square kilometres in the past 30 years. At this rate Greenland will be completely covered in snow all year round in about 45 years. Data from http://climate.rutgers.edu/snowcover/table_area.php?ui_set=2
See https://kenskingdom.wordpress.com/2021/07/30/global-warming-or-global-cooling-keep-an-eye-on-greenland/
Excellent article, I recommend it to everyone. It shows how you can get data that is not being talked about. Thanks!
Thanks a lot for the data link !!
If you look at Greenland’s minimum snow cover since 1972
you clearly can see that the snow cover grew mainly before the year 2000, even when ignoring the extreme low in 1974.
This holds as well if you start 30 years back from now.
The trends for the minimum snow cover are, in km² / year
The trends are not terribly significant from a statistical point of view, that is more than evident.
But what they show can’t be denied, namely that Greenland’s snow cover didn’t grow linearly during the last decades, but was subject to big fluctuations.
This is not the data you seek
The ozone hole in the South is already breaking records for November.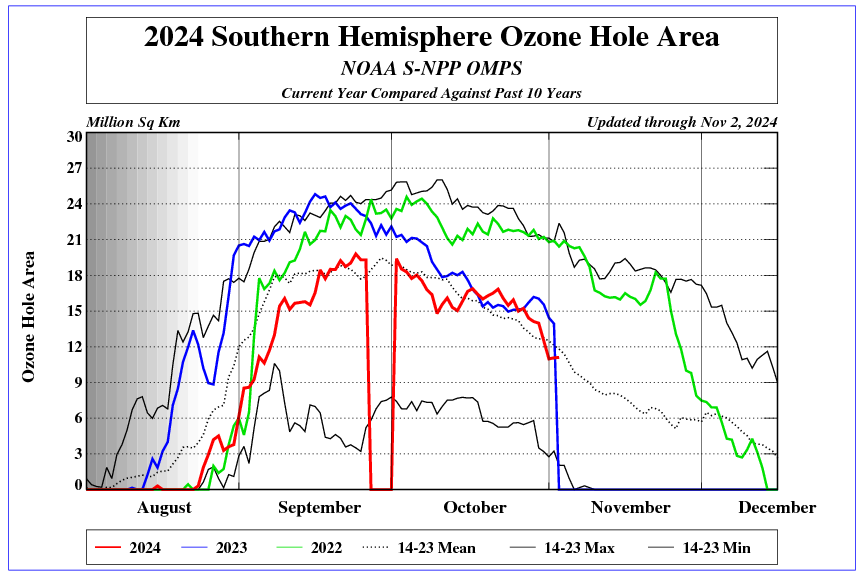
I remember there being a ozone hole over Kennebunkport when Bush was in office…that one always cracked me up.
For a long time the Jakobshavn glacier, the biggest one in Greenland, was the poster child of catastrophists due to its impressive melt and retreat.
In 2016 however it’s retreat abruptly stopped and changed to advance.
At the time this was reported to be connected with local oceanography, specifically a cooling of the water in Disko Bay.
Is Jakobshavn glacier still advancing and growing?
There now seems to be a chilling silence on the internet about the current status of Jakobshavn glacier.
Only out of date news of its earlier retreat in past decades being endlessly recycled.
Can anyone give a recent update on the status of Greenland’s Jakobshavn glacier?
Ireneusz posted this from 2019:
https://www.nature.com/articles/s41561-019-0329-3