Guest post By David Archibald
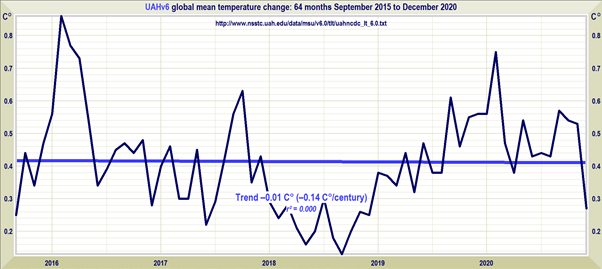
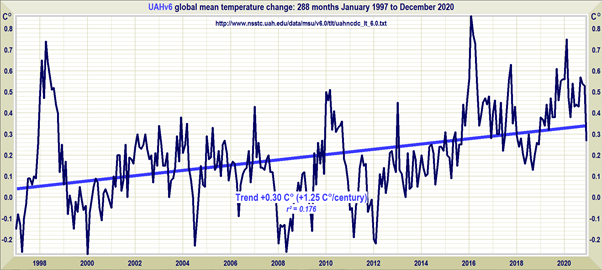
Our planet’s temperature peaked in 2016 and has been in a disciplined decline since. It is in a channel 0.5°C wide with a slope of -0.03°C per annum. The atmosphere had been warming at 0.013°C per annum according to Dr Roy Spencer’s work. If the established cooling trend continues it will only take another decade to get back to the temperatures of the early 1980s. With the cooling trend firmly established, the question is: Can the proximate cause be found in the solar record?

Figure 1: NCDC global temperature anomaly 1979 – 2021
From the mid-1980s the atmospheric temperature was in an uptrend channel 0.75°C wide with its boundaries shown by the purple lines. It was a disciplined uptrend with the lower bounding line being touched four times over 30 years. Similarly the current downtrend has its lower bound defined by four data points.

Figure 2: Jurisdictions that have declared a climate emergency
The darker shade of blue is at the national level. Most of Europe has declared a climate state of emergency which is fitting as a cold winter is forecast which will be accompanied by extortionate power prices and possible blackouts due to a lack of natural gas. The degenerate Europeans may find conditions challenging. The good thing about a climate emergency is that the language encompasses cooling as well as the much-feared warming so the climate emergencies don’t have to be lifted no matter how cold it gets.

Figure 3: Sea level at Fort Denison, Sydney 1914 – 2021
Sydney, Australia declared a climate emergency in June, 2019 and is bravely awaiting its fate from rising sea levels. In fact sea level in Sydney has established an uptrend of 4 mm per annum in a channel 220 mm wide which has taken sea level back to that of over a hundred years ago.

Figure 4: F10.7 Flux and Oulu Neutron Count 1964 – 2021
This is the first clue that the Sun is causing the cooling trend. The importance of the neutron count is that neutrons provide nucleation sites for cloud droplets. A proportion of the atmosphere has enough water saturation for clouds to form but lacks nucleation sites for cloud droplets. Increased cloud cover increases the Earth’s albedo and more sunlight is reflected into space. There has been a widening of the gap that formed between the F10.7 flux and the neutron count at the end of the Modern Warm Period. If the widening continues, that trend will become significant.

Figure 5: Heliospheric current sheet tilt angle
This figure is included to show the relative length of the solar cycles.

Figure 6: F10.7 flux for solar cycles 19 to 25 aligned on the month of minimum
So far Solar Cycle 25 is tracking exactly as per Solar Cycle 24 to this point.

Figure 7: F10.7 flux and Ap Index 1964 – 2021
The Ap index, a geomagnetic index, doesn’t correlate well with the solar cycle. The abrupt decline in 2006 though does mark the end of the Modern Warm Period, confirmed in other data series.

Figure 8: aa Index 1868 -2020
Before the Ap index there was the aa index which has data back to 1868. The Modern Warm Period stands out as a period of higher activity of the aa index. Since the end of the Modern Warm Period the aa index has averaged 14.6, very similar to the average of the last decades of the Little Ice Age. This is also likely to be the long term state of the Sun.

Figure 9: Cumulative aa index
This graph uses a technique useful for finding long term turning points. It shows that the Modern Warm Period started in 1993 and ended in 2006.

Figure 10: Interplanetary magnetic field
This is similar to the Ap index in that it shows a flat period during the 1970s cooling period of Solar Cycle 20, not the rise typical during a solar cycle, and an apparent floor of activity during the Modern Warm Period which was breached in 2006. There is an interesting development in that the interplanetary magnetic field has been flat at best since the solar minimum.

Figure 11: Sunspot area by solar hemisphere 1874- 2021
This figure also shows that solar activity has returned to the level of the late Little Ice Age.

Figure 12: Sunspot area by solar hemisphere 1985 – 2021
Breaking down solar activity by hemisphere shows that solar activity is more disciplined than is apparent from the sum of the hemispheres. The peaks of the last three cycle by hemisphere are aligned, likely to be caused by the major gas planets going above or below the plane of the solar system. The southern hemisphere peaked two and a half years after the northern hemisphere.

Figure 13: Sunspot area by hemisphere 1874 – 1924
The disciplined decline of solar activity by hemisphere over the last three cycles isn’t a one-off event. There was a similar trend in activity for the southern hemisphere in the late 19th century.

Figure 14: Hemispheric sunspot area and F10.7 flux
Sunspot area corresponds to the F10.7 flux. So if you have F10.7 flux, sunspot number is superfluous.

Figure 15: Dye 3 10Be record
This is the 10Be record from the Dye 3 borehole on the Greenland ice sheet drilled in 1979 – 1981. It is similar to the neutron count in that the lower the number, the stronger solar activity pushing galactic cosmic rays from the inner planets of the solar system. This data shows how anomalous the Modern War Period was and what we will return to.

Figure 16: Solar wind flow pressure 1967 – 2021
This seems to be driven by some deeper process in the Sun and is overprinting the solar cycle.

Figure 17: Oulu neutron count 1964 – 2021
This is the inverse of the solar cycle – the peaks correspond to solar minima. There appeared to be a ceiling of activity during the Modern Warm Period. That was broken with the shift to a new phase of activity. What is promising is that the 24/25 minimum could be developing a broad top. If so, sustained cooling will follow that.

Figure 18: Oulu neutron count aligned on the month of solar minimum
This figure shows that the current cooling trend started or coincided with the Oulu neutron count being above 6,500 in 2016. The last few months of data (thicker orange line) show the count continuing to go sideways.

Figure 19: Alpha/Proton Density Ratio
This figure also shows a flat trend through the 1970s cooling period followed by a 40 year long downtrend in activity. Whatever solar processes caused the Modern Warm Period and the mild warming we all enjoyed in the second half of the 20th century, they are declining and the Sun is returning to its normal, colder state.
David Archibald is the author of American Gripen: The Solution to the F-35 Nightmare
The solar cycle/ocean cycle people have been predicting the imminent start of a new cooling trend since at least 2008, that I have seen here at WUWT.
Keep it up, eventually you will be right.
The unknown factor is the lag time caused by internal ocean cycles. It was apparent from 2000 that the jet stream pattern was changing but that only led to a pause. Only recently have there been signs of cooling.
Most recent extremes of weather can be attributed to the more meridional jets typical of cooling periods.
Indeed.
As is often the case, folks like Tony are factually correct. It’s just that the facts they present, out of context, are insufficient to explain what’s going on.
TonyL could be following the BBC’s school of the scary science, there’s nothing that is not direct result of global HEATING:
Global heating: Study shows impact of ‘climate racism’ in US
https://www.bbc.com/news/science-environment-57235904
I hope my heating ( in the UK) is working this winter.
Thanks Sara.Try TonyL further up he will believe anything, I’m Marxist don’t believe in accounting personal wealth.
spam mods
MODS
Spam alert!
Just automatically filter anything with that URL…
yo mods
how bout some of your magic?
Someone needs to look at how the changes in the earth’s magnetic field effect the jet streams. There have been significant changes in the past few years.
There is an appointment strong inverse correlation
http://www.vukcevic.co.uk/CT4-GMF.htm
reason unknown for time being.
What mechanism do you propose that might be affecting the atmosphere? Absent any reasonable mechanism, any assumed correlation would have to be considered spurious.
The Madden-Julian Oscillation is a likely candidate and Joe Bastardi at Weatherbell Analytics does an excellent job of explaining the various phases in his videos. The Saturday Summary under the Premium header will allow free access. I have a paid subscription at $29,99/mo and have been a subscriber for almost a year. Enjoy Joe’s erratic/funny deliveries of meteorology.
That factor of course obviates any reason other than the climate itself to account for quasi-periodic variation on the climate. We dont need the sun to vary, CO2 to increase or volcanoes to erupt to have a climate that moves up and down in a random sort of way. Its complex enough, with enough time delayed feedback paths, to do that all by itself.
To look for any cause beyond is already to be sucked into the ‘must be something causing it’ espoused by warmunistas.
Probably should check with your clergy of the Church of Warming/ Climate for forgiveness. As long as anyone uses fossil fuels there is no chance of cooling according to the gospel, so admitting that cooling trend will happen eventually is a sin.
Here’s a projection from 2007
Here’s the projection from 2007
http://www.lavoisier.com.au/articles/greenhouse-science/solar-cycles/Archibald2007.pdf
Wasn’t the arctic supposed to be ice free in the summer by now?
No

Hmmm, the last ten years don’t fit that logarithmic plot. Seems there might be some good news, since it looks like a slight gain over that period, doesn’t it?
No. In fact, IPCC AR6 says 66% chance by 2050 (SPM pg. 20) which is the earliest date I’ve seen published from them. But more on topic how are Easterbrook’s predictions working out?
That is so flattering. Within minutes of a post of mine you have a graph of mine from 14 years ago. It is also an admission on your part that there has been no warming or otherwise you would not have bothered.
Amazing what you can find on the internet. Someone talks about people predicting cooling since 2008. I look to see if I can find anything earlier and your paper just showed up.
You obviously missed my other comment where I mentioned the warming rate since 2006, when your “new cold period” started.
You are such a flatterer, shameless really. You say you did a search and my work comes up without any effort on your part seemingly? Somehow I earned a high ranking in search results. Though, funnily enough, I have gone back to cancer research in the last couple of years and when I do a search in the field, stuff I have done comes up on the second page of results.
I’m not sure what I’m being accused of here, or why you think it matters.
I can’t prove that I found your paper using an internet search on a train journey, rather than having a team of researchers supplied by an international conspiracy. But as you don’t deny you made the projection and that it was wrong, why does it matter?
by the way, check the time stamp on my comment. It was made 2 hours after the comment I was responding to, not “within minutes”.
That’s Bellman’s job
Are you willing to admit your prediction from 2007 was wrong? In the presentation linked to above you state:
which is a prediction that we can now see to be clearly wrong. In fact the temperature in 2017 was the third highest on record only beaten by 2019 and 2016.
Given that you were dramatically wrong in the past can you explain why and how your theories have changed since then?
C’mon, that’s the best you can do? Archibald makes a presentation largely showing where we are right now, supported by data (or more like presents data with a mild overlay of interpretation) and your only response is, “You’re wrong and you have always been wrong!”? You have to do better than that. “In God we trust, all others bring data.” – Undetermined
Help me out with your prediction. Just eyeballing it looks like you were thinking maybe a 1.5C decline by 2020. Do you agree or disagree? And How would you characterize this prediction in terms of its skill?
“The solar cycle/ocean cycle people have been predicting the imminent start of a new cooling trend since at least 2008, that I have seen here at WUWT.”
They’ve been right about warming, it’s not happening.
I’ve never seen a single prediction from the dodgy AGW theory that was right. In fact they always end up making fools of themselves. Ice free Arctic, Antarctic melt above volcanoes and a magma chamber etc etc etc
They won’t give up the comedy act, you can be sure that’s settled.
Too many careers and too much money involved :<)
And there are 100s of thousands of positions in gov at all levels, universities, research institutions … with millions of staff named ‘anthropo warming crises and disasters management’s.
They don’t do anything but cheerlead because they want to have disasters to shore up the meme. The deadly flood in a German city caused by a timely forecasted heavy rainstorm (three days ahead), had no public warnings from ‘climate managers, and no reduction in dam levels to prepare for it.
Hey TonyL – Go vaxx yourself! We correctly predicted the current cooling in 2002.
https://wattsupwiththat.com/2019/10/27/the-real-climate-crisis-is-not-global-warming-it-is-cooling-and-it-may-have-already-started/#comment-2835920
Well, there is the perfect Trifecta – my work here is done:
In 2002 co-authors Dr Sallie Baliunas, Astrophysicist, Harvard-Smithsonian, Dr Tim Patterson, Paleoclimatologist, Carleton, Ottawa and Allan MacRae wrote:
http://www.friendsofscience.org/assets/documents/KyotoAPEGA2002REV1.pdf
1. “Climate science does not support the theory of catastrophic human-made global warming – the alleged warming crisis does not exist.”
2. “The ultimate agenda of pro-Kyoto advocates is to eliminate fossil fuels, but this would result in a catastrophic shortfall in global energy supply – the wasteful, inefficient energy solutions proposed by Kyoto advocates simply cannot replace fossil fuels.”
Allan MacRae published on September 1, 2002, based on a conversation with Dr. Tim Patterson:
https://wattsupwiththat.com/2009/01/10/polar-sea-ice-changes-are-having-a-net-cooling-effect-on-the-climate/#comment-63579
3. “If [as we believe] solar activity is the main driver of surface temperature rather than CO2, we should begin the next cooling period by 2020 to 2030.”
MacRae modified his global cooling prediction in 2013, or earlier:
3a. “I suggest global cooling starts by 2020 or sooner. Bundle up.”
https://wattsupwiththat.com/2013/12/02/study-predicts-the-sun-is-headed-for-a-dalton-like-solar-minimum-around-2050/#comment-1147149
[excerpt]
See electroverse.net for extreme-cold events all over our planet.
You must not have any training in a science or engineering discipline. Go learn about heat transfer. The sun spot cycle is 11 years and is cyclic. The Sun outputs a lot of heat and the Earth absorbs a lot of heat. It takes a long time for heat transfer to occur. On the order of decades.
Don’t get me wrong, as I’m the first to say that the so-called climate crisis is a scam, but the atmosphere and upper skin layer of the surface cools overnight. The deeper depths of the land and ocean will take a much longer time to respond to long term warming or cooling, the deeper you go, the longer it takes. It takes not decades at deep depths of the ocean, it takes hundreds to thousands of years.
Bob, “The sun spot cycle is 11 years and is cyclic.”
No, the AVERAGE Cycle is 11 years. Of the recorded completed cycles only Solar cycle 24 had a life of 11 years. The rest varied from 9.0 to 13.6.
Solar cycles (multi-cycles) and the AMO cycle take time, but we are getting to a more interesting part of those cycle turning points now relative to debate-has-ended zero correlation warming dogma. The gap between reality and dogma will widen and the religious defense will get more desperate over time. It’s now an all out race for them to lock in more carbon taxes and wealth redistribution schemes before the jig is up. Dumbing down science and buying media time with pay-to-play news are last ditch efforts.
At least, as good as Al Gore’s prediction of Arctic ice-free in 2013… So, science is settled!
Al Gore was repeating something – a prediction by someone else.
Who was that person or persons?
See this for a start (and read the rest of that post):
https://www.keywiki.org/Al_Gore#Socialist_mentor
Why would anyone draw lines through a very noisy signals minima and peaks ignoring smothing of all the data? Seems dubious to me. Perhaps I am missing something?
It’s been over 10 years without any statistically significant warming.
Schuckmann 2020

Marinara sauce?
Ooh! Scary?
Not!!
Zeta joules that are converted from Celsius measurements well within error bounds of the instruments.
Then fantasized into a scary looking graph that represents hundredths of a degree Celsius increase per decade.
A delusional aggregation that neither legitimizes nor validates any ocean temperature increase assumptions.
Can you post a graph of net energy uptake with an uncertainty analysis that you feel isn’t delusional?
Oh, you admit your graph is delusional! That’s progress bdgwx.
No. I never said that. Also, it’s not my graph. It comes from Schuckmann et al. 2020.
No it has not.
Even the great snake-oil sell Monckton says it’s 6 years of “no warming”.
This despite the obvious and embarrassing fact that his straight line trend (~ 0.42C) for that “pause” is running higher than the LT trend (0.34C). …
Do tell me (and pass it on to the SO seller), how can there be a pause when IF there hadn’t been one – the trend would have been lower?
http://berkeleyearth.org/wp-content/uploads/2021/01/2020_Land_Time_Series.png
You missed key words “statistically significant” in your rush to ad hominem Christopher Monckton, which tells us a lot how much science you have. Also, how about stretching your graph to include LIA.
“Also, how about stretching your graph to include LIA.”
Err, I was replying to …
“It’s been over 10 years without any statistically significant warming.”
And I think, if you check that the LIA was a tad longer ago.
“You missed key words “statistically significant” in your rush to ad hominem Christopher Monckton”
That’s called hypocrisy.
Look here …
https://wattsupwiththat.com/2021/01/14/a-new-pause/
And tell me where Monckton uses the words “statistically significant” (in the head opinion piece).
Also, as he is told in that thread, the trend IS statistically insignificant – yet pushes it and argues back with ad hom himself (been there many time – so mine is merely returning the favour)
So, indeed Monckton is a snake-oil seller, an here we have just another denizen buying unthinkingly.
BTW: I know way more than M’lord with his qualifications in Journalism and the classics. (just ask if you don’t know or Google)
Now draw the line from the Medevil or Roman warm period. Oh wait, depending on the graph you use they do not exist.
Look you are correct about cherry picking the starting time. However that is the point.
Now, the problem with predictions is you are right until you are wrong and wrong until you are right. The main issue with climate change is that according to the theory the temperature does not HAVE to only rise. In fact it can fall globally drastically and the scientists still have their butts covered.
It is one of the reasons I dislike ‘climate change’ science.
“It’s been over 10 years without any statistically significant warming.”
Is statistically significant warming (or cooling) expected to be seen in a period as short as 10 years?
Is the so-called “cooling” since 2016, described in the above article, statistically significant? Not that I can see. Yet the author descibes it as “firmly established” and not a word about statistical significance is mentioned.
The statistical significance test only applies to warming, it seems. Just a couple of years natural cooling and we have a “firmly established” cooling trend. Whatever you do, don’t mention significance tests when results are going the way you want them to. AKA ‘confirmation bias’.
“It’s been over 10 years without any statistically significant warming.”
Could you be more specific. Using which data set, how far over 10 years, and what method are you using to calculate the significance?
For example, using UAH and the Skeptical Science Trend Calculator, the warming since the start of 2011, just over 10 years is statistically significant, at the 2σ level. Rate is +0.43 ± 0.38°C / decade.
Not that I think this means much, but nor does the absence of a ten year period of statistically significant warming. In UAH 40+ year history there are virtually no 10 year periods of statistically significant warming.
The NCDC graph has cooled the more distant past, but does fairly accurately reflect the recent, 5.5 year long downtrend. For instance, Super El Niño of 1997-98 should be only a tiny fraction of a degree less warm than SEN of 2015-16.
I would disagree with when the modern warm period started.
As far as I can tell, nobody disagrees that glaciers worldwide have been melting since the middle of the nineteenth century. Also, as Judith Curry points out, the warming in the early twentieth century is indistinguishable from that of the late twentieth century.
The CAGW alarmists twist themselves into knots trying to explain why the two above points don’t matter. The historical record is crystal clear though. The world has been warming since the mid-1800s.
The climate patterns that have occurred during the Holocene clearly have nothing to do with human activity. The modern warm period is no different.
What influence does solar activity have on the global climate? I can’t see why it wouldn’t matter. On the other hand, people have been trying to correlate sunspots with the climate ever since Herschel and haven’t been very successful.
So, are we entering a cooling period? I would say it isn’t so obvious yet that we can rub the noses of the CAGW alarmists in it … yet.
Having said the above, David Archibald makes an excellent case. Mother Nature will tell us if he’s correct.
Probably slightly earlier than mid1800s, perhaps more likely from 1820 – 1840, certainly from available long glacier datasets. I have looked at the glacier datasets and with cross-correlation to temperature there is of course a lag. Same is true of sea level data. There are only a few long glacial records that far back, mainly European, but they consistently suggest solid warming from about 1840, with a few slightly earlier, when the lag is taken into account. Of course the glacial retreats start slightly later than the causative warming because of the lag – eg the Mer de Glace was in the Chamonix valley until about 1855 (photos to show it).
Also, if you look at the rates of retreat there are three clearly defined periods. Using only the glaciers with long records back to 1800 or earlier (there are 18 of them) the rate of retreat in the late C20th is the slowest retreat with the early C20th and mid C19th retreats being similar to each other and quite a bit faster than the late C20th retreat
Perhaps that is because sunspots alone don’t tell the whole story of how the Sun is varying, and in ways beyond just the minor variation they create is solar insolation at Earth TOA.
Solar input alone is non specific. It is the outcomes of that energy both immediate and delayed in the form of ocean distribution and atmospheric dynamics that control the surface temperature, and wind flow volume and direction, glaciers, sea ice area and Polar temperature etc.
The missing part in understanding climate science is atmospheric dynamics and the mechanisms that control them. Arctic amplification is one example.
No one notices the small things such as the ozone hole initial peak area of dilution and the Arctic sea ice minimum both occured on the 16th September this year, both are controlled by the same controlling atmospheric dynamics.
Solar input is one part, it’s what follows that gives the detail, and climate as it’s generally called.
It has been said on here before I believe, some while ago now, that there is a link between Solar activity & seismic/volcanic activity here on Earth & possibly even the Moon. Is it possible then that the recent seismic/volcanic activity observed in Italy, Iceland, & Alaska, is indeed linked to such observations?
Apologies to the Canary Islands for leaving their woes off the list, unintentional I assure you!!!
And Haiti and Melbourne (yesterday)……
And previously in the Caribbean – St Vincant La Soufriere started blasting off in April, but has been calming down since.
Does seem like a bit of volcanic activity around the world, but what is normal?
https://www.volcanodiscovery.com/volcanoes/today.html
Apologies to the good people of Melbourne also, hadn’t heard anything about Haiti, certainly not on the BBC. I am so please I live in a non Earthquake zone, although we do occasionally have an occasional tremor, naturally caused by manmade globul warming of course!!! It’s well known in Warmunista circles that there is no such thing as a natural occurrence of anything, it’s all down to evil wicked Free-Enterprise democratic countries in the evil west!!!
If there is any effect to find, you must first separate out oceanic crust volcanoes from continental crust ones in the record. Oceanic crust is thinner.
Alan the Brit, the lava fountaining in the current eruption on the island of La Palma, in the Canary Islands, is produced by progressive crystal fractionation in the magma chamber, a process of decades at the minimum. This process segregates gas which increases pressure, and when the pressure exceeds the lithostatic load the eruption occurs. Note that these are fissure-guided flank eruptions and not from the top of the older shield volcano. How can solar activity be linked to volcanic eruptions if there are at the minimum decades of magma chamber effects before any eruption is possible? The fissure opens when the ground swelling, caused by gas accumulation (think of the day after eating bad tacos), exceeds the fracture resistance of the country rocks, so that’s not it.
And meanwhile the United States Geological Survey (USGS) has had to explain the sharp summer decrease in activity at Yellowstone with similar data driven information.
Volcano Updates (usgs.gov)
“Subsidence of Yellowstone Caldera, which has been ongoing since 2015, has paused during the summer months, reflecting seasonal groundwater recharge.”
Thanks, John, I read the August update on Yellowstone, and their report is fairly normal. They say there is subsidence in the caldera, that is what calderas are, dramatic central subsidence as a response to pyroclastic eruption, followed by slower subsidence as the magma at depth cools and degasses. The slower current subsidence being interrupted by summer water saturation, they say less than 1 cm, is not a landmark event in the history of Yellowstone Park Caldera. Both Yellowstone and the Canary Islands are produced by plates passing over a mantle hotspot, only continental crust adding to the melt in the case of Yellowstone (more explosive results) and oceanic crust in the case of the Canary Islands (and also the Hawaii Islands).
Good collection and presentation of solar data by David Archibald. It appears likely that variable solar effects participate in the earths climate cycles, the problem is that other factors do also, and the lag times of the interactions of all this make correlation difficult. It is easy to imagine that the various lag times, coupled with forcings and feedbacks, make the prediction of climate cycles difficult, and, of course, impossible to model on computers. If you live on the southwest coast of the island La Palma you think the climate cycle is a burning hell on earth.
Just predicting winters in the NH would be a good start.
That’s what the Farmer’s Almanac is for! 🙂
“It is in a channel 0.5°C wide with a slope of -0.03°C per annum. The atmosphere had been warming at 0.013°C per annum according to Dr Roy Spencer’s work. If the established cooling trend continues it will only take another decade to get back to the temperatures of the early 1980s.”
The graph presented shows essentaully no change since 2016, at a value that is around 0.6C above the early 1980s. It would take at least 2 decades at the trend of -0.3C / decade to return to the temperatures of the early 80s.
“ It would take at least 2 decades at the trend of -0.3C / decade to return to the temperatures of the early 80s.“
And would require either an immediate cessation of GHG emissions combined with the deployment of as yet unfeasible carbon capture technology or for a whole bunch of pretty basic physics to be wrong.
Unfortunately neither is going to happen and the trajectory will trend back to warming.
Based on?
Models…
That is based on the planetary energy imbalance of +0.8 W/m2 and the 1LOT and 2LOT.
It isn’t going to start warming again
Gaia speaks to him. How else would he be so certain?
He can be “certain” because the science is on his side.
fretslider, just stuff (mostly mythic) posted on a blog.
Now who do you think the betting man would choose?
I’m certain because the law of conservation of energy is real and unsalable. As long as the planetary energy imbalance is positive the climate system as whole will accumulate energy without exception. And if the climate system is accumulating energy then at least on a decadal time scale more energy will transfer into the atmosphere than out of it and so it too will warm.
Phishlips, natural variability has overcome the putative effects of CO2 before. The cooling period from ~1940 to 1970 took place while atmospheric CO2 concentration was increasing and, since the effect of CO2 on temperature is known to be logarithmic, each unit increase that took place in 1970 was more impactful than it is now. You’ve assumed that the only control knob on the climate is CO2 but that’s clearly false.
“The cooling period from ~1940 to 1970 took place while atmospheric CO2 concentration was increasing ”
It did, and it was – but barely so (it really took off post 1970), and was almost completely gobbled up by the -ve forcings of aerosols ….
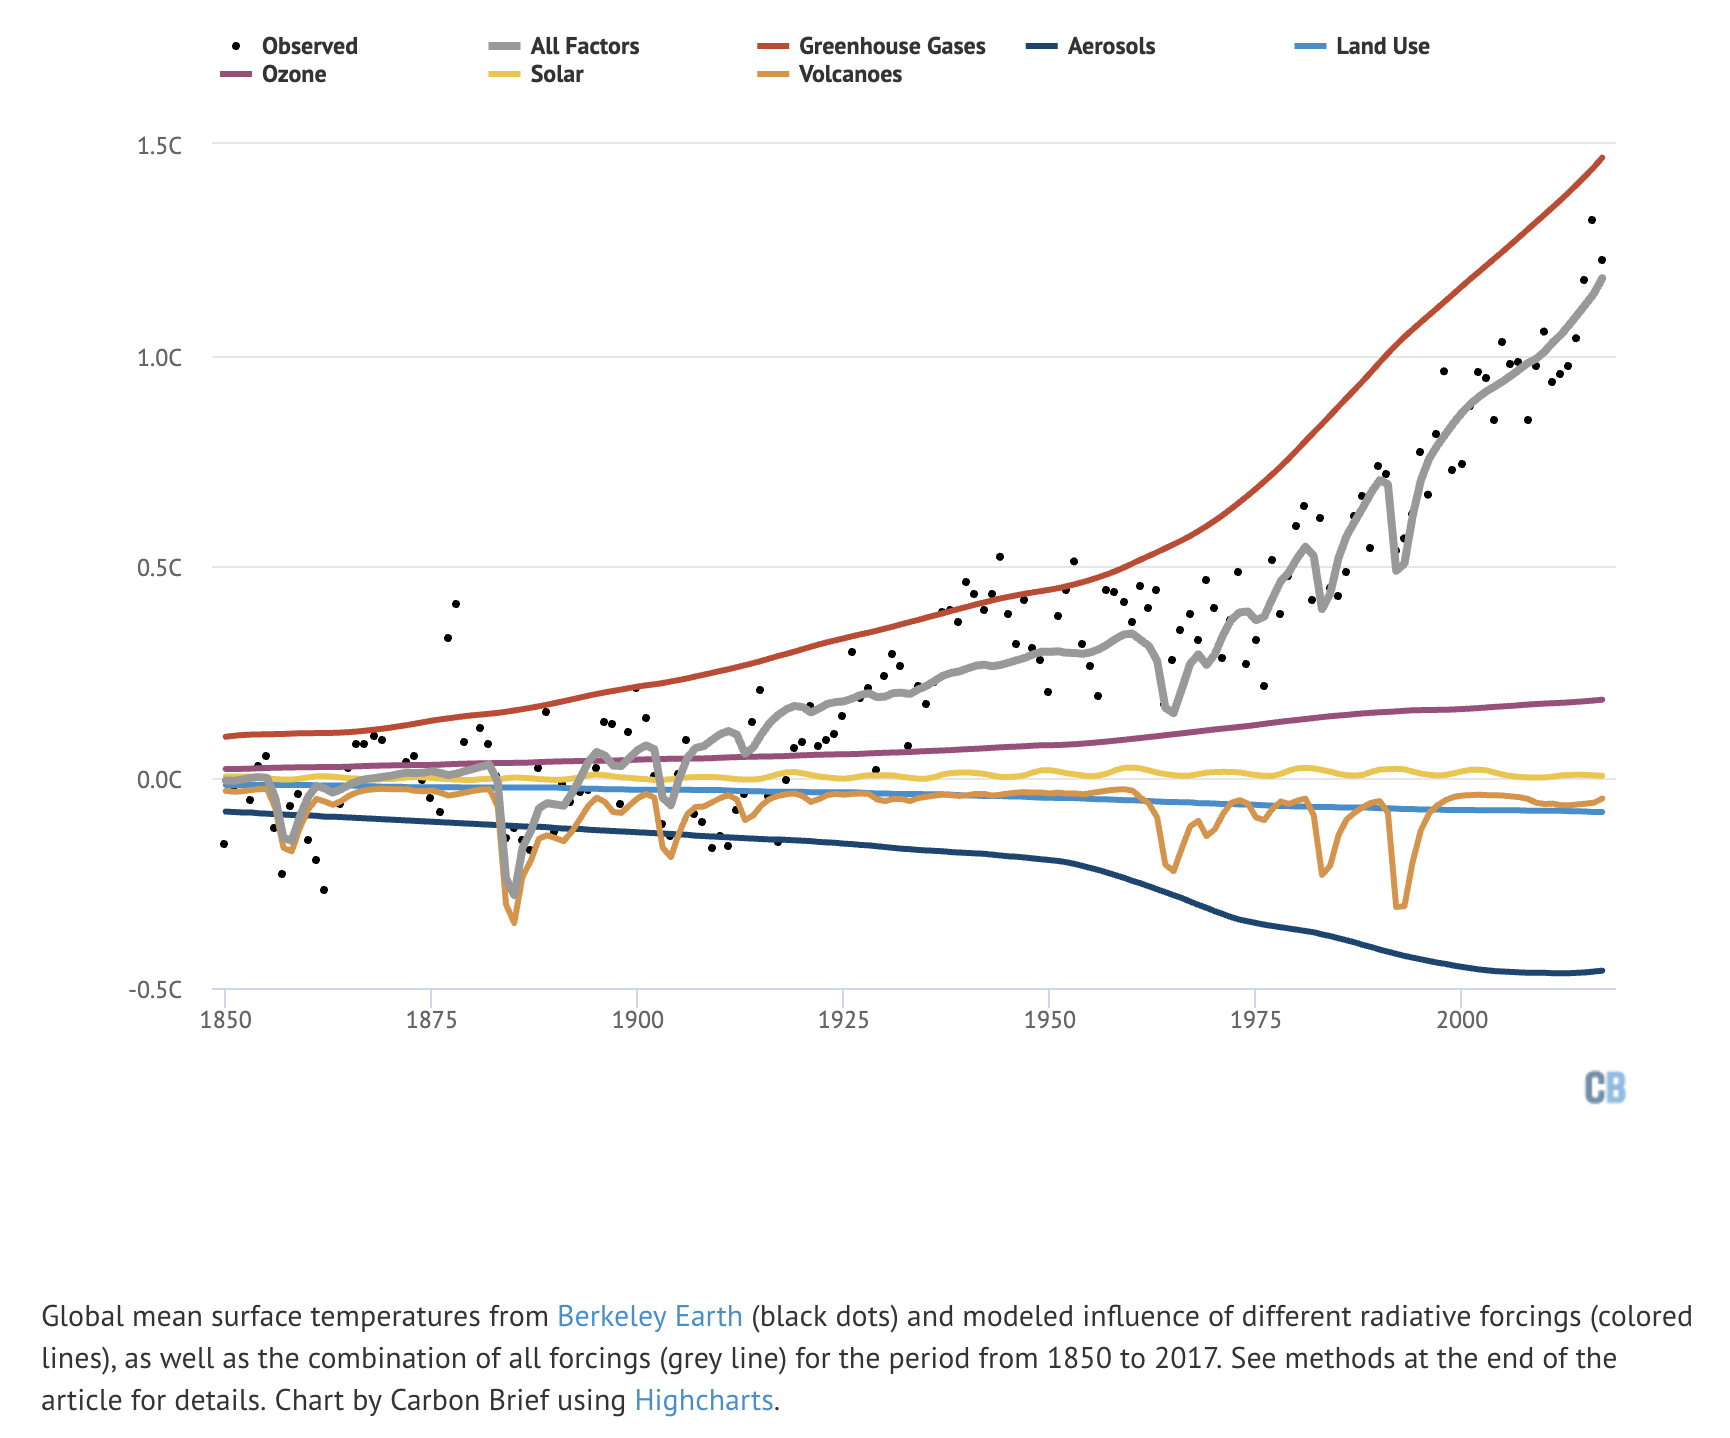
Totally bogus plot, Banton, for two reasons;
1) It’s inconsistent with measured data.
Feldman, D., Collins, W., Gero, P. et al. Observational determination of surface radiative forcing by CO2 from 2000 to 2010. Nature 519, 339–343 (2015). https://doi.org/10.1038/nature14240
They MEASURED a 0.2 +- .0.06 W/m^2 change in the radiative forcing from 2000 to 2010 from the 22 ppm change in CO2 concentration. Your plot shows a much greater increase than actually measured. Your plot is made up; as in not based on actual data.
2) Your plot doesn’t show the MASSIVE uncertainties in all of those factors. Look at the error in the measured CO2 forcing in 1) above – the error is ~1/3 of the delta. The error in aerosol forcing is even greater, likely much greater.
Your plot has been concocted to convince you that the Alarmists have complete knowledge when they actually don’t accurately know any of those things. If they had used only actual data and uncertainties, the plot wouldn’t convince anyone, even a complete idiot, of anything.
Yes, yes – the many many scientists who compiled it are complete idiots.
Or “frauds” perhaps?
And you are genius because you read climate sceptics blogs.
No, Not made up.
From IPCC AR5 2013 (via Berkeley
https://www.ipcc.ch/site/assets/uploads/2018/02/WG1AR5_Chapter08_FINAL.pdf
See Supplementary Material Table 8.SM.8
“Figure 8.18 | Time evolution of forcing for anthropogenic and natural forcing mecha- nisms. Bars with the forcing and uncertainty ranges (5 to 95% confidence range) at present are given in the right part of the figure. For aerosol the ERF due to aerosol– radiation interaction and total aerosol ERF are shown. The uncertainty ranges are for present (2011 versus 1750) and are given in Table 8.6. For aerosols, only the uncertainty in the total aerosol ERF is given. For several of the forcing agents the relative uncertainty may be larger for certain time periods compared to present. See Supplementary Material Table 8.SM.8 for further information on the forcing time evolutions. Forcing numbers provided in Annex II. The total antropogenic forcing was 0.57 (0.29 to 0.85) W m–2 in 1950, 1.25 (0.64 to 1.86) W m–2 in 1980 and 2.29 (1.13 to 3.33) W m–2 in 2011.”
FYI:
If you look at at what is plotted on the y-axis on the Berkeley graph (first one) it is Celsius.
That paper is concerned with W/m2 – which is on my 2nd graph.
Of course there are uncertainties but not getting on for 300% which is how much CO2 has gone up since 1950.
Not the same ball-park.
Figure it out. The MEASURED forcing increase was 0.2 +- .0.06 W/m^2 from 2000 to 2010 from the 22 ppm change in CO2 concentration. There’s been a total of 413 – 280 = 133 ppm increase in the CO2 concentration since ~1800. If forcing scaled linearly with CO2 that increase in CO2 would have resulted in a total of 1.21 W/m^2 of forcing but remember that the forcing is logarithmic with CO2 concentration. The total change is therefore strictly LESS than 1.21 W/m^2 TO DATE (and we’ve already added the most impactful CO2). Your BOGUS plot claims that the lower bound of the CO2 forcing is 1.13 in 2011. Their lower bound is almost the same value as the upper bound from actual measurements. You do know that your plot came from models don’t you? The fact that the models don’t work has been proved and, on top of that, their error bounds are obviously made up. You do know that, don’t you?
Did you even look at your second plot? OMG, the error in aerosol forcing is much bigger than the value. Did you read the warning about how the error might be larger over “certain time periods”? It’s dead obvious that the plot you referenced was made up from models disconnected from reality. On top of that, the admitted errors are HUGE (actual errors are certainly larger), but yet the plot still fooled you. What does that make you, Bantam weight?
Where are you getting 1.21 W/m2 for the forcing of CO2? And where where are getting that it must be strictly less than this figure?
Yet the trend is cooling which contradicts your first two sentences.
Basic physics do you mean models 😜
You are assuming that CO2 plays a measurable role in global temperatures.
Despite decades of data churning, no such evidence has been found.
It does.
https://wattsupwiththat.com/2021/09/21/the-greenhouse-effect-a-summary-of-wijngaarden-and-happer/
According to some of those graphs the “new cold period” started in 2006. Since then UAH shows warming at the rate of 0.26 ± 0.21 C / decade.
Decreasing warming sounds right.
Decreasing warming…. sounds very much like… cooling
What do you mean by decreasing warming? The UAH warming rate since 2006 is twice that of the overall rate.
I’m not saying this is in any way meaningful, but it certainly doesn’t show decreased warming.
The current graph of the UAH Global Lower Atmosphere, and looking at the 13-month average, shows +.2 for 2010 and +.2 for 2021.
Maybe I’ve missed something, but that is not very scary.
So, 0.05 C/decade is a distinct possibility. Got it, thanks!
The same possibility as it being 0.47 C/decade. What it isn’t is a new cold period.
Let’s see where we are after this upcoming Northern Hemisphere winter. If we have a La Niña as forecast, the source of the warmer waters north of the tropical Pacific is gone and that area will slowly cool. The north Atlantic also could come out of the winter cooler than it currently is. The wildcard is volcanic activity, which is on the rise after being pretty quiet over the past decades. A Pinatubo like eruption into an already cooling Earth could be a really big long term deal.
One thing is we have definitely shifted electrically. The Earth’s magnetic field is fading and the pole positions are on the move. The Sun came through a low solar cycle and as pointed out by the article, cosmic rays/neutron counts are higher. The Earth’s thermosphere is classified as cold. Snow levels have been higher than average the past year and looks like it has an early start. We’ve had late spring frosts and last winter had arctic air spilling pretty far south.
Forecasts I’ve seen are for an early start to the NH winter, but we shall see. It definitely will take time for the ocean heat to radiate out to space that has accumulated the past decades, but we might be surprised come next May just where we stand on how cold it is. I for one am pretty sure there is going to be a lot of pain for a lot of people suffering through a very cold winter without power and possibly food. I’m not so worried where I live but the poor planning and misdirected investments in power generation in a lot of areas just might bite a lot of people in the butt.
And speaking of snow, here is the Barrow Alaska albedo chart. A little early start:
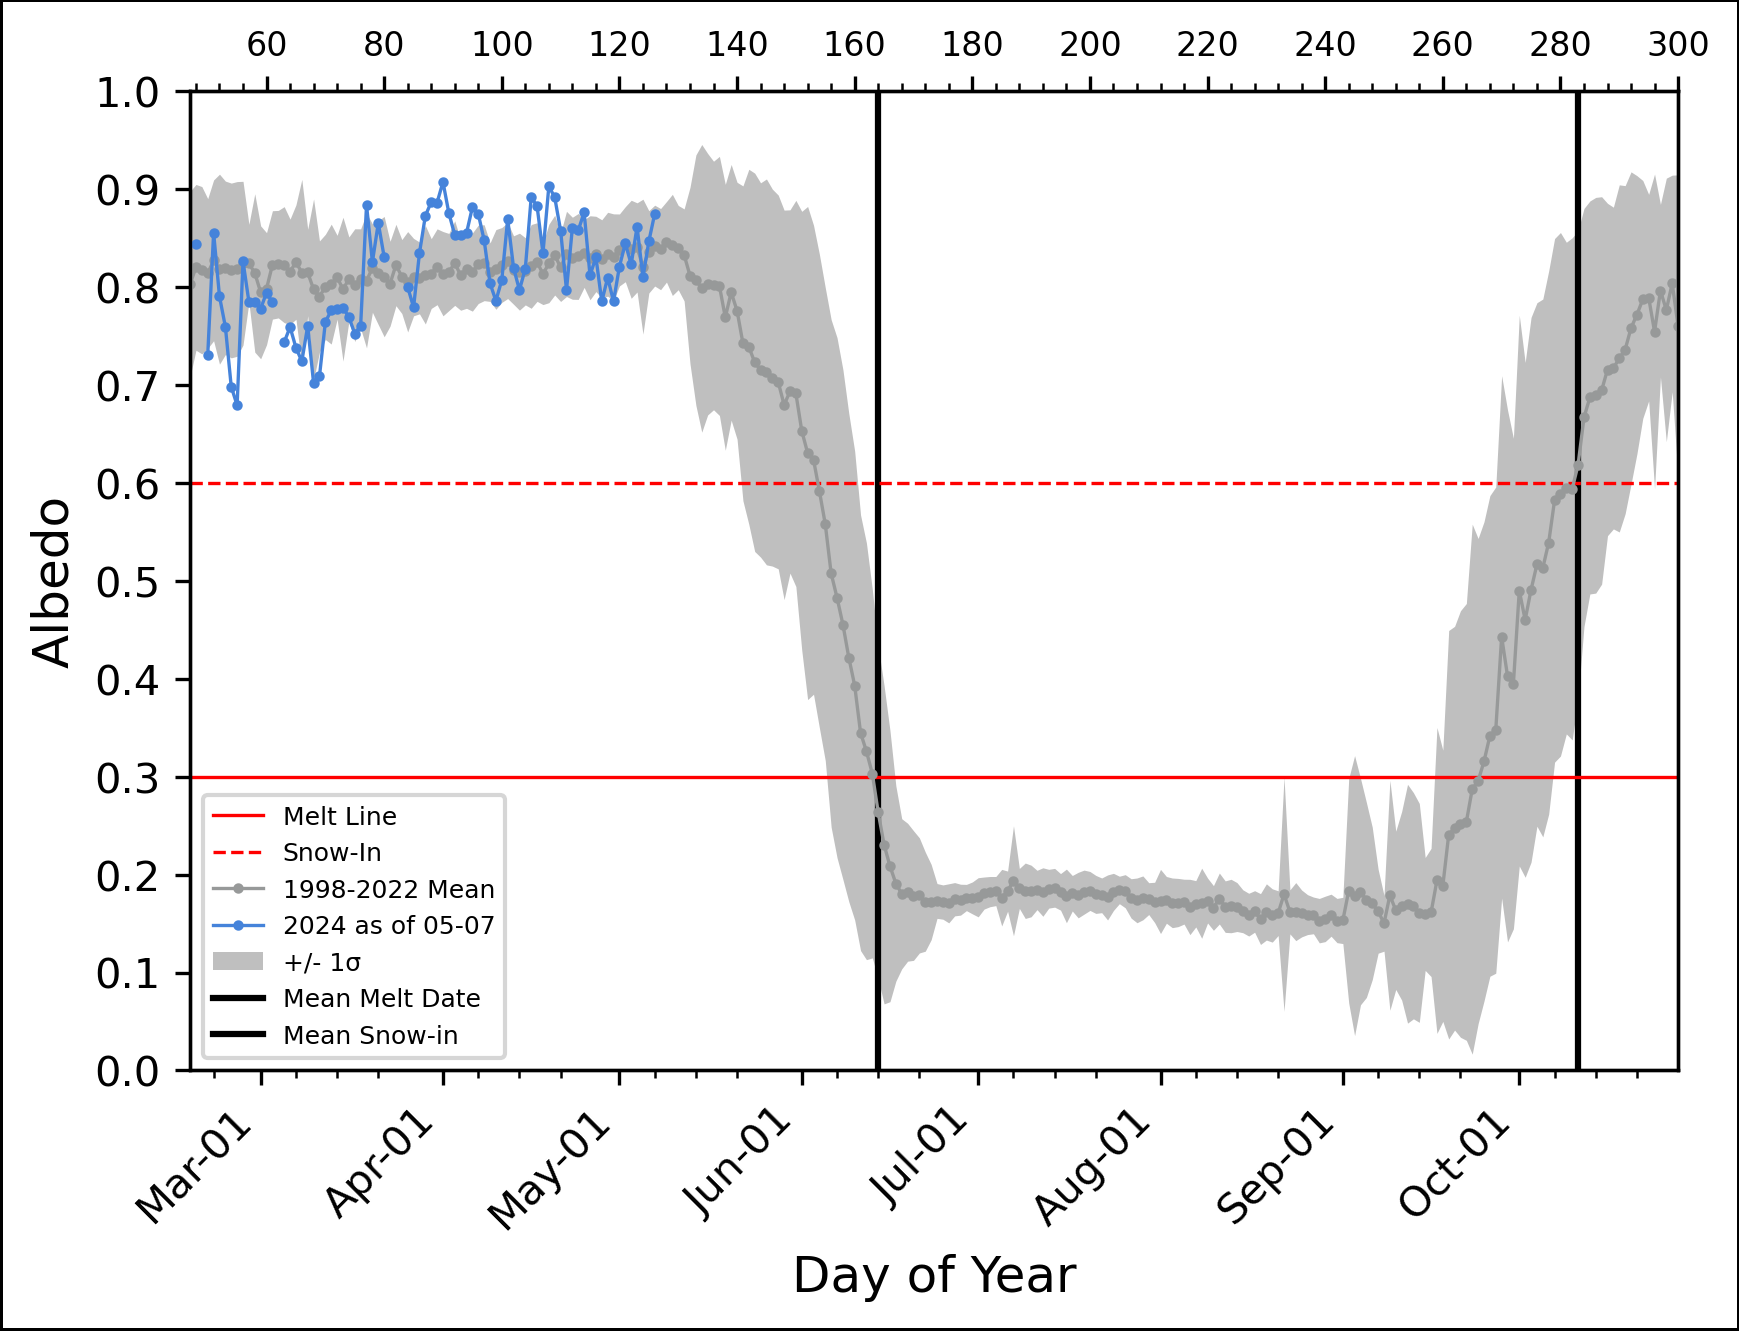
Interesting graph…but where from ?…..Albedo being a hundred times or so more of a significant factor for surface temperatures than alpha/neutron ratios.
Right click on the graph and “open in new window” will give you the full url. WordPress will render the png image rather than show the url and make you click on it.
without the https: gml.noaa.gov/webdata/grad/snowmelt/BRWWebAlbedo.png
Try this:
ESRL Global Monitoring Laboratory – Global Radiation and Aerosols (noaa.gov)
Joe Bastardi has suggested a cold Northern Hemisphere winter following an active storm season in the North Atlantic Ocean. Currently there are 4 disturbances showing on the NHC-NOAA map. There are just four names left on the 2021 list.
There has been considerable energy carried northward that was/is being radiated to space. It is time to harvest firewood for the coming winter.
Nice chart, thanks.
The upward movement started the same date as the Arctic sea ice minimum, see comment above.
Now overlay the CO2 annual cycle from Hawaii and see the start downward trend in May and the same end date.
I am not suggesting that the CO2 variation controls anything, only pointing out the cycle timing.
Do any reputable weather forecasters use the Earth’s magnetic field in their weather models? If not, why should the magnetic field have any impact on climate?
When the Earth has a weaker magnetic field more plasma ejected from the Sun interacts with our atmosphere, and we are talking a lot of energy that normally would be deflected being absorbed. Already we are seeing increased lightning across the globe for example.
Everyone keeps saying TSI doesn’t change that much as the Sun goes through it’s sunspot cycle, but a lot of atmospheric scientists are realizing particles hitting the Earth have a substantial impact on the weather and climate.
deleted because I replied to wrong comment.
I actually think it is too easy to see patterns, or trends where none really exist (canals of Mars). Eyeballing the graphs and fitting bounds to indicate a trend is pretty much cherry-picking data, though I do not dismiss the possibility, I would want to see far more robust evidence. The warmists mangle (homogenise) data, but I suspect that if this winter is physically a bit cold, reality could hit some people – especially given the fuel issues in the UK and Europe.
Thanks David. It’s great to see this collection of updated solar info in one place.
A technical question – aerosol nucleation requires charged particles, likely protons from Solar neutrons that have decayed in-flight. Does the Oulu system measure then secondary neutrons from high-atmosphere proton scattering?
Aerosol nucleation and water vapor crystallization can take place on solid particles. This confounds any correlation with high-energy nuclear transients. That is, dust storms, volcanic eruptions, oceanic salt particle, or drought conditions can swamp the noise of nuclear particles.
Free neutrons are unstable hence temporary. Half life is a little more than 10 minutes. It leaves behind a proton, an electron and an antineutrino. All energetic.
The short life of a neutron | ORNL
prior to decay, neutrons could possibly interact with other nuclei.
Though fleeting, all these processes could cause nucleation. Bubble chambers have been used to spot them.
From a metrology POV, it is not possible to reliably discern tiny changes (0.01°C) from air temperature measurement data, regardless of how much averaging is involved.
And as many have pointed out in the past, the so-called global average temperature is a meaningless quantity.
Carlo, Monte: “And as many have pointed out in the past, the so-called global average temperature is a meaningless quantity.”
If we could somehow send Dr. Spencer and his satellite network back in time into the depths of the last ice age 25,000 years ago, and then if we could somehow bring that data back to the present in order to compare the ice age satellite data with today’s satellite data — how would we go about summarizing the differences in temperature between then and now into a commonly understood shorthand metric?
Johnny Carson: “The earth was a lot colder twenty-five thousand years ago.”
Ed McMahon: “How cold was it?”
Johnny Carson: “So cold that it took three reindeer skins to make a summertime swimsuit.”
Data, data, data!
Presented short and simple . . . even though Earth’s climate-to-Sun coupling is massively complex, with all of its ups and downs, both figuratively and literally.
Thank you 1E6, David Archibald, for this thought-provoking presentation of data!
Life is good today.
Nenana ice breakup date seems to show continuing warming ???
https://pbs.twimg.com/media/E0gLcxUXMAkbeLG?format=png&name=medium
On the other hand, the Antarctic has been cooling.
The atmosphere had been warming at 0.013°C per annum according to Dr Roy Spencer’s work.
No, the lower troposphere is what Spencer’s UAH satellite data measures… The results are not comparable to surface temperature records or models. The RSS data set shows warming above what UAH gets from the data.
Spencer’s work does NOT show there’s a cooling trend.
From observed surface temperatures, the planet is clearly warming.
Griff, i don’t know what the climate is doing right now.
Neither do you.
Only one of us is smart enough or honest enough to admit it.
I do agree that your scientific credentials in “hand waving” is very well used on this site and on this subject.
One hand clapping
The sound of one hand clapping: silence!
So I ask again, why are you afraid of some warming? Warmer is better.
I think the point of all this is that the science is not settled.
Indeed, if the ongoing series of cooling trends happening since the 80s continues the planet should reach ice age conditions any day now:
Nice cherry picking.
No it can’t be cherry picking. All I’ve done is to comb through the data to find periods with negative trends and highlighted those while ignoring the underlying long term warming trend and used those periods to claim that the planet is cooling. That can’t be cherry picking.
All of your trend lines start at a high spot and end in a low spot. Your claim is worthless as a result.
Well yes, I did it that way on purpose, so we could identify all the cooling going on to show that the earth is plunging into ice age conditions. The last six years are just another in a long line of cooling periods.
The steps up are all associated with Super Los Niños, in between the downward trends following them.
Right, “global warming” is nothing more than a series of cooling trends that keep starting at a higher point.
You’re getting it!
Simply remove the warming years and hey presto! No warming!
(Remind me what the ‘O’ in ENSO stands for?)
Yes, the higher points that keep starting with El Ninos.
Now, tell everyone your theory about how El Ninos are caused by human released CO2 and by golly you could win a prize.
Exactly, just good old fashioned El Nino peaks getting warmer and warmer over time with no underlying driver. I’m glad you understand how the data works.
Exactly what? You ignored telling us your theory about how increasing CO2 in the atmosphere causes larger El Ninos in ocean water.
I’m all ears so go for it.
The greenhouse effect does not cause the El Nino/La Nina oscillation. El Nino is a part of natural variability consisting of a periodic upwelling of warm water in the eastern tropical Pacific Ocean. It affects weather patterns and temporarily increases the sea surface temperatures and hence global surface temperature. The cool phase of the oscillation is named La Nina. Over time the warm and cool phases broadly cancel out.
This cycle just moves heat around the climate system, unlike the enhanced greenhouse effect which is causing an increased amount of heat to be retained.
This is why, on average, each El Nino temperature spike tends to be warmer than the last.
So, using your explanation, all one needs to do to measure the enhanced greenhouse effect is to subtract the El Nino spikes from each other and voila, there it is.
Strange that no one has ever done this and written a paper about it isn’t it? Also strange that no one can predict when El Ninos will occur or their magnitude since your claims that its a cycle should make that easy.
Correct.
How else would expect the GMST (sorry not surface – lower atmosphere – which responds to EN WV in an anomalous manner) to behave?
Given that ENs Have/do and always will cause a spike in atmospheric temperature in response.
Consequently the periods in between turn into Monckton “pauses”, which as now are often at a higher temperature than the extrapolated LT trend (see my reposted Monckton graphs above).
Exactly. By definition El Nino does not add any net heat energy to the climate system, any more than La Nina removes any. They just move it around the oceans. Over time they tend to cancel, although if these oscillations were superimposed upon an externally-forced gradual warming trend, then there would, on average, be a tendency for each El Nino peak to be slightly higher than the last.
Which is what we observe.
Three small decreases add up to one big increase – that’s some brilliant mathematics babe
That’s just the data. Clearly the planet is cooling because I never plotted anything but cooling trends.
Obviously. And when you stitch those 4 cooling trends end-to-end you get like maybe -0.6C of cooling there. Maybe Easterbrook was right afterall?
No scientist loves the camera or limelight more than Michael Mann.
But why can’t analysis such as this be reported in the MSM? There has to be a few reporters in the MSM that are not completely closed minded.
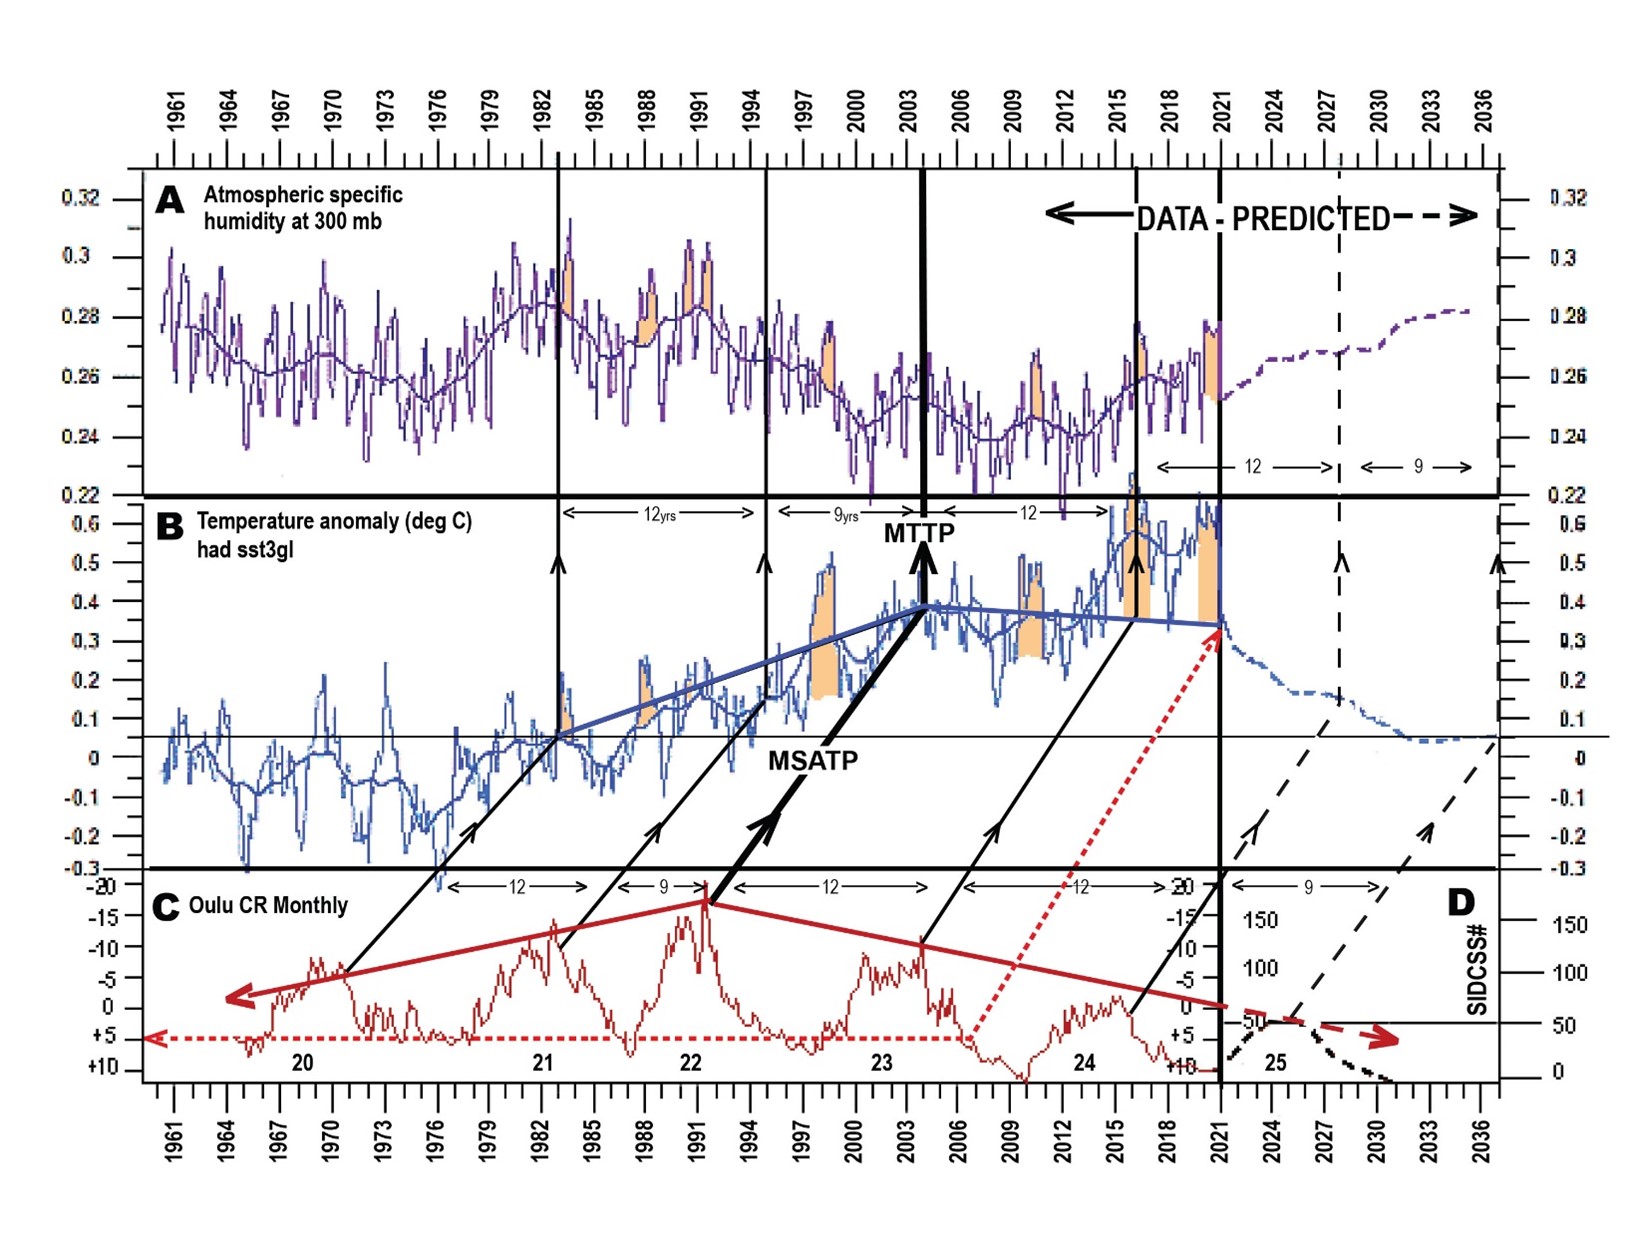
Here is part of the Abstract , and Fig 5 and some quotes from my paper “Net Zero threatens Sustainable Development Goals ” https://climatesense-norpag.blogspot.com
“Abstract
This paper begins by reviewing the relationship between CO2 and Millennial temperature cycles. CO2 levels follow temperature changes. CO2 is the dependent variable and there is no calculable consistent relationship between the two. The uncertainties and wide range of out-comes of model calculations of climate radiative forcing arise from the improbable basic assumption that anthropogenic CO2 is the major controller of global temperatures. Earth’s climate is the result of resonances and beats between the phases of cyclic processes of varying wavelengths and amplitudes. At all scales, including the scale of the solar planetary system, sub-sets of oscillating systems develop synchronous behaviors which then produce changing patterns of periodicities in time and space in the emergent data. Solar activity as represented by the Oulu cosmic ray count is here correlated with the Hadsst3 temperatures and is the main driver of global temperatures at Millennial scales. The Millennial pattern is projected forwards to 2037. Earth has just passed the peak of a Millennial cycle and will generally cool until 2680 – 2700…………….”
Fig 5 Correlation of the last 5 Oulu neutron cycles and trends with the Hadsst3 temperature trends and the 300 mb Specific Humidity. (28,29)
The Oulu CR data shows the decrease in solar activity since the 1991/92 Millennial Solar Activity Turning Point and peak There is a significant drop to a lower solar activity base level post 2007+/-.There is a new solar activity minimum at 2009. As in Fig.4 the MSATP at 1991 correlates with the MTTP at 2003/4 with a 12/13 +/- year delay. Short term temperature spikes are colored orange and are closely correlated to El Ninos.
Temperature Predictions
Loeb et al 2018 in “Changes in Earths Energy budget during and after the “Pause” in Global Warming”(30) provided an important observational database from 1998 – 2018.This
showed that a reduction in global mean reflected short wave top of atmosphere flux in the three years following the hiatus resulted from decreased low cloud cover which added to the 2016 El Nino temperature spike.
Figure 5 also predicts SST3gl and Specific Humidity trends from 2022 – 2037. (Blue and Purple dashed lines) The secular change in the Solar Activity to a lower base level after 2007 projects to 2021. The SST3gl general decline trend from 2021 to 2037 is here projected as the reverse of the increase from 1983 – 2004 with the cycle 24 peak projected at 2028 and the cycle 25 peak at 2037.
Kitiashvili,I 2020 (31) estimated that Solar Cycle 25 will start after the 2020 solar minimum and will be weaker than Cycle 24.The maximum of Cycle 25 solar activity should be in 2024/25 with a sunspot number of about 50 +/- 15. The correlative HadSST3gl anomaly is 0.05C. in 2037.The intervening solar activity minimum would be at 2031 …………………………..
Most importantly the models make the fundamental error of ignoring the very probable long- term decline in solar activity and temperature following the Millennial Solar Activity Turning Point and activity peak which was reached in 1990/91 as shown in Figure 5. The correlative UAH 6.0 satellite TLT anomaly at the MTTP at 2003/12 was + 0.26C. The temperature anomaly at 2021/8 was + 0.18 C. (34) This satellite data set shows that there has been no net global warming for the last 17 years. As shown above, these Renewable Energy Targets in turn are based on model forecast outcomes which now appear highly improbable. Science, Vol 373,issue 6554 July2021 in”Climate panel confronts implausibly hot models” (35) says “Many of the world’s leading models are now projecting warming rates that most scientists, including the modelmakers themselves, believe are implausibly fast. In advance of the U.N. report, scientists have scrambled to understand what went wrong and how to turn the models…… into useful guidance for policymakers. “It’s become clear over the last year or so that we can’t avoid this,” says Gavin Schmidt, director of NASA’s Goddard Institute for Space Studies.”
The global temperature cooling trends from 2003/4 – 2704 are likely to be broadly similar to those seen from 996 – 1700+/- in Figure 2. From time to time the jet stream will swing more sharply North – South. Local weather in the Northern Hemisphere in particular will be generally more variable with, in summers occasional more northerly extreme heat waves droughts and floods and in winter more southerly unusually cold snaps and late spring frosts.”
The latest data indicate a high probability of another Texas freeze up in March/April 2022.
I will need more than 6 years before I declare a trend…If indeed there is a cooling trend we should know for certain in 5-plus years. Until then it’s just an interesting possibility.
I would not be surprised if it disappears completely – not in reality but in the data sets as they are managed for “quality”.
See the 12:10pm comment above.
“Most importantly the models make the fundamental error of ignoring the very probable long- term decline in solar activity and temperature following the Millennial Solar Activity Turning Point and activity peak which was reached in 1990/91 as shown in Figure 5. The correlative UAH 6.0 satellite TLT anomaly at the MTTP at 2003/12 was + 0.26C. The temperature anomaly at 2021/8 was + 0.18 C. (34) This satellite data set shows that there has been no net global warming for the last 17 years. “
Just because there happened to be a higher monthly anomaly in Dec 2003 than there was in August 2021 doesn’t mean there has been no warming in between. It’s not like you can just deduct one from the other and disregard everything else. Surely no one is still falling for this?
The warming trend in UAH since December 2003 is +0.21C per decade.
“Our planet’s temperature peaked in 2016 and has been in a disciplined decline since. It is in a channel 0.5°C wide with a slope of -0.03°C per annum. The atmosphere had been warming at 0.013°C per annum according to Dr Roy Spencer’s work. If the established cooling trend continues it will only take another decade to get back to the temperatures of the early 1980s. With the cooling trend firmly established…“
Technically there is a cooling trend of about 5 years but we saw the same “cooling trend” after the 1998 El Niño for many more years until it suddenly and dramatically ended with the 2016 El Niño. And we have seen even larger cooling trends over longer periods in the 20th century but the long term trend over the last century based on meteorological station data is modest global warming. And the 40 year trend from satellite observations since 1979 is also warming. See Dr. Roy Spencer’s UAH dataset. There’s always a chance that 2016 was the peak of a long warming trend and everything will be cooler from here on out but I wouldn’t bet on it.
We should be very thankful for the warmth we’ve enjoyed since the last glacial period because humans don’t do well in the cold – and the earth’s normal state, over the last 2 million years, is glacial.
The relationship between climate parameters and the Earth’s magnetic field has been described by many authors. However, the lack of a viable mechanism to explain this relationship has hindered progress in this field of research. Based on instrumental observations, we reveal a spatial-temporal correlation between key geomagnetic field structures, Earth’s surface air temperature and pressure fields, ozone, and specific humidity near the tropopause. We propose the following chain of causal relationships as one plausible explanation for these correlations: (1) modulation of the intensity and depth of penetration of energetic particles (galactic cosmic rays (GCRs)) in the Earth’s atmosphere by the geomagnetic field; (2) perturbation of ozone density near the tropopause under the influence of GCRs; (3) temperature change near the tropopause due to the high absorption capacity of ozone; (4) the adjustment of the static stability of the extratropical upper troposphere, and consequently the specific humidity, to the modified tropopause temperature; and (5) the change of the surface air temperature due to the increase/decrease of the water vapor greenhouse effect.
https://www.researchgate.net/publication/281441974_Geomagnetic_Field_and_Climate_Causal_Relations_with_Some_Atmospheric_Variables
Due to a clear downward trend in the strength of the solar magnetic field, which may continue for decades, a change in past weather patterns is to be expected. This is due to the strong ionization of the lower stratosphere due to the increase in galactic radiation and the decrease in ozone production in the upper stratosphere. North America will be subject to greater circulation changes in winter as the geomagnetic field over North (and South) America weakens.
http://wso.stanford.edu/gifs/Polar.gif
http://wso.stanford.edu/gifs/DipallR.gif
The sun is no random walk – 40 years of disciplined decline.
The temperature in the upper stratosphere below the -60th parallel is very low.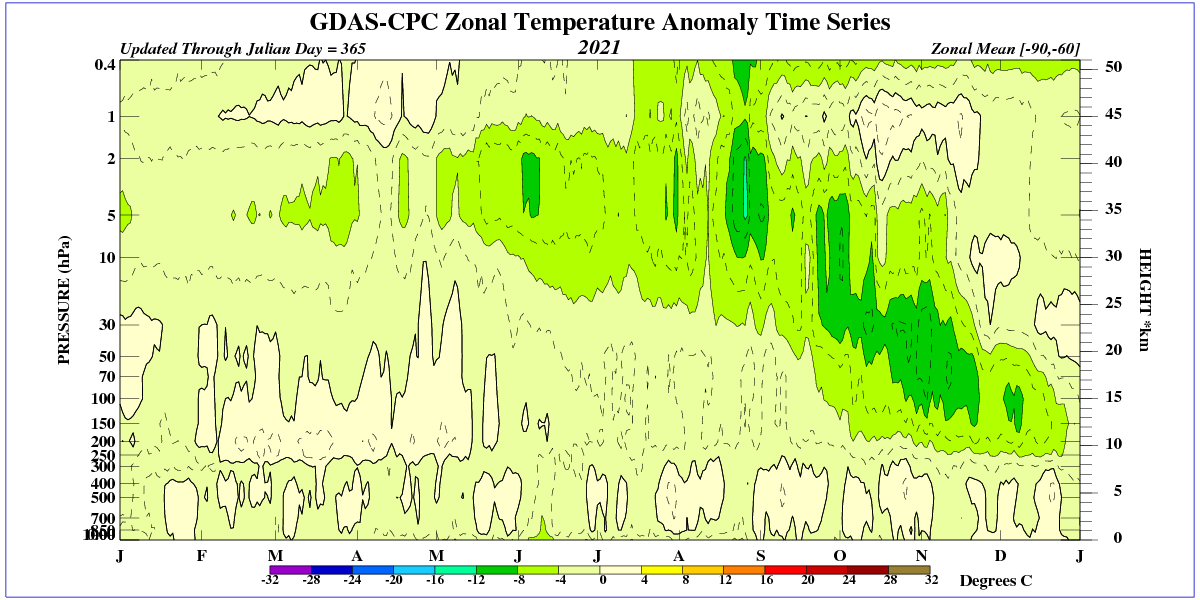
“Data from the Sentinel-5P satellite were used to show that last year’s ozone hole over Antarctica was one of the largest and deepest in recent years. The hole grew rapidly from mid-August and peaked at about 25 million km2 on October 2. The large ozone hole was caused by a strong, stable and cold polar vortex that kept the temperature of the ozone layer over Antarctica at a constant low level. This was in stark contrast to the extremely small ozone hole that formed in 2019.
This year, the evolution of the ozone hole appears to be similar to last year’s size, now about 23 million km2 – reaching a range larger than Antarctica. According to CAMS, the 2021 ozone hole has grown significantly over the past two weeks and is now larger than 75% of ozone holes at this stage of the season since 1979.”
https://www.esa.int/Applications/Observing_the_Earth/Copernicus/Sentinel-5P/What_s_going_on_with_the_ozone
However, changes in ozone due to weak solar wind (GCR) are taking place in the lower stratosphere and tropopause, and thus at the level of the jet stream.
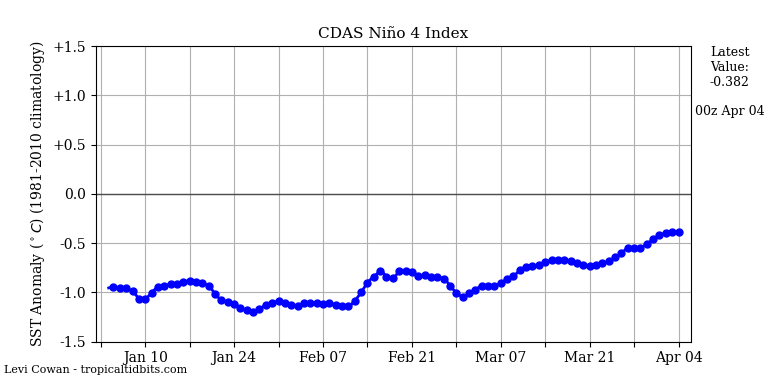
The southern stratospheric polar vortex is now strong, allowing La Niña to expand.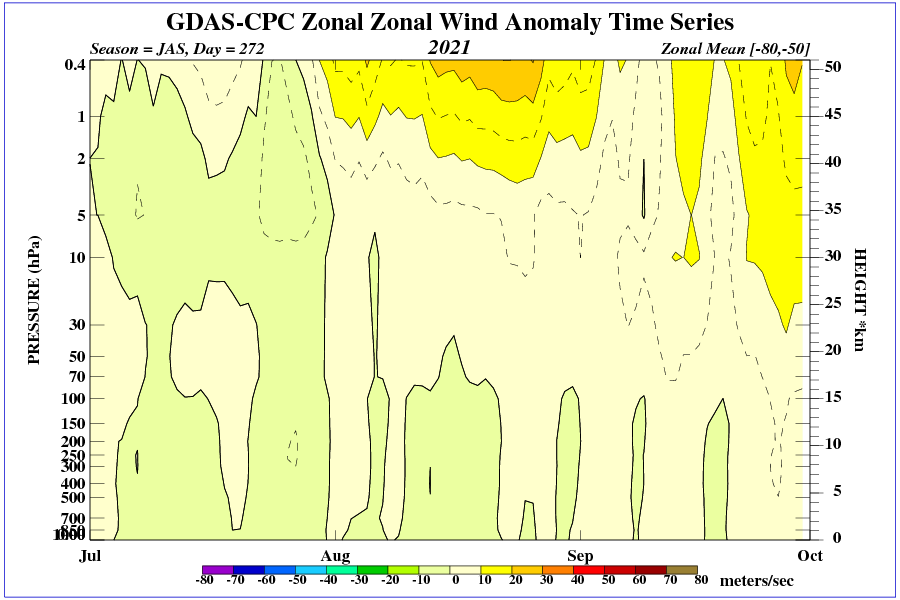
It came from the direction of the sun. Those words might sound chilling to you. And they do, too – perhaps more so – to scientists who work to detect near-Earth asteroids, in an effort to keep our planet safe. The Chelyabinsk meteor that did so much damage and caused so much consternation in 2013 also came, unexpectedly, from the sun’s direction. The fact is that astronomers have become very good at detecting near-Earth asteroids. And there are programs in place to watch for them. Some observatories constantly take images of the night skies in search for new asteroids. And astronomers feel they have a good handle on all the potentially damaging asteroids out there … except those that might come to us from the sun’s direction.
https://earthsky.org/space/asteroid-2021-sg-closest-to-earth-sep21-2021/