By Andy May
This post was updated 9/24/2021 to reflect reader comments.
The phrase “greenhouse effect,” often abbreviated as “GHE,” is very ambiguous. It applies to Earth’s surface temperature, and has never been observed or measured, only modeled. To make matters worse, it has numerous possible components, and the relative contributions of the possible components are unknown. Basic physics suggests that Earth’s surface is warmer than it would be with a transparent atmosphere, that is no greenhouse gases (GHGs), clouds, or oceans. If we assume Earth is a blackbody, then subtract the solar energy reflected, from the hypothetically non-existent clouds, atmosphere, land, ice, and oceans; we can calculate a surface temperature of 254K or -19°C. The actual average temperature today is about 288.7K or roughly 15.5°C. This modeled difference of 35°C is often called the overall greenhouse effect.
A blackbody is usually defined as a perfectly black cavity kept at a constant temperature. All energy that enters the cavity is absorbed by the cavity walls, and they emit exactly the same amount of energy, but the wavelength of the emitted radiation is not the same as the energy captured. Instead, the emitted radiation has a wavelength determined by the cavity temperature, which is held constant. The Earth is nothing like this. It isn’t black and both the atmosphere and the oceans absorb and redistribute solar energy, often the absorbed energy is circulated for a long time, even centuries or millennia, before it is reemitted. A blackbody absorbs and reemits energy with a delay of less than a second. Earth’s surface temperature is not constant, like a blackbody’s temperature, it varies a lot by latitude, altitude, season, and/or ocean depth. The Moon has a calculated blackbody temperature of 270K, no atmosphere or oceans, and an average temperature, at the equator and low latitudes, of around 215K, so even the Moon is not an ideal blackbody.
Some unknown portion of the overall GHE is probably due to atmospheric greenhouse gases (GHGs). These include, CO2, H2O, CH4, N2O, and O3. Dr. William Wijngaarden and Dr. Will Happer examine the likely influence of these greenhouse gases using the HITRAN line-by-line molecular transmission and absorption database maintained at Harvard University (Wijngaarden & Happer, 2020). We discuss Wijngaarden and Happer’s important paper in this post and refer to it as W&H. HITRAN stands for high-resolution transmission molecular absorption. The database compiles spectroscopic parameters that computer programmers can use to model the transmission and emission of light in the atmosphere. W&H use the database to model a hypothetical mid-latitude temperature and GHG atmospheric profile to derive a representative climate sensitivity to doubling the gases. We have previously written about the GHE and will not cover the same ground in this post, which is mostly about the W&H model.
Dr. Clive Best also studied the HITRAN database, but just for CO2 (Best, 2013). Best also investigated the effect of gravity or air pressure on Earth’s surface temperature and concluded that they must contribute something to the overall greenhouse effect but was unable to model the amount. According to the second law of thermodynamics, a thermally isolated atmosphere will reach a constant temperature throughout its height if entropy remains constant. For a closed system that does not exchange heat or work with the surroundings, entropy can only increase. Earth’s atmosphere is not closed, since it is being heated by the Sun and losing heat by radiating to space.
Also, gravity does positive and negative work on the atmosphere, it does positive work on air parcels that sink. The work causes their temperature to rise and it can cause their entropy to reduce. But, since reducing entropy means taking heat out of the system, a cooling effect, which is stronger? This constant battle of contradictory forces keeps the entropy per kilogram of air approximately constant in the troposphere. The entropy of the stratosphere increases with altitude due to warming by ozone and stronger ultraviolet radiation than the troposphere receives. As temperature increases, entropy increases and radiation emissions from the GHGs increase. The overall proportions of surface warming due to GHGs, and gravity-induced warming, if any, remains unknown.
As far as recent—past 120 years or so—warming is concerned, gravity has not changed. However, the CO2 added to the atmosphere has increased the surface pressure slightly, since CO2 is 50% denser than dry air. Measurements suggest that the total water vapor in the atmosphere has decreased slightly, but these measurements are disputed due to the quality of the instruments used. Water vapor is 40% less dense than dry air, so how much the surface air pressure has changed due to differences in these two important molecules is unknown.
In this post we will ignore the effects of gravity and surface air pressure, even though gravity causes the Sun to fuse hydrogen into helium and emit the sunlight that warms our planet. Trying to figure out how much gravity contributes to the overall GHE, and recent warming only gives me a headache, and it creates furious arguments in the comments. The reason for the furious arguments, and my headaches, is that it is a complicated thermodynamic argument, and no one really understands thermodynamics. So, we just acknowledge it must have some effect on the total GHE and leave it at that.
Gravity has no direct effect on radiation transfer, but since gravity determines how the air pressure changes with altitude, there is an indirect effect because the air pressure influences the density of greenhouse-gas molecules. Thus, it also has a large effect on their total capture cross sections that contribute to the opacity of the atmosphere. For cloud-free air, the radiation flux is determined by only two quantities, how the opacity of the atmosphere varies with altitude and how the temperature varies with altitude. W&H took the altitude profiles of both temperature and opacity from experimental observations. The HITRAN data is based on observations. It is not theoretical data.
Because Earth’s atmosphere is transparent to most solar radiation and the Earth’s surface is opaque, the surface absorbs twice as much radiation as the atmosphere. Per the laws of thermodynamics, a planet tries to emit as much radiation as it receives. If Earth emits more, it cools; if it emits less, it warms. The global average temperature of Earth varies about three degrees every year, it is just over 12 degrees in January and just under 16 degrees in July. The Earth’s temperature controls the type of radiation it emits, and it emits mostly in the thermal infrared. The range of emitted frequencies, plotted as wavenumbers, with units of 1/cm, are shown in Figure 1.

The frequency and the power emitted by molecules are determined largely by the molecule’s kinetic temperature. In Figure 1, if the atmosphere is transparent and contains no infrared absorbing molecules, like CO2, the 288.7K emission spectrum would look like the blue curve. The y axis in Figure 1 is the spectral flux, or the amount of energy passing through the top of the atmosphere per unit frequency, in this case frequency is expressed as a wavenumber, or the number of waves per cm. Mathematically, ѵ (frequency) is the inverse of the wavelength.
A perfectly transparent atmosphere would radiate all surface emitted energy according to the blue line in Figure 1. All the curves plotted overlay in the atmospheric window (“Atm window”) from 824 to 975 cm-1. In this window the surface radiation can go straight to space, so it is labeled 0 km. This means the emission temperature (as determined from the spectral flux) reflects the modeled surface temperature of 288.7K or 15.5°C. Other example departures from the ideal Planck brightness blue curve, are labeled with the approximate altitude of the emissions, based on their brightness temperature. At these locations the atmosphere below these altitudes can be considered opaque to surface radiation due to the combination of GHGs modeled.
The green curve is the computed spectrum with all the greenhouses gases present, in their current concentrations, except for CO2. The black and red lines are the computed energy flux for CO2 concentrations of 400 ppm and 800 ppm respectively. The area difference between the green line and the black line is representative of the CO2-caused warming from zero CO2 to today’s concentration of 400 ppm. The area difference between 400 and 800 ppm, is much smaller and will result in much less warming.
The marked altitude of 84.8 km, in the middle of the CO2 caused divot in the energy curve, means that the emissions at that frequency range, roughly 609 to 800 cm-1, come from that altitude. Below that altitude, CO2 blocks the radiation at those frequencies. In this critical CO2 region of the spectrum, CO2 is saturated and cannot block anymore radiation. 84.8 km is nearly the top of the atmosphere, very high in the mesosphere. Additional CO2 makes the divot a little wider though, as the red curve illustrates and the widening causes a bit more radiation at the edges of the enlarged divot to be blocked.
As CO2 doubles from today’s concentration, the radiation emission level moves upward at all altitudes. As it moves upward in the troposphere, if cloud cover does not change, the emission temperature decreases, and the amount of energy emitted decreases. Since less energy is emitted to space, Earth’s surface should warm. When the sky is clear, radiation fluxes can be calculated accurately, but the conversion to a temperature change can get complicated. Emission height is strongly dependent upon frequency, as Figure 1 shows, and an average emission height has little meaning, just as a global average temperature has little practical meaning.
But at higher altitudes, in the middle stratosphere, temperature begins to warm with altitude. The warming is due to an increase in ozone (O3) as shown by the dotted red line in the right-hand graph of Figure 2. The increase in unattenuated solar ultraviolet light with altitude also has a warming effect. This means as the emission moves higher, more energy is emitted. This results in cooling, and we see this effect at the bottom of the CO2 divot in Figure 1. The red and the black curves reverse their positions and adding CO2 causes cooling. The reason why is illustrated in Figure 2.

The left graph in Figure 2 shows the atmospheric temperature profile used for the W&H model. In the real world, the temperature profile varies a lot from location to location and with time, especially in the troposphere, but W&H use a single set of values that are representative of the “standard atmosphere” in the mid-latitudes for their model.
There is very little H2O above the tropopause and N2O and CH4, already minor greenhouse gases in the troposphere, also decrease. In the stratosphere ozone (O3) warming is dominant and temperature increases, until the mesosphere is reached where ozone decreases rapidly and CO2 cooling begins to dominate. At the top of the mesosphere, roughly 86 km, changes in the energy flux are negligible, so W&H call this the top of the atmosphere or TOA.
Convection is minimal above the tropopause, but in the troposphere, it provides about half of the total heat transfer from the surface to the tropopause. As Figure 1 shows, except for the atmospheric window, the lower troposphere (below 2.8 km) is opaque to Earth’s OLR, or outgoing longwave (infrared) radiation, except in the IR window. The evaporation of water transports much of the surface emitted thermal energy, as latent heat, to higher altitudes where it can be radiated away from Earth. Thermal energy emissions, released from condensing water vapor, begin to appear at the base of low-level clouds, and continue throughout the cloud. Clouds are a very important component of Earth’s cooling system but cannot currently be modeled, so they are not included in the W&H model.
Clouds are included in the IPCC general circulation models (GCMs), but the IPCC assumes the cloud parameters and impact, they cannot calculate them. The IPCC AR6 report acknowledges that “clouds remain the largest contribution to overall uncertainty in climate feedbacks (high confidence).” (IPCC, 2021, pp. TS-59). While researchers are trying to model clouds, we share their high confidence that clouds are the largest source of uncertainty in computing the impact of humans on climate change.
The W&H emissions model is a clear sky model and only accurate above the clouds and in areas where there are few clouds, such as the poles and over deserts. Clouds excluded, W&H do try and account for GHG warming feedbacks. They investigated three cases, fixed relative humidity with a constant tropospheric lapse rate, fixed relative humidity with a variable lapse rate, and fixed absolute humidity. The resulting climate sensitivity values are shown in Table 1.

W&H also compared their resulting emissions calculations for three specific areas, the Sahara Desert, the Mediterranean and Antarctica. The comparison is shown in Figure 3.

The intensity values plotted in Figure 3 are different than the spectral flux values given in Figure 1 by 1/pi. The spectral flux values are energy passing an elevation in all directions, the values in Figure 3 are for brightness or intensity measured by a satellite. The difference is just in the units, they both measure emissions from Earth. The red Planck brightness curves in the left graphs are characteristic surface temperatures for the locations indicated, 320K (47°C) for the Sahara Desert, 288.7K (15.5°C) for the Mediterranean, and 190K (-83°C) for Antarctica. Notice the CO2 and H2O emission temperatures in Antarctica are warmer than the surface in the atmospheric window, this means the air above the ground is warmer than the ground and that the GHGs are cooling, not warming the air.
Summary and Conclusions
In summary, W&H have provided us with a detailed and accurate emissions model that shows only modest warming (2.2 to 2.3°C), inclusive of likely water vapor feedback, but not counting the feedback due to cloudiness changes. Both the magnitude and sign of net cloud feedback to surface warming are unknown. Lindzen has shown it is likely negative (cooling) in the tropics, but outside the tropics no one knows.
The water vapor feedback to surface warming is also very unclear, Ferenc Miskolczi (2014) has written:
“As long as the Earth has unlimited water supply (in the oceans) with its three phases permanently present in the atmosphere and two phases on the ground surface, the stability of the planetary climate will be controlled by the equations [see paper, page 19]. These two equations, together with the Clausius-Clapeyron equation, will regulate the transfer of the latent heat through the boundary layer in such a way that the net amount maintains the planetary radiative balance.” (Miskolczi, 2014).
Miskolczi, and others have found that total water vapor in the atmosphere has gone down in the past 70 years, although this is questioned. The work by W&M on radiation emissions suggests that future warming due to GHGs will be modest. Speculation about the warming feedback due to clouds and changes in total water vapor is just that, speculation.
The results of the study are summarized in Table 2.

Table 2 shows that the main GHGs are CO2, H2O and O3, doubling the methane or N2O concentration changes the outgoing forcing by less than one percent. Due to the properties of water vapor, its atmospheric concentration is very unlikely to double, but if it did, it would only increase the forcing by eight percent at 11 km. Doubling CO2 only increases the forcing by four percent at 11 km.
The combined current 11 km and 86 km forcing values in the table are not the sum of the individual values due to overlap. It is very clear from this table that all GHGs are saturated and adding to the current concentrations will make very little difference. Doubling CO2 will cause the stratosphere to cool about 10°C, but the changes in surface temperatures from this model are all less than 2.3°C, as shown in Table 1. This is much less than the preferred IPCC AR6 value of 3°C (IPCC, 2021, pp. TS-57). Considering that the current net effect of clouds is cooling and it seems likely that total water vapor in the atmosphere is decreasing or staying flat, these results suggest we have little to worry about regarding increasing GHGs.
Download the bibliography here.
“Convection is minimal above the tropopause, but in the troposphere, it is the dominate means of heat transfer.”
The junk GCM modellers all parameterize (aka use many fudge factors) on all the important properties of convection, convective heat transport and water vapor physics (cloud formation) for a number of important reasons (such as unknowns are high and computation limits).
This model parameterization of water vapor physics is probably why the models cannot realize (or reprodice) an observed, higher-ordered, emergent property of temperature control by our vast tropical oceans via humidity and the evolution of small scale convection into roiling TRW and convective heat transport that arises on model sub-grid scales throughout the tropics and lower sub-tropics. The CMIP modellers all try to parameterize what they think (or want to believe) is happening, and then get (tweak in) an ECS above 3ºC (per expectation) and a massive “fingerprint” of CO2 induced warming prediction as a mid-troposhpheric hotspot in the tropics, The hotspot is a creation of the positive water vapor feed back amplification the modellers want (need) to see in the output. The predicted hotspot is missing in observational records (satellite and radiosonde-ballon data). The models get an F, for fail. Actual science would reject the underlying failed hypothesis of a strong GHE via strong tropical water vapor feedback. But in the climate scam world, a rejection of this is unacceptable, becasue then the scam would collapse.
Yes, the GCMs do incorporate a lot of hard physics such as the radiative transfer equations of a blue sky and Naiver-Stokes equations for viscous fluid flows. But all that hard science is tossed into a slurry of crap parameters, this is like some some real science tossed into a shit cake recipe of fakery and expecting the final cake to taste good.
Bottom line: The GCMs are crap science. They only exist to achieve a political purpose, a purpise which is to promote the climate scam on the public to push us to relinquish our personal freedoms in the name of climate piety.
Just say, “Hell no. *eF* the climate scam.”
With frosting, the cake doesn’t look half bad at first glance. Your explanation of what’s underneath is excellent.
MODS
Our new spammer is at is again!
Are you causing parking problems for your neighbors with your many visitors?
I assume you are implying a significant gender imbalance in said car drivers/visitors?
The way I look at it is that even if one has a perfect model (based on physics), if random fudge factors are introduced, then the output becomes unreliable and unusable! Computational limitations demand that subjective parameterizations be introduced, being effectively equivalent to random fudge factors.
“…GCMs do incorporate a lot of hard physics such as the radiative transfer equations of a blue sky and Naiver-Stokes equations for viscous fluid flows.”
And how viscous are those fluids? I’d say there aren’t a lot of hard physics in the GCMs if these don’t match reality.
One of the most blatant tweaks is the overestimation of aerosol effects. Right down their alley for massive regulation of such, plus gives them excuses for the lack of predicted warming.
Clouds are just another phase of water.
It is atmospheric water that matters not atmospheric water vapour.
The SST is thermostatically limited to -2C at the low end (sea ice) and 32C at the top end (convective instability and cloud persistence).
These thermostatic limits control the energy loss and uptake into the oceans.
Atmospheric water warms the surface in November, December and January but cools the surface for the other 9 months.
The error in the concept of “Greenhouse Gases” is that water exists in the atmosphere as a gas, liquid and solid. Overall atmospheric water provides a net cooling of 1.3W/sq.m. Sea ice provides a net warming.
It is interesting to look at the SST in the Arctic Ocean at the North Pole. It never goes below -2C. And yet there is certain times of the year when there is zero solar input. Simple observation that the sea ice retains the heat.
If there was no atmosphere, the average SST would be 17C. Atmospheric water provides net cooling while sea ice provides net warming. Other atmospheric constituents make up the difference if there is any.
In a few placs, SST exceeds 32 C.
Shallow areas, right? Like the Red Sea and Persian Gulf?
Yes, but the Red Sea is deep, with shoaling at its southern end.
SST would be better named OCEAN Surface Temperature.
Seas can have vast relatively shallow fringes where surface temps in calm periods regularly breach 32C.
The reason sea water does not cool below -2°C is that it is at a phase transition between liquid and solid. If the air is colder than -2°C, more ice forms rather than the existing ice cooling down. If the air is warmer or a warm current of water comes in contact with the ice, it melts rather than warming up. All this happens at -2°C for sea water and 0°C for fresh water. The energy causing the phase change of the ice or water is known as the heat of fusion for a solid/liquid transition. When melting ice, the heat input is converted into the energy required to remove water molecules from the ice crystal lattice and provide the greater kinetic energy and vibrational energy of these molecules as a liquid. Same effect when converting a liquid to a vapor, called the heat of vaporization. This heat per mole or mass is usually larger than its corresponding heat of fusion because the molecules of liquid require more energy to leave the liquid and become a gas. For example, the heat of fusion of water is 333 J/gram and the heat of vaporization at sea level pressure is 2259 J/gram. Water has an extraordinarily large heat of vaporization as compared to most organic compounds on a mass basis.
If a transparent atmosphere were to be static there would be no greenhouse effect. It would be acting like a solid and would become isothermal via conduction from the surface to the top and all radiation would leave from the top at the rate predicted by the S-B equation.
In reality it would not be static due to the operation of differential heating at the surface resulting in density variations in the horizontal plane. That inevitably leads to convective overturning.
Such overturning causes a temperature decline with height due to conversion of surface KE to atmospheric PE as one gains height.
That decline in KE with height sets up the lapse rate slope that governs the rate of convective overturning.
Any disruption of the lapse rate slope caused by ghgs or anything else just results in a change in the rate of overturning which serves to neutralise any warming effect because such a change in rate adjusts the timing of the return of KE energy to the surface beneath falling air so that it can then be instantly emitted to space from the surface.
So, ghgs have an effect on weather but not on temperature and the effect on weather would be far too small to discern from natural variability.
Slight clarification.
Radiation to space would all be from the surface but would leave from the top at exactly the same rate as emitted from the surface.
It follows that if one were to add radiative material to a static transparent atmosphere then the surface would become even warmer but then the upward pressure gradient force becomes greater than the downward force of gravity and the atmosphere will be progressively lost to space.
It is the introduction of convective overturning that enables an atmosphere to be retained regardless of the proportion that is comprised of radiative material because the rate of convection is infinitely variable within limits set by the lapse rate slope.
Sounds reasonable but can you explain an electric kiln? The outside temperature of the kiln is definitely not the same as the elements.
Not comparable.
Of course it is. Energy applied into the interior. The insulation is the ‘atmospheric skin’. Heat lost is from the outer skin of the kiln.
Your theory should be able to be answered in any situations. You can’t explain it so your answer to my question is ‘doesn’t apply’.
I can answer my question to you using your own theory.
I’m not a warmist but I suggest you find a way to explain your theories in such a way that can explain things apart from your own theory.
The insulation in your kiln convects? That’s the oddest kiln I’ve ever heard of. Perhaps that’s why Stephen Wilde stated that it’s not comparable. Go back and read what he wrote for comprehension… he’s right.
There is nothing more misleading in science today than our remaining use of the thermopile to determine our understanding of radiation. It should have gone out the door with its overturning by the Planck solution of ultraviolet catastrophe. Thermopiles and blackbody curves are classical physics; we live in the quantum age, we now have lasers and quantum explanations to the infrared. But these are totally ignored by both sides. If Tyndall had a laser-based Raman spectrometer, the thermopile/ thermoelectric based ‘IR spectroscopy’ compliment, he would have concluded all gases in the atmosphere absorb and emit.
I am currently rewriting my work, I am an amateur and I am slow, but I will get there, and I have experiments that totally refute anything to do with thermopiles. Let’s move on.
Here’s my old work. The Greenhouse Gases and Infrared Radiation Misconceived by Thermoelectric Transducers https://vixra.org/abs/1811.0499
My current experiment: http://www.fractalnomics.com/2021/05/refuting-greenhouse-theory-experiment.html
And my Raman spectrometer interpretation of the atmosphere model (image).
I have an experiment to conduct: to radiate pure N2 with IR light and measure (with the Raman CARS spectrometer) if there is an excitation/ heating.
I am going to need help with this, so get in touch.
I can’t help you but I wish you good fortune.
Amazing what can be learned when you don’t already know everything
Or if science is “settled”.
Why does (or does not) water escape from the TOA to space? Gravity?
High in the atmosphere, sunlight splits water molecules into H and O atoms. The former escape to space and the latter form ozone.
It does escape at the poles.
“If we assume Earth is a blackbody, then subtract the solar energy reflected, from the hypothetically non-existent clouds, atmosphere, land, ice, and oceans; we can calculate a surface temperature of 254K or -19°C. The actual average temperature today is about 288.7K or roughly 15.5°C. This modeled difference of 35°C is often called the overall greenhouse effect.”
Radiative power does not deal with average temperatures (strongly nonlinear). The earth has a rather wide temperature span. Is that accounted for?
Snutbil, No, Earth’s surface temperature variability isn’t accounted for in that model. You are quite correct, and it is one of the many reasons why the blackbody calculation of GHE is nonsense.
Thank you, Andy!
Which means, the much referenced temperature without GHG might/will be seriously wrong, as will the green house effect.
I have a rather strong feeling this “simplifcation” (along with others, e.g. ∆T = λ ∆Ftoa as mentioned recently by Willis) have implications ruining “basic assumptions” in the climate field. Leaving quite few cards in the house of cards standing.
I struggle with seeing any real world use of global average temperature. I does not exist as a physical parameter and can it possible be used for any calculations?
The climatologists believe they can resolve changes of 0.01K in air temperatures from their monthly averaging (anomalies)—they are fooling themselves.
You mean, the earth is a complex system of systems? That it cannot be modeled effectively by a single equation involving CO2 concentration in the atmosphere?
Bu .. bu .. but the warmunistas have been telling the world for decades that the earth’s climate is really simple – CO2 is the thermostat, period, and we need know nothing more.
Words to live by
Pat Frank has shown that the GCMs can be reduced to a linear equation where temperature is the dependent variable and CO2 is the independent variable.
Clyde, Isn’t it amazing that thousands of scientists and billions of dollars are wasted on GCMs that can be reduced to a simple linear function??
Why no one is screaming at the wasted money amazes me. Pat frank was correct. Actually, W&H’s results are better and more convincing, at least to me, than any of the IPCC GCMs.
Each of the GCM’s embodies its own unique mini-Climate Theory (with assumptions and operators differing from all the others). So how does it make any logical sense to average the predictions of many theories and expect the resulting average to represent reality?
We would never average out various field theories and then all agree that that average (understanding) was the truth.
Pat didn’t conclude that “thousands of scientists and billions of dollars” were wasted because the models could be reduced to a linear function of GHG forcings. His insight was that these forcings were insignificant compared to the much larger errors in other forcings, i.e., cloud cover, hence the models can not possibly tell us anything about the impact of GHG emissions.
Love that, is it a quote by someone?
Your imagined earth is the moon. Earth has 5.5 quadrillion ton atmosphere (nitrogen and oxygen). Insulating the earth with 728 watts of power. The moon illuminated side 130°C and -143°C on dark side. On earth tropopause is -62.1°C add 728 insulated pressure makes surface 1.6°C (no sunlight for 23° below 90°) or add sunlight for 23° above 0° equator (summer) the tropopause is -67.2°C. Add 728 watts insulated powered pressure (+210 watts from land absorbed sunlight) makes surface 18.43°C, 938 watts. Only one hemisphere can have summer at one time. This scenario northern hemisphere is summer. Do mean calculation earth isn’t really 15.5°C but more like 10°C. The earth temperature is less when southern hemisphere has summer. More reflected sunlight due to northern hemisphere land snow and sea ice (while southern hemisphere still has a lot more ice than the northern hemisphere summer minimum). Around 4°C in this scenario. I have data to back this up.
A prominent contributor to this site has stated that he does not believe in the thermal inertia in the climate system and claims that because the Earth is not cooling since solar activity has decreased, it proves that modern warming is not due to the modern maximum of the sun. That’s laughable of course, the thermal inertia of the climate system is witnessed every year with the hottest/coolest times of year occurring at the end of summer/winter respectively, not with the longest/shortest hours of sunlight.
Thermal inertia has longer cycles as well due to vertical ocean currents. This fall/winter’s upcoming La Nina could drastically decrease global temperatures as the heat built up during the Modern Maximum of the sun continues to wane.
The climate inertia is 340 watts per second per square meter. 5.4 x 10^24 joules as total ocean heat content. And 63°C x 1591 N(force) 728/3.1=234.8w-m2 compressing of air by atmospheric pressure. Or 938/3.996 (234.7w-m2) of which is radiation.
Earth is cooling due to La Nina and decreased solar activity. Latest sea ice record makes it very clear.
There is an even larger blunder with their mythical +35C from the purported GHG effect.
The surface area of the black body in their model is a hypothetical construct of classroom science that doesn’t exist – a perfectly smooth sphere with no mass.
In reality, the surface area of Earth is far greater than the number they use – orders of magnitude more. The planet also contains thermal mass and the area of the planet in direct irradiance builds up heat energy over the course of a day and over the course of a summer.
Energy balance on Earth is controlled by thermostatic process at the sea surface. Open ocean temperature limited to 32C but regulates to 30C. Sea ice prevents heat loss once water surface is at -2C. Look at the surface temperature of the water below the North Pole; held to -2C despite zero sunlight for months at a time.
Atmospheric water cools the surface on average but warms for November, December and January then cools for the other nine months.
Earth’s average SST would be 17C if there was no atmosphere. Sea ice would still contribute to retaining heat.
Why pull out one phase of water in the atmosphere and name it a “Greenhouse Gas”.when the solid phase in the atmosphere has a high influence on reducing the heat input?
The thermostatic processes that regulate the energy into and out off oceans are far more powerful than any nuanced radiative transfer through the atmosphere.
“Sea ice
preventsreduces heat loss once water surface is at -2C.Agree. Skin surface is what radiates and not the average of what is under the skin. According to reflectance data – ice radiates much less than water. There is a quantum jump in the difference.
Liquid water can never be cooler than -2C. It becomes solid ice. The “WATER” liquid surface is the key. All the SST data show the water surface (liquid) at the North Pole as -2C or warmer. That surface is an interface between liquid water and solid sea ice rather than liquid water and air.
The emissivity of the liquid water drops dramatically as the thickness of the ice increases.
Sea ice covers a significant proportion of the globe and it varies over time. How does “Greenhouse Gas” theory cope with the sea ice. The ice affects the heat transfer in and out of oceans where sea ice exists way more than the atmospheric gases above the ice.
Your operative word was “prevents.” I was only pointing out that it was imprecise.
and has never been observed or measured, only modeled
Not true! for example we have 50 years of observation of atmospheric backradiation, of satellite measurements of outgoing longwave radiation and other direct measurements.
Griff,
Measuring radiation on the surface or by satellite is not measuring the GHE. It is just a measure of flux.
Andy:
This has always puzzled me.
Just how do sceptics propose that the GHE be measured ?
Serious question.
Anthony, Which definition? You have to ask a precise question to get an answer. Do you mean the overall GHE? With a transparent atmosphere or no atmosphere?
Do you mean the enhanced GHE, the impact of additional CO2 or additional water vapor molecule by molecule?
Or maybe you are referring to the delta net radiation (incoming-outgoing).
The problem with GHE is it means something different to everyone who uses the term.
I think W&H did a very good job of providing a consistent, physically correct, definition in this paper and I applaud them for it.
We will never get anywhere in this debate until the terms are defined properly. This is where the IPCC has fallen down the most.
Why is it up to sceptics to come up with a way to measure GHE. Isn’t that up to warmists to prove their point?
“… doubling the methane or N2O concentration changes the outgoing forcing by less than one percent. …”
And a short Google search (first one out the box) on methane in the News turns up this phrase:
Methane is 86 times more warming than CO2 over a 20-year period. LINK
Methane is important, because the news media, climate scientists and the IPCC are essentially lying about it. The “…86 times more…” statistic is real but meaningless. The real comparison is the “… less than one percent…” change to forcing mentioned in the above article. Indeed, table 2 above shows methane to have the least effect of all Greenhouse Gases by a wide margin. It is not 86 times more powerful.
Some analogies: An ant can lift 86 times its own weight, a man cannot, therefore an ant is stronger than a man. No it’s not. A Piper Cub can fly 86 times further on a gallon of gas than a jumbo jet. The proper response to that is, “So what?” But the 86 times more powerful meme continues unquestioned year after year. People are never told, nor do they seem to ever ask how much methane will actually run up global temperature.
The lies are working, governments are increasingly writing regulations that will eventually have a negative effect on you and me. San Jose, CA for example has banned natural gas hook ups in new construction. This will expand in scope to include new and existing buildings everywhere. Here’s a LINK where you can read about that.
By the way, the 0.8 w/m² increase upon doubling CH4 looks to be trivial, but needs to be translated into temperature, so even I can understand what the real impact is i.e., Fill in the blank:
A doubling of atmospheric methane should
run up global temperature by _____ degrees.
Provide that answer to the crazies writing the insane regulations, and maybe a few will reconsider.
Thank you great points about methane
Thanks for the reply. Given that by mass methane is 86 times more powerful than an equal mass of CO2, and given that methane is on track to increase about 0.5 ppm by 2100 and by mass the corresponding equal mass of CO2 would be about 0.18 ppm, it can then be calculated how much an increase in CO2 from 415.00 to 415.18 ppm would run up global temperature (essentially zero), and multiply that by 86. It comes out to ~0.04°C.
The Global Warming Potential (GWP) numbers that have been published in the IPCC reports were probably designed specifically for methane. From your 11th grade chemistry the Gram Formula Weight of methane is 16 compared to 44 for CO2. Methane is the only Green House Gas (GHG) on the list that is less than CO2 and hence the only GHG that gets a bump up on the GWP number.
“86 times more powerful”
because CO2 is not a potent greenhouse gas.
That is on a molecule-by-molecule basis for a gas that is much less common than CO2 or WV. Methane is not as stable as CO2 and oxidizes, becoming WV and CO2.
Clyde.
When you read about the Global Warming Potential numbers in the IPCC reports, it says that it’s by mass, not volume. Molecule-by-molecule is by volume.
Each molecule has mass.
Comparing atmospheric CO2 and CH4 by volume and mass yields two very different answers. A review of your 11th grade chemistry and the Gas Laws is in order. Thanks for the reply.
It is interesting that your initial statement referred to mass, but then you followed up with estimate of an increase based on volume (PPMv). You were not consistent in your choice of units.
‘Comparing atmospheric CO2 and CH4 by volume and mass yields two very different answers.’
Of course it does.
We did that in Physics class grade 7.
Or, CO2 has 1/86 the GHE of methane.
If methane was the great end point of existence we all would have died when the permafrost thawed the last time
Or the time before
Or the time before that
Much warmer than now, permafrost melted, it simply got cold and froze again
Simple
Well, the first problem here is that if you actually calculate the intercepted energy from the sun the baseline temperature for Earth is 45.7°F. I would think that getting THAT number right to begin with would be very important. Source? NASA.
I would also suggest that you go read what the word “blackbody” means, as your paragraph including it is self-negating.
Prjindigo, According to Britannica:
“Blackbody, also spelled black body, in physics, a surface that absorbs all radiant energy falling on it.”
“The best practical blackbody is a small hole in a box with a blackened interior, because practically none of the radiation entering such a hole could escape again, and it would be absorbed inside.”
Sounds like what I wrote. You need to state your objection more clearly. If you object to the time gap between absorption and emission, that was first detected by Wood in 1921.
https://royalsocietypublishing.org/doi/pdf/10.1098/rspa.1921.0049
That Black Body Cavity (BBC) (ha ha ha ha) must rank as one of The Most Childish & Naive descriptions of the Emporia Wardrobe. EVAH
If you MUST invoke Positive Feedback, do be aware that somewhere is a much larger Negative Feedback keeping it in check
Likewise Emperor’s Clothes is the repeated, everywhere, use of the term ‘Earth’ and also ‘Surface’
The Surface is the soil, the water, the dirt or anything planted upon or growing out of same.
The Surface is NOT where thermometers are usually put
When the term Earth is used, concerning radiation, PLEASE define whether it is
That you are talking about.
Certainly yes there is No Lie, all those places are part of ‘Earth, but not any single one defines ‘The Planet Earth’
That is deliberate obfuscation, just as in BBC (both cases)
Deliberate Obfuscation is used by people who frankly, Don’t Know WTF They Are Talking About
To spot that is the most basic and simple inherited/genetic skill that we all possess = Sociability or First Impressions.
It is why Mr Trump, without knowing any great amount of Science, saw straight through it as A Hoax
And yes, it is not easy telling someone to their face they are talking out of their backsides and if you do, expect backlash
In fact, expect Trump Derangement Syndrome – which is exactly what we got
But in this modern world, the word ‘Trump’ is entirely superfluous.
What happened to our Sociability?
Just ask the girls, ponder on why they are ALL out there looking for boys with a GSOH when such a thing should be an intrinsic part of ‘boy’
Where did it go…..
And because they cannot find any GSOHs any more, have collectively gone on Baby Strike and increasing are sitting in the offices of lawyers.
With sour faces, firmly crossed legs and leveling charges of Unreasonable Behaviour against husbands and soon to be ex, boyfriends.
Got to be one of the biggest understatements of all time. So far to date.
Climate Change is symptomatic of something much bigger and much more scary..
Since you’re critical of a whole lot things in that screed you might consider the use of acronyms that the reader has to look up in order to understand exactly what it is that you are trying to say.
GSOH = Good Sense Of Humor. Only I had to look it up. And considering where the Google search said that acronym is usually found, it looks like you spend time perusing the internet looking for a romantic partner.
OK that was mean, but I’m tired of people who use acronyms because they think it makes them look smart and up to date.
Are you over 100, Steve?
I didn’t know what “GSOH” meant either, and I wasn’t willing to take the time to run it down. Therefore, I skipped most of what Peta had to say.
Many definitions are listed. Teenage slang is not part of everyone vocabulary.
ROFLMAO! Oh Steve, you make me LOL!
TTFN
This is an apt time to reiterate what you just said. I was going to do so anyway. The earth is the earth and the atmosphere is the air. When using the word “surface” its traditional meaning is what you say. The rocks, soil, and oceans. Too many use the term surface to actually describe the atmosphere at the surface.
The surface (traditional usage) and the atmosphere are two different bodies when describing a thermodynamic system. The surface is a hot body radiating energy. The atmosphere is a cold body absorbing energy from the surface. They each have their own gradients and the gradients are affected by each other.
Another issue I never see addressed is H2O’s interaction with the sun’s near IR. Assuming a water vapor molecule can absorb no more one still has to address clouds, i.e., liquid water. Clouds can absorb a substantial amount of energy from the near IR turning water droplets back into vapor. Will this vapor last long since it is at altitude? I say it won’t, and it will subsequently re-radiate that energy. Some of that energy will be directed toward the surface but whether CO2 intercepts it before reaching the surface is an unknown. if so, it will raise the temperature of the atmosphere.
Very good Andy May! You recognize the complexities of Climate Science. My comment would be “He who studies radiation but ignores convection and the water cycle gets the wrong answer.”
Right, Andy has presented great points of uncertainty for a “The Science Is Settled” CAGW crowd to willfully ignore.
“The Moon has a calculated blackbody temperature of 270K, no atmosphere or oceans, and an average temperature, at the equator and mid-latitudes, of around 236K, so even the Moon is not an ideal blackbody.”
That is because the wrong method has been used to calculate it. Spreading the solar irradiance over the whole sphere results in an artificially high black-body temperature. Calculating the actual hemispheric heating and averaging that with the mean dark side temperature yields a reasonable global mean.
394K * 0.5^0.25 = 331.31K
minus albedo:
331.31 * 0.89^0.25 = 321.8K
and averaged with a mean dark side temp of 95K, is 208K for the global mean.
Earth’s sunlit side (at any given time) is cooler than the sunlit side of the Moon, but Earth’s dark side keeps so warm primarily because of the oceans rather than the atmosphere.
“208K for the global mean.” for the moon without an atmosphere.
Interesting that 208K (minus 65ºC) is very close to the tropopause temperature of Earth.
Ulric, There are many ways to compute the average temperature on the Moon, but none of them match the Moon’s blackbody calculated temperature. That is the point.
If you use the SB equation to computed a daytime temperature on the lunar surface you get 109C, fairly close to the observed 106C, but the nighttime temp of 90 to 95 means the lunar surface is storing a lot of energy. Blackbodies do not store energy.
Andy, I got close to the global mean with my method.
I calculated the mean for the whole sunlit hemisphere, not just the equator. 321.8K is about 48.7°C.
The mean dark side temperature of around 95K is NOT a lot of energy, it’s equivalent to about 4W/m^2.
Here is a link to NASA’s lunar surface measurements. Most of them fall between 320 and 360 in the daytime.
387695main_divinerb20090917-full.jpg (1280×720) (nasa.gov)
Anyway, estimates of the lunar average surface temperature vary a lot. There isn’t much data. The key point is the Moon is not a blackbody. If it were the nighttime temperature would be 2.7K.
No the key point is that dividing the solar irradiance by four and spreading it over the whole sphere is bad physics, and leads to an artificially high black-body temperature value. While diving it by two for the sunlit hemisphere only, and averaging that with mean dark side temperature, yields a good global mean temperature value.
Your point about black-body temperature illustrates that the dark side temperature is dependent on heat capacity. If the heat capacity was doubled, it would make the dark side much warmer, but not make much difference to the sunlit side, except nearer the terminators. Which is exactly why Earth’s global mean is much higher than the Moon, much more heat capacity to keep the dark side warmer.
Good point. Now explain it to the alarmists, they do not seem to understand this basic concept that heat capacity matters!
For Earth’s sunlit side, given 30% albedo, 6% Rayleigh scattering, and 16% near infrared absorption by water vapour, it equates to an equivalent black-body mean temperature of 12.5°C.
A greenhouse effect of +33°C on top of that is nearly as warm as the Lunar sunlit side.
You are saying that all blackbodies instantaneously re-radiate incident radiation? A blackbody the size of the sun releases all energy as quickly as a black body the size of a single molecule or atom? That implies infinite conduction rate, and violates the Einsteinian limit of the speed of light.
I think that a more probable model is a finite flux where the blackbody reduces its temperature over time, where the flux rate is a function of radius and thermal conductivity of the blackbody. Or, are you suggesting that because is it a blackbody, the energy conversions take place as a surface effect only?
That is precisely what a black body is, a surface only.
However, as a practical matter, we talk about an approximate or near-Blackbody. That is, we attempt to treat celestial bodies as having some of the emissive properties (albeit e < 1) of a Blackbody, yet, obviously, the moon and Earth have to have properties of a real solid, such as thermal conductivity and specific heat.
A blackbody is a theoretical construct. It is a massless, volumeless body that only has surface area and temperature.
It has its uses but you can’t add properties to it like specific heat and conductivity etc.
Certainly cleared some issues.
I too have made observations and this article has helped.
I present watts/micrometer. Not inversed. Shows how many watts at certain wavelengths.
20 watts (84km) CO2 emissions comes from this altitude (25 watts).
The earth doesn’t emit negative 128 Celsius (144.9K,20 micrometers 25 watts), only at that altitude 84km. CO2 temperature is -80°C 193K 78 w-m2 53 watts more than lowest level.
Every latitude from 90 to 0 when sun is at equator is 11.1 watts. Average of 938.51 watts (2021) (234.72 * 3.9984) was received from the sun. Average 231.39 watts was absorbed by the earth. 938.51-231.39=707.12 (310(solar)+74(absorbed by earth)+323(Atmosphere). Pressure 101325 can be calculated as 728 watts (63°C) @ur momisugly 1°C multiplied by 1591 newton force.
Clouds not included in models blocks out 75% of solar energy. As clouds cover 74% of earth only 25% of the sun heats the earth. Reason the earth is 340 watts (5.4°C), measuring the earth from a academic website has CO2 forcing included increasing to 342.5 watts (5.8°C).
The 46700 (10 power 18) is 0.2% of atmosphere. It should be 9450 as 0.0412% (10.6 watts forcing).
Sorry to go off topic ,but how do i find the archives,I am sure that there used to be a way to access older papers by WUWT.March 2017 I am looking for “response tothe NYT primer on climate change^ .
Ed, The article is here:
https://wattsupwiththat.com/2017/03/18/response-to-the-new-york-times-primer-on-climate-change-short-answers-to-hard-questions-about-climate-change/
Article asks what does my reconstructed dataset say and what does it mean. That’s it. What was said is that CO2 emits at 84km, an altitude where at 625-714cm-1 (inverse or backward but still low energy) frequencies of radiation or 16-14 micrometers (low energy). Example over the summer the tropopause over Antarctic emitted radiation at frequencies at 631cm-1. Without extensive research and looking at the radiation flux in article. You may think was there a heatwave over Antarctic. No the higher temperature curve over such low energy is inverse. Backward (like reading words in a mirror). The radiation flux in watts/wavelength is no mirror. It’s real. Lower wavelengths (higher temperature). Higher wavenumbers (higher temperatures).
“The Earth’s temperature controls the type of radiation it emits, and it emits mostly in the thermal infrared. The range of emitted frequencies, plotted as wave numbers, with units of 1/cm, are shown in Figure 1.”
I always find this curve confusing and this particular one a little worse due to the superimposition of the imaginary green line for a non existent No CO2 scenario.
Perhaps someone, the author, can explain firstly how the radiation out is a smooth curve or can be a smooth curve when the emitting substances may not have an IR emission state at a particular temperature. I realize it is, I just do not get the specifics of how a substance can only emit at certain frequencies yet the radiation profile insists that it must do so to satisfy the energy in, energy out need.
I can imagine, for instance, a CO2 world putting out a lot more packets of IR if heated up more but how in the heck does it decide to put them out at frequencies or wavelengths it is not supposed to use?
This leads to the second problem, directly.
The amount of energy being put out is never greater at any spot and only ever dips at places leading to both overall energy out being less than what comes in.
Which is illegal.
And secondly does not make up for, as I said, the ability of something like a CO2 or H2O to put out a lot more pakets of energy at the one wavelength if it has enough energy to do so.
Is the blue line totally fictional and the real world non black body is putting out more energy at certain times and load and less at the other non emission wavelength gaps?
If so, why don’t scientists or people give the real line emission profile on top of the schematic one, if it is indeed schematic?
Third problem.
How can there be dips in the outward emissions at the absorptive frequencies if indeed the CO2 , for instance, almost immediately releases the same wavelength back to space?
Doing this and labeling it forcing implies that the atmosphere is indeed retaining energy and becoming hotter.
When this obviously cannot be the case.
The energy going out is the same as the energy coming in.
I understand there is an absorption going on but am missing the connecting piece.
If the absorption is real, ie less IR out at that wavelength, then something is happening to that absorbed energy that should be radiating out at that frequency. Either it is rising to a higher level forcing the CO2 [and H20 further out] to emit that energy at a higher distance and hence seeming lesser intensity per Sq meter.
The expansion of the hot gas below with the now cold gas above after emission falling.
Or it is emitting at a different frequency than what it is supposed to be emitting at.
Either way the model has to be wrong if it is claiming to be showing the actual amount of energy related to those wavelengths is missing a la Trenbath.
I have put a far bigger post up at Climate etc on this.
Basically
The atmosphere is warmer due to GHG, water and CO2.
Not because they trap or store heat but because they have to be at those temperatures to emit they radiation they receive.
Nitrogen and O2 molecules have a lot of motion which helps bump the IR emitting molecules. They are moving faster helping more heat being emitted but the surface where they came from is moving slower [is colder.
Everything is in balance.
There is no need for a TOA imbalance to put or store extra energy in a system [not that it can anyway].
The system is at the natural temperature it has to be to keep the incoming and outgoing energies equal.
The concept of retained heat is captivating, especially for GHG enthusiasts.
angech,
The dips are caused by the altitude of the emissions to space. The emissions at lower temperatures than the surface release less energy. Temperatures in the stratosphere can be at a higher temperature, but there are fewer CO2 molecules, so even there the energy emitted can be less.
A lot of the lost energy due to CO2 and other GHG absorption, due to lower emission temperatures or lower air density goes to warming the air.
Andy, I have had question about this for sometime. You say there is an element of radiation intensity that has to do with the number of molecules. It would seem that a portion of the “dip” could also arise from themalization of CO2 to N2 and O2. This energy is lost from CO2 when it occurs. This should then be a factor in reducing the energy at CO2’s frequency. This would have the effect of artificially reducing the height of CO2 radiation. I never see this addressed.
Jim,
In the troposphere temperature decreases with height. The power emitted from a CO2 molecule also decreases with temperature. So when energy is emitted from the surface or another CO2 molecule and captured by a CO2 molecule, if the receiving molecule is at a lower temperature, it excites the molecule so it has many more collisions with other neighboring molecules of all types. The collisions increase air temperature.
The lag between absorption and emission is long enough for millions or billions of collisions to occur. This dissipates some of the energy, then the rest is emitted, but with lower power than the molecule received.
This process works its way up to an altitude where an emission can make it to outer space. In the critical CO2 portion of the spectrum (see Fig. 1) the altitude where this happens is 84 km, almost at the top of the atmosphere – that is saturated!
I think it helps to look at the energies involved. A CO2 molecule weighs m= ~44/(6E26) or about 7.3E-26 kg. Its average kinetic energy is 3/2kT where k is Boltzman’s constant 1.38E-23 and T is temperature in Kelvin. So at 220K the energy is about 3E-21 J, and the average speed is sqrt(2x3E-21/7.3E-26) or about 285m/sec. Radiation is delivered and emitted by photons, whose energy is given by E=hv with v as the frequency in Hz, or equivalently hc/λ, where h is Planck’s constant 6.6E-34, c is 3E8m/s and λ is the wavelength – the main absorption bands for CO2 are 2.7, 4.3 and 15 microns (1e-6 m). So you are looking at photon energies of 1.96E-25/(2.7,4.3,15E-6) or about 7E-20J, 4.5E-20J and 1.3E-20J. The C=O bond has an energy of about 800k/6E23J or 1.33E-18J (so a photon of that energy or λ=~6.8E-8m could break the bond), substantially above the photon energies that serve to knock electrons into higher orbits that promote physical vibrations in stretching and bending of the CO2 molecule
Say the surface is 20°C 68F and at an altitude cooling stopped at -64C -83F. Or 30C 86F at an altitude cooling stopped at -71C 95.8F.
20 417 w-m2 9.89 micrometers 1011 wavenumbers
-64 108 w-m2 13.86 micrometers 721 wavenumbers
insulation 309 w-m2
30C 477 w-m2 9.56 micrometers 1046 wavenumbers
-71C 94 w-m2 14.34 micrometers 697 wavenumbers
insulation 383
CO2 -80C 78.67 w-m2 emitted radiation 15 micrometers 667 wavenumbers.
Where cooling has stopped is because gases at this altitude (11km) are absorbing at a higher warming rate (solar energy) than at a cooling rate(longwave energy). As cooling didn’t cool to CO2 15 micrometer band. How can absorption of IR from the surface of the earth happen.
Your perception is CO2 absorbs at the surface coz there is a gap and plank curve (blue line) has 14C 76F 287K temperatures. Not sure what the (X, Y axis ) numbers mean. That I’m trying to explain. And what inverse means. Why my explanation isn’t what your seeing. And whether you’ll understand.
angech,
All good comments. I’ll try and answer them all.
Wijngaarden and Happer did smooth all their curves for clarity. The raw HITRAN output is difficult to look at and make sense out of. See their discussion of their Figure 4.
I am also unclear why temperature determines frequency, but it does.
CO2 and other GHGs block radiation from the surface, by absorbing it at a cooler temperature. After absorbing the radiation the molecule becomes excited and has more collisions with neighboring molecules, warming the air around them. This happens millions or billions of times before they emit the radiation, but they emit it at a lower temperature (lapse rate controlled), so they emit less energy than they absorbed.
This process continues. In the case of the Main CO2 absorption frequencies (609-800) our current CO2 concentration blocks all emissions to nearly the top of the atmosphere, adding CO2 makes no difference.
CO2 has to absorb at higher wavenumbers and short wavelengths than what is emitted from the earth.
4.2 wavelength, 2380 wavenumbers. (these wavelengths and wavenumbers do not come from the surface).
15 wavelength, 667 wavenumbers (South pole lowest temperature -78°C. What is the wavelength and wavenumbers?
You are probably right, but I have no idea what they are. Download the full CO2 absorption spectrum from HITRAN and have a look. Attached is the absorption spectrum I got from HITRAN.
Good question. The very common use of ‘T to be fourth’ as determining radiated heat would seem to depend on the ability of the molecules to fill in an ideal radiative curve, at least approximately? Is there some thermodynamic reason why an atmosphere would tend.toward such curve shaping efficiency, or is it just lucky coincidence that the atmospheric composition seems to work that way?
I’ve had somewhat the same questions. Molecules absorb and emit at given frequencies. Exactly what molecules absorb high energy visible light? What molecules absorb near infrared? Why do you never see any outgoing energy at green. Green is either reflected or emitted by plants. If it is part of the incoming energy from the sun and it does reach the surface so it has to leave somehow. When looking at intensity, the amount of material emitting is important. Does this have an effect on calculating temperature?
Jim,
Plants absorb most of the red and blue light, and reflect green light and near-IR; the near-IR is reflected more strongly than the green. The blue and red are used for photosynthesis, albeit there is a fluorescent line in the red. Presumably, what isn’t reflected or used for photosynthesis is converted to heat, and then re-radiated as thermal-IR.
But where does all the green show up on outgoing radiation? At least over land, I would assume there is a large amount of green being reflected back to space.
Green shows up on Google Earth. The detectors for measuring earth temperature are specifically designed to not see visible light, reflected or emitted. We would be in a heap of trouble/ not be here if the earth was emitting in the green. Think of red hot/yellow hot iron.
It is my impression that the CERES measurements include all visible light, which includes green, when they attempt to determine an ‘albedo.’ That is, the green light is the reflected light in contrast to the thermal-IR, which is emission.
Jim, Nitrogen molecules absorb a lot of short wave radiation and the result is our blue sky.
I do understand that. That’s another question. Good absorbers are good radiators. As nitrogen is thermalized by CO2, Does it then radiate at visible frequencies? If so, how come it never shows up on radiation charts as outgoing energy emitted by earth?
My understanding is that it is Rayleigh scattering that is responsible for our blue sky.
Understand the spectrum.
Earth’s temperature.
Sea level 10 micrometers 1000 wavenumbers (16.8°C northern hemisphere summer)
11km 14 micrometers 714 wavenumbers (-66°C)
84km 20 micrometers 500 wavenumbers (-128.1)
Now imagine a huge radiator with water 85°C
How is the air heated?
20% radiation (186 watts)
80% convection (745 watts)
85C (8.09 micrometer wavelength, 1236cm-1)
Every cm away from the radiator gets cooler. Until room temperature is say 24°C (9.75 micrometers,1025 cm-1).
CO2 packets of IR at 15 micrometers, 667 cm-1.
Law of thermodynamic says a colder object cannot warm a warmer object. Or IR emitted from an object with less wavenumbers cannot increase the wavenumbers emitted by another object.
So earth is 16.8C emitting around 1000 wavenumbers and CO2 has less wavenumbers therefore isn’t going exceed what the earth is emitting. Therefore not increase the wavenumbers.
“Notice the CO2 and H2O emission temperatures in Antarctica are warmer than the surface in the atmospheric window, this means the air above the ground is warmer than the ground and that the GHGs are cooling, not warming the air.”
Umm…any relationship to the mysterious Antarctic cooling we’ve been told about here recently? How does this work in the Arctic winter?
¨In this post we will ignore the effects of gravity and surface air pressure, even though gravity causes the Sun to fuse hydrogen into helium and emit the sunlight that warms our planet. Trying to figure out how much gravity contributes to the overall GHE, and recent warming only gives me a headache, and it creates furious arguments in the comments. The reason for the furious arguments, and my headaches, is that it is a complicated thermodynamic argument, and no one really understands thermodynamics. So, we just acknowledge it must have some effect on the total GHE and leave it at that.¨
This guy did understand thermodynamics and radiation :
The Quantum Theory of Radiation A. Einstein (Received March, 1917) :
https://inspirehep.net/files/9e9ac9d1e25878322fe8876fdc8aa08d
I do realize what kind of reaction appeared here previously, but still, the headache of the entire economy collapsing because of green insanity far outweighs any mere argument.
Read this document also for a good mathematical treatise on how heat radiation works.
http://www.gutenberg.org/files/40030/40030-pdf.pdf
But the surface of Earth is NOT a perfect emitter. Especially in the far-IR range there is a substantial deviation of 12.5% on average with water, being the most abundant surface type.
Ignoring this reality introduces a large error, as it suggests GHGs like CO2 and specifically vapor were to mitigate a lot of radiation, which does not exist in the first place. The error significantly overstates the GHE of CO2, and vastly overstates that of vapor. The same is necessarily true for estimates on “forcing increments”, though vapor of couse is not considered a “forcing”.
The other problem should be quite obvious, if we consider what happens when the overlap between CO2 and vapor is allowed for, as in the above paper. Other than some 4 to 3.7W/m2 forcing for 2xCO2, the figure drops to only 3W/m2. It is a huge difference already and points out the significance of overlaps.
Excluding clouds from the get go means the largest overlaps, that of CO2 with clouds and vapor with clouds, are not taken into account. But these overlaps have huge impacts on the forcings and you get much lower figures if you take them into account.
https://greenhousedefect.com/the-holy-grail-of-ecs/the-2xco2-forcing-disaster
Most surface materials are diffuse reflectors. Water is predominantly a specular reflector (there is some diffuse reflectance from suspended sediment and plankton). One of the interesting things about specular reflectors is that the reflectance increases with the angle of incidence, and the higher the reflectance, the more spectrum of the reflected light resembles the spectrum of the source. Dealing with “surface normal” reflectance doesn’t provide the whole picture.
That is why I differentiate between surface normal, and hemispheric reflectivity (or emissivity respectively), and provide the data to all of you so that you get a glimpse on the “whole picture”.
The problem is that you are mixing logarithmic and non-logarithmic on the same graph, with no explanation why. To someone who knows what the graph should look like, it’s nonsense.
Tell us what you believe to know..
Yellow curve is 5778K. Orange curve is 288K. I don’t see how they can have the same amplitude. There seems to be something missing in your explanation(graph).
If one assumes that atmospheric CO2 is predominately of anthropogenic origin, it seems appropriate to ask if man has the capacity to double atmospheric CO2.
What on Earth is this “gravity induced warming” !?
I am sure a thermodynamics expert would look at this and laugh. This means the whole article is consigned to the bin.
Better to ask what on the Sun is gravity induced warming?
Well, gravity warms and compresses enough to millions of degree to allow nuclear fusion to start – it is then called a star.
There are quite a few of those gravity assisted fusion furnaces out there.
And as the CNO burning proceeds, gravity collapses the star quickly again giving a Supernova.
This red giant looks primed to go :
http://www.sci-news.com/astronomy/alma-atmosphere-supergiant-star-betelgeuse-04992.html
However, if the mass contracting was too small to initiate fusion, the gravitationally induced heating would have stopped, and then proceeded to cool, just as the Earth has done.
“However, if the mass contracting was too small to initiate fusion, the gravitationally induced heating would have stopped, and then proceeded to cool, just as the Earth has done”
Clyde, some interesting thought responses available in this comment.
First is there a confusion on gravity induced heating, one process, and fusion, a seperate process that actually produces ongoingheat generation by a different, and destructive mechanism.
If one thinks about it, as Andy put it, gravity decreases entropy of a system, ie increases the energy in a system.
At least it compacts or compresses the available energy leading to more molecular interaction and hence increased heat or energy.
While a meteor might be perceived to be cold and energy less without fusion there is still some minute heat generation occuring albeit with weak gravity being very weak heat.
At the centre of a large meteor the heat being generated by small molecular movement has to travel to get out so the centre should be warmer than the surface?
The earth is producing a lot of heat internally through gravity aided fission?
It is my understanding that while fission was taking place during early-Precambrian time, it is rare to non-existant today because the fissionable isotopes have decayed to a level the prevents a critical mass being achieved. On the other hand, nuclear decay generates sufficient heat that it prolongs the cooling time of Earth, leading to Lord Kelvin’s significant mistake in his calculation of the age of Earth.
Clyde Spencer
nuclear decay is nuclear fission.
From the scientific American article
Nuclear fission powers the movement of Earth’s continents and crust, a consortium of physicists and other scientists is now reporting, confirming long-standing thinking on this topic. Using neutrino detectors in Japan and Italy—the Kamioka Liquid-Scintillator Antineutrino Detector (KamLAND) and the Borexino Detector—the scientists arrived at their conclusion by measuring the flow of the antithesis of these neutral particles as they emanate from our planet. Their results are detailed July 17 in Nature Geoscience. (Scientific American is part of the Nature Publishing Group.)
Neutrinos and antineutrinos, which travel through mass and space freely due to their lack of charge and other properties, are released by radioactive materials as they decay. And Earth is chock full of such radioactive elements—primarily uranium, thorium and potassium. Over the billions of years of Earth’s existence, the radioactive isotopes have been splitting, releasing energy as well as these antineutrinos—just like in a man-made nuclear reactor. That energy heats the surrounding rock and keeps the elemental forces of plate tectonics in motion. By measuring the antineutrino emissions, scientists can determine how much of Earth’s heat results from this radioactive decay.
How much heat? Roughly 20 terawatts of heat—or nearly twice as much energy as used by all of humanity at present—judging by the number of such antineutrino particles emanating from the planet, dubbed geoneutrinos by the scientists. Combined with the 4 terawatts from decaying potassium, it’s enough energy to move mountains, or at least cause the collisions that create them.
https://en.wikipedia.org/wiki/Nuclear_fission
When common beta decay takes place, only an electron leaves the nucleus, and the atomic number is increased by one. That does not fit the usual definition of a nucleus splitting into two or more similarly sized nuclei.
Yes that is what happens initially. If there was no fusion, the star would continue contracting and giving out heat (adiabatic compression) until it could contract no more. At that point (equilibrium) no more heat would be produced and the “star” would cool. The fact that there is a pressure gradient per se does not produce heat at equilibrium. Compression only produces heat when active compression is in progress. When compression stops so does the heat production.
That is true for closed systems with an impermeable barrier.
Earth is not a closed system like this.
Entropy is constantly trying to get our atmosphere outa space (not even talking about solar wind etc.) and gravity is constantly providing a force against it. This force is translated to pressure.
Pressure is linked to temperature via the ideal gas law. Temperature is foremost kinetic energy and not radiation. The radiative theory of the GHE is mainly ignoring that.
Physicists often forget about entropy. Chemists don’t.
kzb,
I think you are confused about the second law. It only applies to closed systems. Gravity obviously decreases entropy and generates radiation, that is how stars work and how crystals form.
That answer shows how you misunderstand. Stars work because the contraction under gravity causes heating, until such time as fusion starts and an equilibrium is established.
Without fusion, the star would have to continue contracting indefinitely to maintain temperature.
In the case of a planet, without an additional energy source, the atmosphere would contract and in doing so would produce heat (adiabatic compression) until such time as the atmosphere liquified. But it has to be actively contracting to do so. The Earth’s atmosphere is not contracting and there is no net adiabatic heating.
kzb,
I see you did not read the paper. Here is the important bit you missed:
It will be absolutely negligible in warming. You are looking at maybe 0.01% change in the atmosphere mass, added over a time period of decades. The fact that you can posit this as a significant source of heating shows you really do not get it.
Hmmm, Methinks you are cutting your own throat. The Earth’s surface temperature varies 3 degrees C every year. The maximum (about 16C) is in July and the minimum is in January (12C) (Jones, 1999, Reviews in Geophysics). Yet, you claim 0.8C of global yearly warming since 1900 is significant? You are not much of an authority.
0.01% of 288.7 is .03, which is 4% of 0.8. Given that CO2 is 50% heavier than dry air, this number may be very conservative.
The point most people miss is we are talking about very small numbers, very small stuff can be confusing. Sometimes, insignificant, is just insignificant, like global warming.
You’ve just proved my point. The CO2 increase is roughly 0.042% -0.028% = 0.014%.
The gain in mass would be 0.02% by my calculation without any change in H2O concentration. And this is spread out over many decades. Any added compression heat from years ago has radiated away by now. It is not stored indefinitely. You have to look at it as a heating rate, not a total amount integrated over decades. The next stage is to calculate it in W/m2. That number will give you the fair comparison and I guarantee it will be negligible.
As above, you are forgetting about entropy trying to get the molecules out in space. It’s not a finite process with an equilibrium. It’s constantly ongoing.
If cooling would take place the ideal gas law requires that pressure goes down, leading to expansion of an atmosphere with the same atmospheric mass.
The only way to keep pressure constant is keeping the temperature constant.
Btw that is one of the reasons why dying stars first expand. They cool.
Pressure is the result of a mass of gas above you in a gravitational field. If the temperature increases the atmosphere will expand to a greater height above the surface, whilst becoming less dense in lockstep. The mass of gas above you does not change and to a first approximation the pressure will be constant with temperature (the strength of gravity does of course decrease with distance, but that is a small complication).
The temperature gradient of a tall column of gas in a gravitational field is well documented physics, apparently not understood by many. “Adiabatic lapse rate” is important in meteorological skew -T and ephigrams. The equations for adiabatic lapse rate don’t take into account radiative heat transfer between the warm bottom and cool top of the column of an IR absorbing gas column. Assuming convection as a primary source of heat transfer makes the calculations more “real world”.
https://journals.ametsoc.org/downloadpdf/journals/atsc/27/2/1520-0469_1970_027_0219_talrit_2_0_co_2.pdf
You can go back to 1964, Manabe and Strickler, fig. 4, to see curves showing calculated radiative and adiabatic equilibriums for the atmosphere.
https://www.gfdl.noaa.gov/bibliography/related_files/sm6401.pdf
DMacKenzie, Thanks, good links.
The temperature gradient of a THERMODYNAMICALLY ISOLATED tall column of gas in a gravitational field is ZERO, as first demonstrated by JC Maxwell about 150 years ago. This means that gravity itself does not create the gradient.
The earth’s atmosphere usually has a negative lapse rate because it primarily gains thermal energy (“is heated”) from the bottom and primarily loses thermal energy (“cools”) from the top. It is nowhere near thermodynamically isolated.
If the lapse rate introduced by this differential heating/cooling is larger than the adiabatic lapse rate, it is an “unstable” lapse rate, and convection starts to drive it back toward adiabatic. That is why we commonly (but not universally) observe lapse rates near adiabatic.
Ed, Good description. While a tall column of gas is isothermic, at least in my opinion, its temperature is set by the surface temperature under it.
If it is perfectly transparent, with no absorbing molecules, the temperature will last until the last molecule. But, this is not reality. I don’t think perfectly non-absorbing molecules exist.
“The temperature gradient of a THERMODYNAMICALLY ISOLATED tall column of gas in a gravitational field is ZERO, as first demonstrated by JC Maxwell about 150 years ago. This means that gravity itself does not create the gradient.”
Ed Bo.
Getting a bit deep here with the specifications.
Take away the caveats and what you have just said is
The temperature gradient of a tall column of gas in a gravitational field is not ZERO. This means that gravity itself does create the gradient.
–
While Maxwell is correct in a specific situation, well, he is pretty correct most everywhere, the fact remains that outside the thermodynamically isolated situations gravity can be considered by the lay person as a cause of heat production.
No it can’t. There can be no net production of heat by gravity in an isolated system. That is perpetual motion.
Ed,
Aarghh, as I said, not well understood. Lets say the atmosphere of a planet consisted of only one molecule, which hits a rock and is deflected upwards. That one molecule has a velocity which corresponds to a temperature of 1/2mv^2=3/2kT. You can actually calculate from high school physics the altitude at which its velocity will be zero thus its temperature absolute zero, due to climbing against a gravitational field. Of course ensembles of a huge number of molecules are always being jostled by their warmer neighboring molecules, so statistical thermodynamics equations must be applied, which is where the adiabatic lapse rate equation came from. I don’t know of anywhere Maxwell derived what you say he did.
And, for KZB, no gravitational “heating” is involved…the energy content of the adiabatic (zero heat transfer) column in the form of kinetic-thermal and potential-elevation energy is conserved as the molecules jostle up and down.
DMackenzie:
This is well understood by the scientific community, especially those who really understand statistical mechanics.
Maxwell expected equal temperatures at the top and bottom and in his book “Theory of Heat”, published in London in 1877, he writes (p. 320):
“The second result of our theory relates to the thermal equilibrium of a vertical column. We find that if a vertical column of a gas were left to itself, till by the conduction of heat it had attained a condition of thermal equilibrium, the temperature would be the same throughout, or, in other words, gravity produces no effect in making the bottom of the column hotter or colder than the top.
This result is important in the theory of thermodynamics, for it proves that gravity has no influence in altering the conditions of thermal equilibrium in any substance, whether gaseous or not. For if two vertical columns of different substances stand on the same perfectly conducting horizontal plate, the temperature of the bottom of each column will be the same; and if each column is in thermal equilibrium of itself, the temperatures at all equal heights must be the same. In fact, if the temperatures of the tops of the two columns were different, we might drive an engine with this difference of temperature, and the refuse heat would pass down the colder column, through the conducting plate, and up the warmer column; and this would go on till all the heat was converted into work, contrary to the second law of thermodynamics. But we know that if one of the columns is gaseous, its temperature is uniform. Hence that of the other must be uniform, whatever its material.”
Richard Feynman, in his classic lectures on physics, used a very similar proof. He considered it a trivial, obvious point.
The Feynman Lectures on Physics Vol. I Ch. 40: The Principles of Statistical Mechanics (caltech.edu)
The analysis for the adiabatic lapse rate is very different. If the magnitude of the negative lapse rate in a gravitational field is larger than adiabatic, the weight of the atmosphere above is not sufficient to suppress upward motion of the hot parcel below. This is called an “unstable lapse rate”, and convection starts, driving the lapse rate back toward adiabatic.
Smaller negative lapse rates, and positive lapse rates (temperature inversions) are “stable lapse rates” and can maintain, consistent with statistical mechanics analysis.
Bizarre logic, Angech. You agree that gravity does not create a gradient in an isolated column, but argue that somehow it does in other columns.
How do you explain the temperature inversions (positive lapse rates) that can occur at night, particularly in the months-long polar winter nights?
Angech – You say: “outside the thermodynamically isolated situations gravity can be considered by the lay person as a cause of heat production.”
I certain hope the lay person would not be so wrong. The power transferred to an object by gravity is:
Power = Force x Velocity
In the case of a solid object falling, the (vertical) velocity is non-zero, so the power is non-zero. But the atmosphere has already fallen, so its vertical velocity (overall) is zero.
This means the power transferred to the atmosphere is zero. This is basic high school physics!
Ed Bo
“Bizarre logic, Angech”.
I like to think laterally, Ed.
It causes me a lot of headaches, with others.
However logic has a chain to it which can be quite lateral as well.
You say,
” But the atmosphere has already fallen, so its vertical velocity (overall) is zero.”
You cannot pick and chose conditions to backwards fit a claim.
“The power transferred to an object by gravity is:
Power = Force x Velocity” seems OK.
However you claim “the atmosphere has already fallen” to justify your position or example.
Is the atmosphere lying inert ,cold, limp and lifeless on the ground?
Is the atmosphere you refer to that on the earth or that in the
“THERMODYNAMICALLY ISOLATED tall column of gas in a gravitational field ”
In either case I think you should conceded that for every fallen angel a thousand others are flapping their wings against gravity still.
“The atmosphere has already fallen” is a great way of putting it. It has. The fact that individual molecules are moving up and down is irrelevant, because it is the average of all molecules in the atmosphere we are discussing.
kzb
“The atmosphere has already fallen” is a great way of putting it. It has. The fact that individual molecules are moving up and down is irrelevant, because it is the average of all molecules in the atmosphere we are discussing.”
“The fact that individual molecules are moving up and down is not irrelevant”
It means they both contain energy [heat] and transfer energy [heat]
Yes but there is no generation of excess heat in the lower layer of the atmosphere by this mechanism. The atmosphere is not constantly producing new heat. That would be energy coming out of nowhere.
When you put your brakes on the friction produces new heat.
The heat comes from the conversion of motion into energy.
The sun causes the motion.
The sun heats the atmosphere, gravity pulls it back down.
It collides and creates heat from the gravity induced motion of the particles hitting each other.
The energy comes from the sun. Gravity converts some of it into heat as one of the ways it gets to go back to space.
There is more heat [excess heat ] you said in the lower atmosphere due to the effect of gravity.
Gravity per se does not make new heast, it allows a mechanism to generate heat from molecular motion.
Yes but the author and other people on here seem to think gravity does indeed generate new heat. Pleased to see you don’t thing this.
Ed Bo
Angech – You say: “outside the thermodynamically isolated situations gravity can be considered by the lay person as a cause of heat production.”
I paraphrased your initial statement.
A lay person could look at the heat in the lower atmosphere and conclude that it had been caused [produced] by gravity.
Higher up, less gravity, thinner air, less heat.
Lower down, more gravity, thicker air, more heat.
Now you can claim that the logic is wrong.
A lot of people disagree with you.
It certainly seems to have a validity on the surface.
Personally I would look at the power source first and then decide how that power was being transmitted
Exactly. This is absolutely basic and anyone who calls themselves a scientist should see it straight away.
The absorption band is saturated. This hugely important finding means that no matter how much additional GHG is added to the atmosphere, the warming effect will be tolerable. Climate change is not an emergency. COP26 is pointless with regard to climate. It was always about redistribution of wealth anyway.
Another important finding is that the different GHGs cannot be treated as separate, independent gases with their own GHG characteristics. In reality, there is a mixture. The bands overlap, water vapour is dominant because of its abundancy and individual gas contributions are greatly reduced. The band is saturated to all of the gases. We don’t have to worry about CO2, N20, CH4 or any other GHG.
The alarmists have no answer to this so they will ignore it.
As an aside, I have been speculating about the bigger picture and mention it here to be shot down if considered nonsense. Saturation is the explanation for those who reluctantly accept the GH hypothesis but cannot accept that global warming will fry us all. It would also explain why atmospheric CO2 levels of 8,000 ppm could exist in our history without destroying the development of life.
This got me thinking about the GH effect raising earth’s temperature from being too cold but saturation preventing the earth from becoming too hot. This must be linked to the amount of IR radiation, the path length (thickness of atmosphere) and concentrations of gases. The thickness of the atmosphere relates to the size of the planet and gravitational forces. Perhaps there is an ideal (goldilocks) condition which allows all these factors to produce the ideal, highly stable climate that supports life.
Another thought is that a greenhouse effect that warms the planet but not to a dangerous extent is surely a face saving outcome that everyone can accept and unite around? Well, maybe not everyone. The extreme alarmists will never give up their dream of Armageddon. I doubt if the modelers will back down either.
I think you will find the a greenhouse effect does not operate in a standalone fashion to warm/cool the atmosphere. If it was there would already be a mathematical solution. A coupled non-linear system means their are numerous variables that combine together to create a stable and liveable earth.
My understanding is that saturation leads to a widening of the wings of the absorption feature, and that is expressed by the logarithmic relationship between concentration and temperature increase.
I agree completely that all the absorbing gases have to be treated together, and not just focus on CO2. That is, if water vapor is responsible for most of the thermal IR absorption, the contribution of a doubling of CO2 is only a small fraction of the total IR absorption.
Andy:
Regarding Table 2, as the water vapor column amount is highly variable, what value was used for the calculation?
How much measured spectral irradiance data of the long-wavelength IR is available?
Monte,
The values used are plotted in Figure 2. Water vapor is the blue line.
Carlo, Monte
Regarding Table 2, as the water vapor column amount is highly variable, what value was used for the calculation”
As an aside the water in the atmosphere persists in a fairly constant percentage range related to the pressure and temperature of the atmosphere.
There are maps and charts of relative humidity
It cannot be over saturated for long. The excess [only] precipitates out as rain, the remaining air is saturated still.
When areas warm up without enough water underneath to saturate the air occur there is a slight decrease in the amount of water in the air temporarily.
Overall the amount of water [biggest greenhouse gas] in the global atmosphere stays the same but unlike the other gases the concentration in the air varies with the temperature at different local sites. It can still be used, and should be used in all GHG calculations.
LOL! I just read the old linked article by Willis “The Stell Greenhouse”. It perfectly describes his ill fated “understanding” of the GHE. And I was tempted to point out the logical fallacy, but then I thought this is so obvious, someone should have done that already in the comments. And indeed, “Anton Eagle” puts it perfectly:
Exactly! And that perfectly describes the impossibility of “back radiation” heating anything. Really it would mean free energy out of nowhere. And once you introduce this free energy and apply it consequently, it is not just a certain amount of free energy, but actually endlessly inflating free energy.
Ironically, if it would work, we would need no more fossile fuels and could rely on perpetuum mobiles instead, like the mythic “Manabe-Strickler” device 😉
Back radiation is a thing. However the fallacy come in when it is added to the original radiation in an ever increasing sequence. Think of the planet having two bodies, the surface of the globe (dirt, oceans, etc.) and the atmosphere as an insulator. This makes it a simple thermodynamic system. The “surface” radiates a given amount of energy, primarily at far infrared. The atmosphere works like an insulator, albeit with a multitude of different gradients and back radiates some of the absorbed energy. Think of an insulator made of an alloy with numerous different materials.
Let’s say the earth radiates 100 watts into the vacuum of space. It will take a certain time to cool depending on several factors but in the end it loses 100 Joules/second. Now let’s insulate it. The insulator will “back radiate” as it warms. Lets say it’s temperature causes a “back” radiation of 50 watts. What happens to the hot body? It absorbs the incoming 50 watts but keeps right on losing 100 watts for a gradient of net 50 watts. So does the cold body drive the hot body backwards up the gradient so it begins to radiate at 150 watts? No. But it does lengthen the time for “cooling”. Some folks want to say that the 50 watts adds to the already 100 watts but it doesn’t. Max Planck in his treatise on heat radiation calls this compensation. It is why insulation can not “add” heat to your house but only slow heat loss.
Let me say this is a terrible simplification of what goes on but it should demonstrate the fundamentals of heat transfer.
You are still stuck in the same fallacy. What you mean is insulation, which can attained in different ways. Stop the air from circulating freely, and you get a literal greenhouse effect, like with a car in the sun. Or coat something with a material of lower emissivity, will work as well. Anything that impairs the flow of energy (convection, conduction, radiation..) will work.
“Back radiation” will not.
You will notice that I called the atmosphere an insulator. An insulator can and quite likely will heat to the sources temperature at the boundary. However, the conductivity of the insulating material will provide a gradient to the cool side that inhibits heat transfer. In essence, the insulator gets warmer throughout its volume and because of low conductance, releases it at a slower rate to the cold side. This is why the atmosphere warms. However, it can never warm to a higher temperature that the source, the surface of the planet, so it can not make the surface hotter.
It is important to be accurate when the word “surface” is used. It can not describe both the land/oceans and the atmosphere. Most land temperatures are really a measure of the lower atmosphere and not the ground. There are colleges that do track the ground temperature at various depths, and it is quite different than the lower atmosphere.
Let me solve “The Steel Greenhouse” example. I think it is easy to see how it can not work the way Willis suggested. But how will it actually work?
Let us assume the shell had a very tight fit around the planet, so that any delta in radius would be negligible. Then the surface would emit 235W/m2 into the shell, until the shell is warm enough to emit 235W/m2 into space. Also it would emit 235W/m2 “back” to the surface. Big question: what happens now?
Will the surface receive 235W/m2 or original feed plus another 235W/m2 as “back radiation” and would this add up to a total of 470W/m2 energy budget? If so, we would end up with the same free energy dilemma already discussed.
In reality it is very simple. The surface emits 235W/m2 into the shell, the shell emits 235W/m2 onto the surface, which is a lump sum game. And that is what “back and forth” radiation always is.
The shell has two sides. It will emit half of 235W/m2 into space and half back to the surface.
E. S…..HEAT is fore radiation minus back radiation….so you are ‘sorta’ correct, back radiation doesn’t really ‘heat’ anything…the fore radiation does the heating…but, the back radiation is half the solution of the SB equation as to how much heat the fore-radiation can transfer to the cooler body…..
My money is on Jim G…
Willis analyzes the steady-state case in his Steel Greenhouse example. In the steady-state case, power inputs match power outputs exactly, and there are no more follow-on increases.
Anyone who has successfully made it through the first few weeks of an introductory thermodynamics course would realize this. It is apparent that you (and Anton) have not.
Excellent post.
Max Planck observed that for heat radiation and molecules to interact requires comparable dimensions.
High energy Gamma and X-rays have short wave lengths on the order of atomic and molecular dimensions and interact aggressively, sundering bonds and ionizing targets. (See attached chart.)
Lower energy UV with longer wavelength photons have only enough energy to displace electrons which then settle back and fluoresce by emitting lower energy visible photons.
Visible wavelength photons reflect/bounce back to human eyes or detectors. The spectral absorption lines produced by the unique molecular electron shells are similar to the crossover networks in stereo speakers that block/pass audio frequencies to the woofer, mid-range and tweeter.
Thermal IR photons are too long to interact with gas molecules and simple pass through.
When these thermal photons strike a solid surface, their radiative energy converts to kinetic/thermal energy raising the temperature of that solid. (Temperature is the KE of stuff.)
Those IR heaters mounted ceiling height heat the objects in their path below increasing those object’s KE and temperature. Those objects in turn warm the surrounding air through conduction/convection/radiation. (As discussed in my earlier Power Points.)
In the popular liter bottle experiments, the heat lamps directly heat the bottles which then warm the contents.
The Sun heats the Earth’s surface, the surface heats the air.
That CO2/GHG molecules even absorb/emit/warm from thermal photons is supported by neither theory nor evidence.
Nick:
I may be completely misunderstanding your statement, but from experience gained working for a company that manufactured trace gas detectors, I can confirm that of absorption of IR energy by certain gasses (including CO2, CH4, N2O, HFCs etc.) certainly does occur.
The detector is a broadband IR source followed by a narrowband filter (in the range 5um – 50um, depending on gas to be detected), a sample cavity then a pyroelectric sensor. Calibrated against a ‘standard air’ sample (N2 + O2), I can confirm that the sensor output falls in proportion to the concentration of absorbing gas in the sample.
I can’t reproduce the theory here ( Company I.P.) but I confirm that I have seen the evidence.
“That CO2/GHG molecules even absorb/emit/warm from thermal photons is supported by neither theory nor evidence.”
I would not propose the evidence in the link below as direct evidence, but it does indicate that, as Einstein theorized, matter can be created from photons. If so, it is not hard to conceive that there is some interaction, however slight, between IR photons and such molecules.
https://www.sciencedaily.com/releases/2021/09/210920152005.htm
“That CO2/GHG molecules even absorb/emit/warm from thermal photons is supported by neither theory nor evidence.”
Why do you continue to display your own profound ignorance here? 200 years of repeatable controlled laboratory experiments demonstrate that your statement is completely false.
Inexpensive commercial detectors as mentioned in Cyan’s response are an easy disproof of your claim.
We understand the theory very well too.
Nick Schroeder
“Visible wavelength photons reflect/bounce back to human eyes or detectors.”
This is not true.
Which should be an end to the matter.
First take any black body.
The visible wavelength photons are absorbed.
Nothing bouncers back to human eyes.
That is why a black body is black.
Second, take your human eye or detector.
How can it detect visible wavelength photons ?
Remember you just said they bounce of or reflect so the eye or detector could not possibly detect them.
The only reason they appear visible to you is because your eye absorbed them.
Nick Schroeder
“Thermal IR photons are too long to interact with gas molecules and simple pass through.”
Again not true.
You are confusing wave and particle theory for the convenience of your argument.
Consider an IR wave being emitted from a molecule how did something so big get inside there?
“When these thermal photons strike a solid surface”
A solid surface made of molecules too small for the IR wave too interact with, is that what you mean?
“That CO2/GHG molecules even absorb/emit/warm from thermal photons is supported by neither theory nor evidence.”
Nick, where do you get this sh!t from ?
Nick lives in a parallel universe that has different physical laws. He visits us occasionally.
“it seems likely that total water vapor in the atmosphere is decreasing or staying flat”
Nonsense. Closely correlates with temperature.

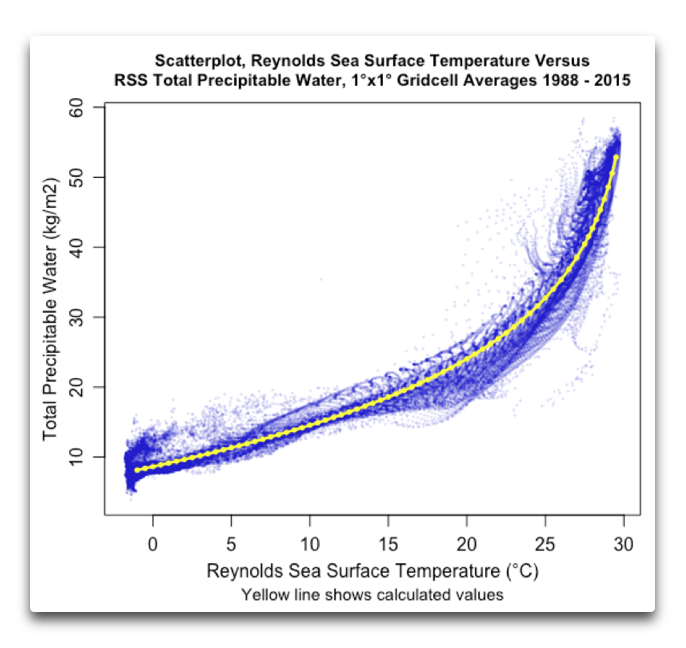
lgl, The RSS TPW is only over the oceans. To get global coverage you need to incorporate weather balloon data, which RSS ignores. More here:
Does Global Warming increase total atmospheric water vapor (TPW)? | Andy May Petrophysicist