by P Gosselin on 10. September 202
This year’s Arctic sea ice minimum reaches third highest level in a decade, latest data show.
Die kalte Sonne here presents its latest climate video. The first part looks at this year’s Arctic sea ice melt season. Now that it’s September, sea ice extent has just about reached its minimum for the year and soon the annual refreeze will begin.
We recall that years ago alarmist scientists and wacko activists, like al Gore, predicted an ice free Arctic by now. Today we look at the most recent data and we see that we are a very long way from that point.
Very slow August melt this year
What follows is the chart from the National Snow and Ice Data Center (NSIDC):

Chart source: http://nsidc.org/arcticseaicenews/
This year’s result is eye-opening: The German Die kalte Sonne site reports: “The Arctic sea ice is surprisingly stable” and “truly robust”.
Third highest level in 10 years
Die kalte Sonne also looks at the chart from the Alfred Wegener Institute (AWI) in Bremerhaven, Germany, where we see the September minimum ice level (15%) in 2021 is the third highest in the past decade:

Die kalte Sonne notes that we are still a long way from the once projected iceless Arctic – of the sort that climate-crisis bedwetter Al Gore predicted.
Ice volume same as 80 years ago
When one looks at Arctic ice volume going back 170 years, today’s levels are in fact very similar to those seen in 1940:

As the above chart suggests, there’s a lot more to ice volume at the poles than mean global surface temperature. Other cyclic natural factors, which man has absolutely no control over, are very much at play.
The 1991-2020 median line is still not shown on the website. I wonder why?
Antarctic sea ice extent was above its 1981-2010 median for yesterday’s date. Arctic sea ice was above its average for 2011-20.
No. The NSIDC Arctic (and Antarctic) Sea Ice charts are “interactive” in that they permit you to take a screen capture of the default Sea ice extents, the past decade’s trends, the past average, or any chose of one, all, or a selected number of years. Default is daily “median value” and +/- 1 quartile margins off of that value.
“Average” sea ice extents plots are available for selected decades, or for all years. If “average” is selected, the default quartile shades are blanked out, but +/- standard deviation lines are available as options.
Indeed, that is a very good interactive site.
Bill Toland
Not all people can manage to quickly introduce a new reference period.
Source
ftp://sidads.colorado.edu/DATASETS/NOAA/G02135/north/monthly/data/
This is what I was thinking, throw out the reference period at shown in the graph at the top of this page, and just take the last ten years, show me the average and the standard deviation on that. It looks rather tight to me, i.e., sigma (standard deviation) is not very large. (Even if the site is interactive, I hesitate to attempt doing this analysis myself, it’s likely beyond my feeble capabilities.)
Just remember.
If the aim is to scare people with “ice free “ the graph should show the zero
Yes, or at least show a break in the vertical axis to indicate the fact that zero is not shown.
It’s also the fourth highest in 15 years, ie 2007-21. Slightly higher years were 2009, 2013 and 2014. These followed the record low years of 2007 and 2012, during which more open water meant more heat lost to space. Similarly, last year’s minimum was about as low as in 2007, so a rebound was to be expected. Also low 2016, which saw two late summer cyclones, was followed by higher minima in 2017 and 2018.
Looks as if we’ll end up closer to 2018 than 2014, but still well above average for the past 15 years.
John, are you like me, hoping that a lot of the CAGW crowd gets on a “Ship Of Fools” and goes to check out the Arctic ice extent? Can you make friends with polar bears? Waiting for the videos.
Lewis Pugh is up to his swimming exploits again. Doesn’t seem to make the same headlines in the same way these days.
https://www.standard.co.uk/news/uk/lewis-pugh-swim-greenland-climate-crisis-b950087.html
He’s looking for free beer at the up-coming Council of the Parties #??
He would get as much attention eating a bowl of beans, soaking in a warm tub, and blowing bubbles for 26 hours.
“The polar regions and high-altitude glaciers are melting, and our collective survival is on the line.
“No ice, no life.”
Says an absolute idiot…. and/or liar .
P H U !
“Mr Pugh’s previous efforts in “Speedo diplomacy”, undertaking extreme swims in just trunks, goggles and cap as part of campaigns to drive action to help the environment, have helped protect vast tracts of ocean.” Eh ??
Who’s the biggest clown and liar, Mr Pugh or the “voices in his head” pseudo-journalist.
I ignore the monthly and annual wiggles. The approximate 70-year sea ice cycle is obvious in the historical data. It appears we are in the beginnings of the upswing portion of the cycle. But CliSciFi only sees the peak portion as reference for all things AGW. Lies, damned lies and government.
Amplifying your observation with Sept 10, 2021 data, Day of Year (DOY = 253: Expected Sept minimum still expected to be between Sept 15 and Sept 20 this year, right at the average for 42 years of the satellite record.
Sept 10 2021 = 4.831 Mkm^2 Sea Ice Extents.
Now equal to 2018 at this date, equal to or higher than 11 of the past 14 years (almost 1/3 of the entire satellite record!) going back to 2007.
Higher than the 2010-2020 average for this date.
About 1.5 million km^2 larger than the Sept 2012 sea ice minimum of 3.387 Mkm^2 – Or roughly 3/4 the size of Greenland MORE sea ice than just 9 years ago.
Continuing the observation with data from Sept 17 2021
DOY Date Extents (Mkm^2)
257 14 Sept 2021 4.734
258 15 Sept 2021 4.728
259 16 Sept 2021 4.724
260 17 Sept 2021 4.731
So, a slight rise up north in Arctic Sea Ice Extents, Sept 2021’s minimum may already be past us by the time you read this.
Down south? Antarctic Sea Ice is bouncing up and down significantly, still far too early to make any statements.
Aside, why is a tiny increase up north indicate a minimum condition, but a 1/4 million km^2 change around the Antarctic meaningless? Because the Antarctic does swing that much this time of year, and because the very, very early peak of Antarctic sea ice is so early that it is near-impossible to jump up and claim new record early sea ice maximum!
Even as early as the Aug 31-Sept 1 2021 Antarctic Sea Ice maximum was (or may be), September 2021 is still (right now) the fifth highest ever Antarctic on that date. Not a record for size, but 2021 would be the second earliest sea ice maximum ever during the satellite era. (1994 and 2016 now hold the earliest other maximums.)
There’s still a lot of ice there for the taking. In that sense, it’s ice free.
I’d rather call that “free ice”
Not falling for that one again! I never did get my “Free Nelson Mandela” back in the 80s.
Just more evidence the warming trend has stopped and a cooling trend may have began.
Or that there are no trends relative to the amplitude of natural cycles.
Two contributing factors:
1) The ice always comes back in the winter
2) The yearly average temperature is below freezing
“The reports of my death are greatly exaggerated”
Arctic Sea Ice.
Fourteen years ago, Jay Zwally said the Arctic would be “nearly ice free” in a few years. About the same time, Mark Serreze said the Arctic was “screaming.”
I see Mark Serreze occasionally, and he’s usually jovial. I wouldn’t dare ask him about his his Arctic screaming remark. I could be wrong, but I’d guess his jovial nature would turn to anger on a dime.
People who are that wrong when trying to scare folks should be reminded of their failed predictions. He has been and probably still is on the side of willing to harm poor folks by restricting energy.
It would not be the first time. Real world outcomes so often never penetrate the academy… even energy prices and food shortages which result in famine are immune:
Lysenkoism
Marxist–Leninist theorists presented Lysenkoism as a new branch of biology, arguing that “dialectic method shows that development is carried out in a dual form: “evolutionary and revolutionary.“
On August 7, 1948, at the end of a week-long session organized by Lysenko and approved by Stalin, the V.I. Lenin Academy of Agricultural Sciences announced that from that point on Lysenkoism would be taught as “the only correct theory.” Soviet scientists were forced to denounce any work that contradicted Lysenko.
State media published enthusiastic articles such as “Siberia is transformed into land of orchards and gardens,” “Soviet people change nature” while anyone opposing Lysenko was presented as a defender of “mysticism, obscurantism and backwardness.
https://en.wikipedia.org/wiki/Lysenkoism
If there is money available, governments can distort science anyway it chooses, and find “scientists” willing to go along with it.
I guess the psychology behind these scientists is the same as the psychology that drives people like Elizabeth Holmes (Theranos) and Bernie Madoff… “fake it until you make it”… and pray that the Arctic eventually melts. This may explain why a few days of Greenland melting makes CAGW scientists ecstatic… as a form of “psychological relief“, much the same way millennialist doomsday preachers interpret every small current event as a sign of the coming tribulation & rapture (or checking the Mega Millions lottery numbers).
It may interest you that some years after the start of Lysenkoism a soviet scientist from Belarus(forgot his name- begins with a B)
created the foundation(Co2 devil,arctic ice will disappear,yadda yadda) of AGW,
but it could not be used as the climate got colder and they started to push the ice age scare.
This is ta similar strategy the Bolsheviks used to ignite the communist revolution in china when they trained in the 1920ies in Moscow a specially selected group of chinese agitators (the 28 Bolsheviks) for this job.
The plans and framework existed many years ago.
Same with the woke people :Top Soviet propagandist Yuri Bezmenov warned about the systematic subversion and destruction of culture,country,family and the push towards nihilism already in the 70ies.
Feel free to connect with him. He’s in the Geography Department at the University of Colorado, Boulder.
That’s the critical issue in the Climate Emergency debate: regardless of whether it’s warming or not, by how much, and who’s responsible – the incontinent alarmists don’t care about the effect their final solution for the gentle warming of the past century would have on everyone. I would gladly put up with an extra 5°C of warming, pay for the seawalls, subsidize whatever mitigation projects necessary, etc. There result would be a warmer, more comfortable world, with long life spans (from the reduction in cold deaths exceeding increases in heat deaths (that can be reduced anyway through development) and more life springing in areas long frozen under the ice, or dried out by drought from not enough water vapour in the air.
The more I see and hear of this s*** the more I’m certain the “…effect of their final solution…” they consider a feature, not a bug. Ask any of them, many are already saying out loud they want to see an overall reduction in the Human population. See, they foresee the usual socialist result of a mass population of equally poor and miserable, with just a select elite in charge and living in luxury, with themselves as the elite living in luxury. Peruse their quotes long enough and you’ll find them saying the quiet part out loud.
Many “Experts” predicted the end of sea iceseveeal times (most famous Al Gore 2014 prediction in his propaganda piece “An inconvenient BS” )
All predictions turned out to be total failures just as sea level rise,extinct polar bears,more hurricanes.
So mr serreze is a top notch expert from an official point of view,
but please ask him next time:
How can arctic ice scream when it is no longer there?
At which size does it begin to scream?
How do we stop the screams?My idea would be to use the soot the climate experts who met dec 3rd at brown university wanted to use in 1972 to melt the arctic ice to save us from the ice age.
Sounds like a new Ben & Jerry’s flavor – Arctic Ice Scream
Sea ice screams when you Throw water on it…
AHHH … I’m melting … oh what a world, what a world
Not sure how they calculated sea ice thickness 100 years ago. These graphs are nice to look at and certainly look like they are accurate, but for the most part it’s all guessing. You can use certain things as proxies, but the Arctic is a very big place and measuring it accurately really is just using the three blind men and an elephant method.
I haven’t had time to read it yet, but the paper isn’t paywalled. It’s here:
https://tc.copernicus.org/articles/14/3479/2020/tc-14-3479-2020.html
Maybe they just went there and measured it
The First Fram Expedition (1893-1896)
Drilled holes and measured to the bottom of the hole, in every square kilometer across millions of square kilometers of sea ice?
Or estimated ice depth from a few seal holes?
If the surface of sea ice is flat, then the depth of the sea ice is ore or less constant.
Where you find ridges, the ice will be thicker.
Pathetic.
Go and read what Nansen discovered.
Yes, amazing think that “back then” there was such a thing known as “field science and data gathering” . . . but then again, “back then” they did not have the convenience of computers and, of most relevance, computer models.
Fridtjof Nansen’s book ‘Farthest North’ describes the voyage. Have only read volume 1 which ends in the Autumn of 1894. A fascinating and very detailed account of the journey and the research they undertook.
I was in Barrow in April 1967 and we used an auger to drill through the ice to determine the thickness. I’m sure the data made it into an internal CRREL report on the collaboration with NASA flying a microwave imager over the ice.
Close enough to show multi-decadal trends that put CAGW in its grave.
Has Gore apologised yet for his great deception for which he had the nerve to use the misnomer “An Inconvenient Truth”?. The world now knows that it was a long way from being the truth.
I hope that I’m around to see an Al Gore free planet.
Unfortunately not likely. As long as AIT exists AlGore exists.
Karloff is gone but the monsters survive
Cheney is gone but the Phantom survives
Cheney Jr is gone but the Wolf survives
Strange about Al Gore. Twelve years ago or so, he was all over the MSM talking about global warming. But over the past few years, I haven’t seen him mentioned in the MSM I come in contract with.
Yet he has website ( http://www.algore.com ) where he issues statements on things. He also has a Facebook page. The latest statement was dated August 9, 2021, on the IPPC report.
His comment apparently didn’t get much notice. Is he now yesterday’s news?
The fact that it isn’t the truth is inconvenient and he is in hiding.
Probably sitting in the basement of one of his homes counting his millions and giggling about how easy it was for him to hoodwink so many people.
But it’s one of several very nice basements paid for by government renewable subsidies.
100’s of millions of $ carbon trading
And all that vegan food he pushes….
You call that crap “food”?
Why should he apologize?
He was no millionaire before he started the scam,
now his net worth is 200mio +.
It was the best thing that happened in his life.
Gore has no clue about climate and it made him superrich.
Obama has no clue about movies and is being paid tens of millions to produce them.
Hunter Biden has no clue about fossil fuels and didn’t speak Ukraine but still became board member of burisma holding after Victoria Nuland started the war in Ukraine and after Biden removed Ukrains chief persecutor who went after the founder of burisma.
To kiss the right butts pays well .
This is known as remuneration for services rendered. Biden has been pretty upfront about what favors he exchanged for his cash (funneled through Hunter), the Clinton Crime Family can pretty much plot a one-to-one diagram of favors to foreign countries and contributions to the Clinton Foundation (some of which were payment for past favors Slick Willie did for the PCC, and others), 0bummers goth their NetFlix contract for all the favors he did for Big Tech while POTUS, but Al Gore’s are a little tougher to track. My guess is all the military contracts he directed to specific manufacturers during his time as VPOTUS, and probably while he was still a senator, too. I mean, he was pretty much broke still when he left his last elected office, so someone had to finance his Inconvenient Blunder movie and the Carbon Trading scam, as well as that TV channel he sold to Al Jazeera. But when he sold out of those or shut them down, he kept all the money that came in. How did that happen? Or, more appropriately, WUWT?
mind boggling that something so incredibly cyclical can stay >2sd below mean when temps in the arctic have been stone cold normal for the last 3 months
Ocean and Ice Services | Danmarks Meteorologiske Institut (dmi.dk)
There’s a mismatch of time periods involved, and some early satellite data is excluded making it even worse. If the early satellite data were used the decline in sea ice wouldn’t be so dramatic. That is, there is a certain amount of deception happening to create “the narrative.”
And the approximate 70-year period exists. The cherry pick of the peak in the cycle gave them CAGW. Additionally, radiosondes, satellites and ARGO prove the world is not warming as predicted by CliSciFi.
Lags are likely because of the incredible amounts of energy (in the range of 10^21 joules) to melt it in the summer, and the need for the absence of such heat to refreeze it in the winter. Takes awhile, and other factors (cloud cover, ocean currents, etc.) play a big role in variability.
the lags are known. Sea ice seems to bottom out, reliably, at the end of northern hemisphere summer. And peak, reliably, at the end of northern hemisphere winter. So it would appear the transfer of such huge amounts of energy is done quite effectively.
Wasn’t it the 2007 Arctic Sea Ice Minimum that was produced by not one but two Spring and or Summer arctic cyclones that blew all the ice into warmer waters, or broke it up, or something? In other words, the sea ice minimum was entirely due to wind and currents, not Global Warming™.
Not all that odd really. You see shifts like that in a lot of manufacturing data as populations with time-localized populations float within a larger range over longer times.
The meaning of cyclical is what?
“It will without doubt have come to your Lordship’s knowledge that a considerable change of climate, inexplicable at present to us, must have taken place in the Circumpolar Regions, by which the severity of the cold that has for centuries past enclosed the seas in the high northern latitudes in an impenetrable barrier of ice has been during the last two years, greatly abated.
(This) affords ample proof that new sources of warmth have been opened and give us leave to hope that the Arctic Seas may at this time be more accessible than they have been for centuries past, and that discoveries may now be made in them not only interesting to the advancement of science but also to the future intercourse of mankind and the commerce of distant nations.”
President of the Royal Society, London, to the Admiralty, 20th November, 1817 [13]
Thanks to John L. Daly.
The SUV’s the eskimos drove in 1817 must have been the worst climate polluters until the end of the ice age scare.
Right. Almost every “extreme weather” event hyped by the Lame Stream Media as a sure sign of Climate Change right before our very eyes, is actually not even a unique event. They all have happened before and they will happen again. Enjoy. Even an ice-free Arctic… been there done that, the Earth still exists and Life on it still thrives.
and right on cue, the people at NSIDC have artic ice declining faster than average. despite the previous 100 days of arctic temps being stone. cold. normal.
Wait, how does warming make more ice? Somebody has some explaining to do.
No, warm is cold is warm is more windy is more wetterer is an emergency! Just panic and pay up would you?
griff already explained this on the walrus thread. Although it taxed the limits of his science education, he told us in proper scientific terms that Arctic sea ice decline was taking a respite. Lazy Arctic sea ice decline has been goofing off since 2007 apparently.
Why does the left hand scale for ice volume not start at zero?
Does that mean they don’t truly expect the arctic to be ice free?
Or do they want it to appear ice free on the graph when there is still ice?
It’s an anomaly estimate. It makes the variation about a large, relatively stable number seem more significant.
…and you know it has to be true because look at the preciseness of that number that computer spits out! Why, don’t I see 7 digits to the right of the decimal? That’s got to be good. <do I really have to add the /sarc tag for anybody?>
Just for those dense enough not to understand why that’s sarcasm, it wouldn’t surprise me if they have no more than 2 significant digits. That 5.4 million could be anywhere from 5,350,000 to 5,444,449.
Most if not all AGW models & predictions made fifteen years ago claimed there would be almost no ice or “ice-free”… yet, that hasn’t happened.
Model failure.
Can anybody point to an AGW model that has been even relatively accurate?
Please provide that model… I’d take a look at it.
Can you cite your sources for this please? In their 2007 report the IPCC stated:
[IPPC, 2007, WGI, SPM, PG. 15]
The consensus view 15 years ago was that summer sea ice in the Arctic would survive until the latter part of the 21st century at least.
“Most if not all AGW models & predictions made fifteen years ago claimed there would be almost no ice or “ice-free”…”
Another myth.

NO they ABSOLUTELY did NOT …..
https://nca2014.globalchange.gov/report/our-changing-climate/melting-ice#graphic-16705
Look at your Observed line compared to your RCP lines.
I meant to finish with –
With the benefit of hindsight, any models can be made to look prescient.
Can you cite your sources for this please?
When Gore said, in 2008, that the Arctic would be ice-free in five years, he was strident in quoting Professor Maslowski’s model work, which you can read here and elsewhere too if you have time and interest in TFN and Banton’s cover up lies:
https://calhoun.nps.edu/bitstream/handle/10945/55142/The_Future_of_Arctic_Sea_Ice.pdf?sequence=1&isAllowed=y
I suggest you go straight to Figure 9., and read from there on.
Stop trying to cover up the lies and deceit in hindsight. Did you come out and quote the paper you now quote then when everyone was being lied to by Gore and Maslowski. Nope.
Alarmists like Banton are now busily rewriting History to cover up their failed predictions.
Yep, a bunch of passive aggressive toadies.
If Maslowski’s 2016 prediction, which BTW is described as the lower bound in that publication, were the only prediction available then I think you might have a point in challenging Banton’s statement that the claim “Most if not all AGW models & predictions made fifteen years ago claimed there would be almost no ice or “ice-free” is myth. The thing is…not only is it not the only prediction available, but it isn’t even considered credible by most scientists and certainly does not represent the consensus at the time.
Show me an example of this from the 2008 to 2012 era when toadies like you were just kissing arse and telling people to wet the bed over the weather.
You can’t do it. You can’t show any example of people denouncing fat Albert, and Maslowski’s work being a pile of wombat sh!t, even though every real scientist knew it.
I was posting such on here back then, maybe you can quote me in your response?
Maslowski himself said the linear extrapolation to 2016, which BTW was specifically called out as a lower bound only, was not credible due to modeling uncertainties.
Here’s a good definition of toady, i.e. you:
https://www.vocabulary.com/dictionary/toady
You originally stated that “most if not all AGW models & predictions made fifteen years ago claimed there would be almost no ice or “ice-free”…”
You provide a single example and even that doesn’t state what you say it does. Check any IPCC projection for Arctic sea ice extent decline going back however far you like. None of them predict ice-free summer conditions in the Arctic before the second half of the 21st century.
https://www.youtube.com/watch?v=8jneVGxGEtY
There’s that statement, a sentiment echoed two years after Al Gore said the same based off of:
http://news.bbc.co.uk/2/hi/7139797.stm
Why do you consider John Kerry and Al Gore and their predictions to be credible?
If I could be bothered, I could probably find 100 examples of scientists who promoted that sh!t, and so could TFN and Banton, It’s just easier to be compulsive liars when you were born that way.
Ha ha ha you toady useful idiots have now become apologists for the last 20 – 40 years of climate lies and deceit. It ain’t gonna get any better for you. You still won’t be able to find any evidence for what your idiot tribe believes or pretends to believe for the next 20 – 40 years either.
This is a lie:
https://extinctionclock.org/
No matter what it is, some alarmist somewhere has stated it. So the trick is to find the one or two alarmists who said something that sounds like what actually happened, then proclaim that this was the consensus opinion, and everyone who disagreed was just some no name crank.
Intellectual dishonesty.
It’s all they have.
As a matter of fact, yes: https://www.thegwpf.org/content/uploads/2017/02/Curry-2017.pdf
Loss of sea ice just means more heat escaping to space. One of the strong negative feedbacks that helps to keep the planets climate stable.
Sorry, but that renowned scientist John Kerry disagrees. See Mark Stevens’ link above.
My next door neighbours eleven year old has a model that has been 100% accurate for the last ten years but doesn’t want to share it. Sorry.
Some models age gracefully.
Some need plastic surgery.
It’s the opposite. Predictions have not kept up with the rate of sea ice decline in the Arctic. For example, in 2001 the IPCC predicted that annual sea ice extent in the Arctic would not decline below 10.5e6 km2 until 2040. It first happened in 2007 a full 33 years ahead of predictions and has occurred several times since. Today the IPCC prediction of the first ice free Arctic summer is not until 2050 (IPCC AR6 WG1 SPM pg 20).
Just keep pushing the goal posts forward, no one will notice.
Wrong, in AR6 IPCC state before then.
”The Arctic is likely to be practically sea ice free in September31 at least once before 2050”
Gore got it wrong, more than likely IPCC will too.
I agree. That comes from IPCC AR6 WG1 SPM pg 20.
I agree. Gore definitely got it wrong.
Woops, wrong place.
You know the ice is much thicker than expected because not a single ship made it across the Northern Sea Route this year. And, contrary to what the alarmist have been saying, the Northwest passage remains closed.
I thought it was due to covid. /s
Really, the data doesn’t bear that out:
https://arctic-lio.com/nsr-shipping-traffic-activities-in-july-2021/
As should be obvious by now, facts don’t matter, we are going to get dysfunctional unreliable power, dysfunctional inefficient transportation systems, and broken economies anyway. Science doesn’t matter when hyperpartisan bureaucrats declare “the science says”.
“Temporary” COVID restrictions have been a test for permanent climate change restrictions, and the populations of the “developed countries” proved they will readily comply.
You’re exactly right. After they’re done “vaccinating” infants and children, they’ll go for fetuses in the womb and maybe even ova of potentially birthing people.
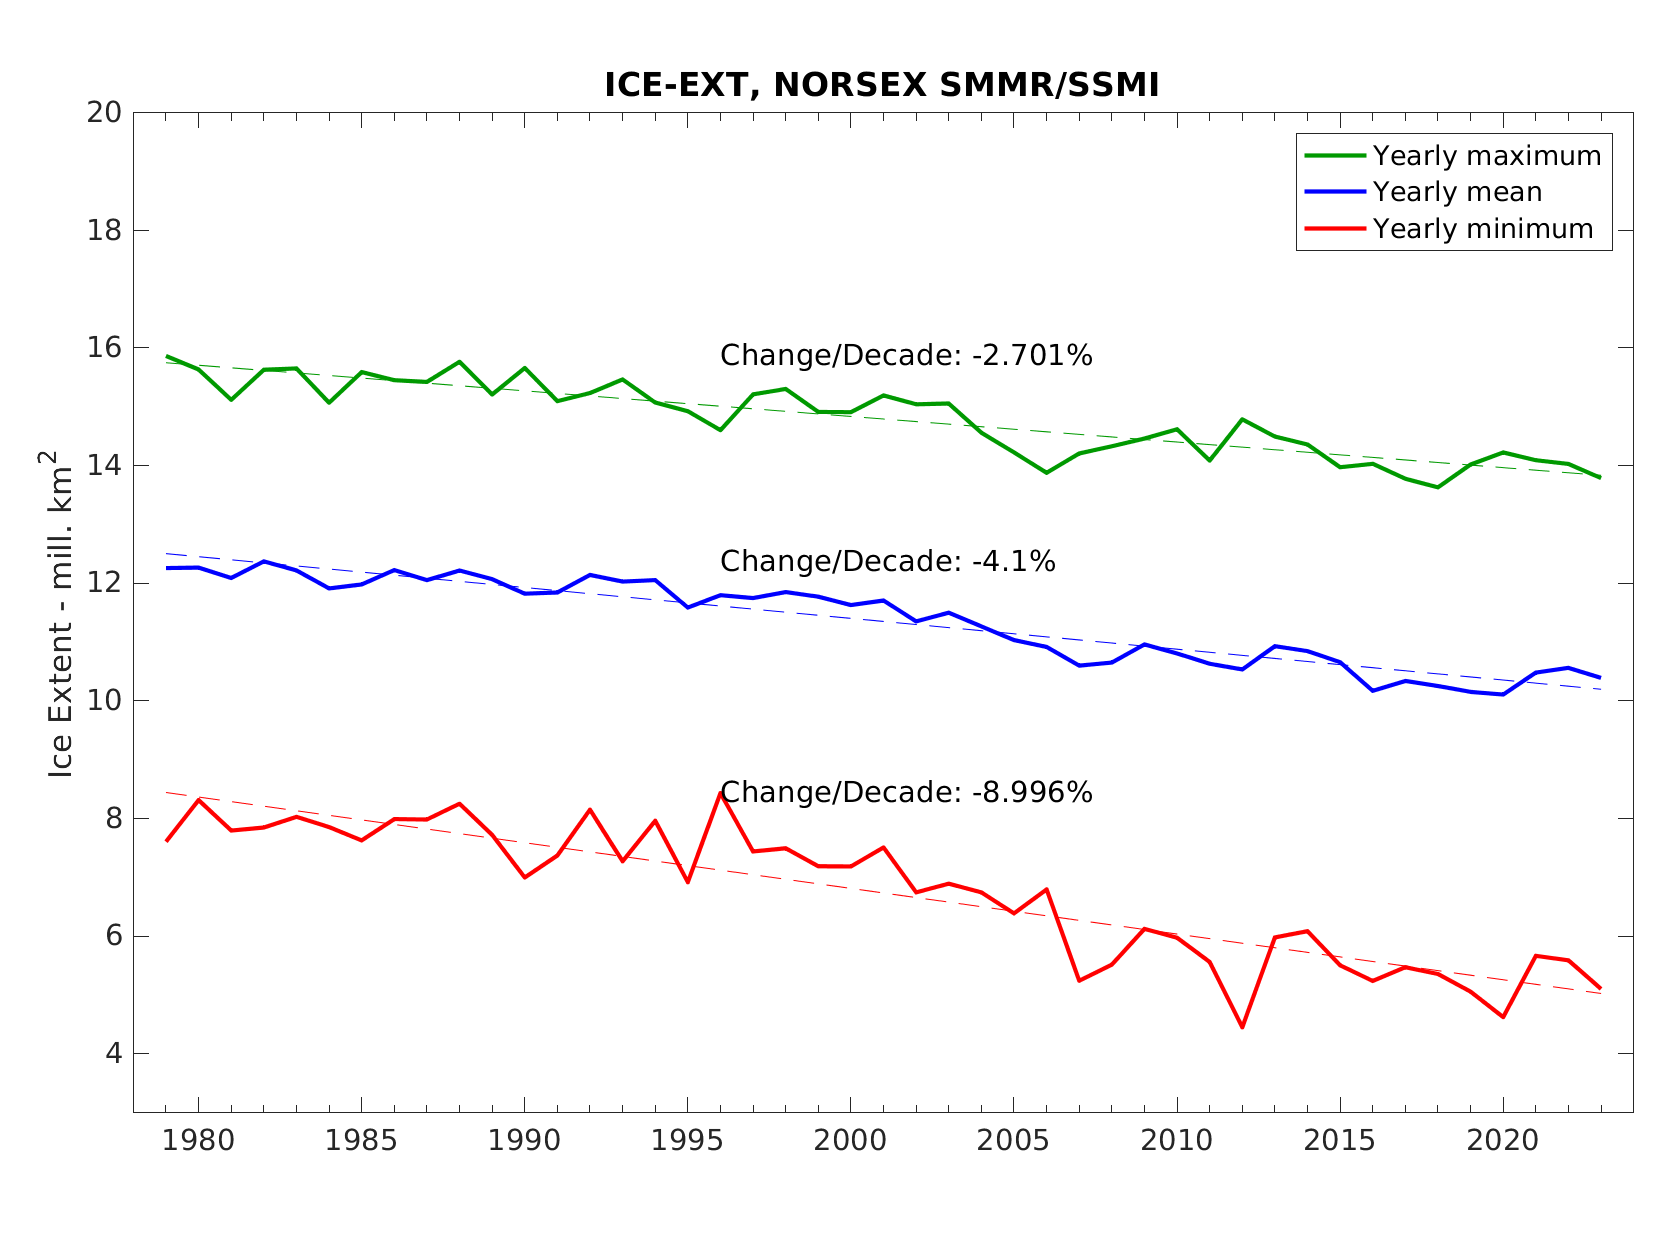
Not stalled at all – take the august figures, as set out on NSIDC website:
Through 2021, the linear rate of decline for monthly mean August sea ice extent is 10.4 percent per decade (Figure 3). This corresponds to 75,000 square kilometers (29,000 square miles) per year. The cumulative August ice loss over the 43-year satellite record is 3.15 million square kilometers (1.22 million square miles), based on the difference in linear trend values in 2021 and 1979. The loss of ice since 1979 in August is equivalent to about twice the size of the state of Alaska.
The ice continues to decline in age thickness and volume.
Even though the ice is failing to melt as predicted. Don’t worry, if you squint your eyes and only look at this tiny subset of the data, you will see that the ice is melting as predicted.
“Even though the ice is failing to melt as predicted.”
Maybe as “predicted” by idiots such as Wadhams

But not as the IPCC has ….
Spam your graph a few more times, maybe someone will care about it.
Banton accuses Professor Wadhams of being an idiot.
Bio from the Cambridge University website:
Peter’s first degree was a BA (Hons.) in Physics at Churchill College, Cambridge. While at college he was an assistant on the “Hudson-70” Expedition, an 11-month Canadian cruise which accomplished the first circumnavigation of the Americas. This included multidisciplinary oceanographic and marine geophysical work in South Atlantic, Antarctic, Chilean fjords, S and N Pacific, Beaufort Sea and NW Passage.
From 1970-74 he studied for a PhD at the Scott Polar Research Institute, University of Cambridge on “The effect of a sea ice cover on ocean surface waves”. His PhD was awarded in April 1974. From 1974-75 Peter was a postdoctoral fellow at the Institute of Ocean Sciences, Victoria, B.C., Canada, working on sea ice structure and dynamics in the Beaufort Sea and the impact of oil spills.
In January 1976 Peter returned to Scott Polar Research Institute, University of Cambridge, initially as a Senior Research Associate (Principal Investigator for Office of Naval Research). From 1981 he was an Assistant Director of Research; from 1987 to 1992 Peter was Director of the Institute. From 1992 he was a Reader in Polar Studies, and in 1994 was awarded a ScD (Cantab) for published work. Since 2001 he has been Professor of Ocean Physics.
In January 2003 the Sea Ice and Polar Oceanography Group moved to the Department of Applied Mathematics and Theoretical Physics, University of Cambridge – with an observational science section based in the Scottish Association of Marine Science (SAMS) at Dunstaffnage Marine Laboratory (DML), Oban, Scotland.
Peter has also held the following visiting positions:-
1980-81. Office of Naval Research Chair of Arctic Marine Science, Naval Postgraduate School, Monterey, California.
1987-88. Cecil and Ida Green Scholar at Institute of Geophysics and Planetary Physics, Scripps Institution of Oceanography, La Jolla; and Walker-Ames Professor, University of Washington, Seattle. Further visits to Scripps in 1988-9 and 1989-90, working with acoustic tomography group (Walter Munk) on effect of sea ice on acoustic travel time changes.
1995. Invited Visiting Professor, Arctic Environmental Research Centre, National Institute of Polar Research, Tokyo, Japan.
1996-7. British Council – Monbusho Visiting Professor at Graduate University of Advanced Studies, Tokyo, Japan, based at National Institute of Polar Research. Further visits undertaken in 2000-1 supported by Royal Society grant for developing Anglo-Japanese collaboration in Arctic marine science.
1983-93. Senior Research Fellow, Churchill College, Cambridge.
HONOURS
1971 Bronze medal, Goverrment of Canada, for being one of six to complete “Hudson-70” circumnavigation.
1977 W.S. Bruce Prize, Royal Society of Edinburgh, “for oceanographic investigations and for studies of pack ice behaviour near Spitsbergen, the North Pole and off East Greenland”.
1983 Elected Fellow of the Arctic Institute of North America “in recognition of significant contributions to the knowledge of the polar and sub-polar regions”
1987 The Polar Medal (presented by H.M. The Queen)
1990 Italgas Prize for Research and Innovation in Environmental Sciences, Turin. Currently member of Club Premio Italgas, organising research network on sustainable development.
Banton is correct: Wadhams IS an idiot, but an extremely well qualified one!
As every good warmunist knows, the only thing that impacts arctic ice level is CO2 levels.
I just love the way they take the big drop in 2012 that was caused by a huge late season storm and assume that it was part of the trend, while completely ignoring everything that has happened since.
Then again, it’s not like they ever pretended to be intellectually honest.
It is melting faster than predicted. In 2001 the IPCC predicted that annual sea ice extents in the Arctic would not drop below 10.5e6 km2 until 2040. It first occurred in 2007 and then several times since.
Sea ice melts every summer, you silly person.
So what does this tell you about the prediction skill of their models?
It means there is more work to be done in terms of modeling. It’s not just Arctic sea ice either. There is the mid troposphere tropical hotspot as well.
Well, as with arriving at a usable ECS number, if these ‘critical’ climate characteristics haven’t been settled with ~ 40 years of scientific research, maybe it’s time to conclude that the “CO2 climate control knob” conjecture is an epic fail (as the youngsters say).
Better get busy, and get a bigger comp while you are at it.
So it disappeared years ago, and nobody noticed?
I never said anything about it disappearing.
Carefully avoiding saying what you do not want to say is hardly to your credit.
I don’t want to say it disappeared years ago because it didn’t disappear years ago.
Peak ice occurred around 1979 from the 2nd graph, and it was unusually high at that time. So you are a lying cherry-picker. Typical Leftist liar.
Note that the “global cooling” scare was because of temperatures dropping between 1940 and the 1970s. The 2nd graph matches that.
I doubt scientists were panicking over the less-than 0.1 degree drop shown by current IPCC graphs. The scientists were concerned with much greater temperature drops, but the Climate Change grifters flat out changed the past measurements to agree with their lies and cover up the fact that current temperatures are similar to those in the 1930s. Until your sources admit that the temperature drop was eliminated to promote their scam, then their credibility is zero.
“Until your sources admit that the temperature drop was eliminated to promote their scam, then their credibility is zero.”
I agree with that. Ignoring the real temperature record is not climate science.
Our alarmists are bedazzled by the Hockey Stick. They live in that false reality, not the real one, where it was just as warm in the last century as it is today..
We just need to recover all those satellite photos from the 1930s and we would instantly see, the current level of sea ice is quite normal. Maybe even above “normal”. <Once again, do I need to…?>
1979 was the most recent maximum. For some reason (deception), the “experts” like to begin their charts at maxima or minima depending on what narrative they want to promote.
For instance, wildfire acreage in the U.S. is down by about 90% from the 1930’s, so instead they start charts at a recent minimum in the 1960’s. In just a few days in 1871, the acreage burned was comparable to that over the entire year of some recent seasons.
Another reason might be that satellite records only begin in 1979. Can you cite your source showing that 1979 was the most recent maxima?
The satellite record actually began in 1972.
One reference is:
https://agupubs.onlinelibrary.wiley.com/doi/abs/10.1029/JC094iC10p14499?casa_token=xmIhWuAPYT0AAAAA%3AUx2yj0WAWXU8xkcXP1LUPpzcvneHoffe_rz8WuT1rUnH1h_qDpNXyAk0j2DAGfaQxrrjwgKjPO_Yjynv
You don’t have to be a compulsive liar to be leftard climate craptrap spewer, but it obviously helps. You’ve been on here long enough to know that the satellite record began in 1972. Why don’t you plot it? It might help you with some kind of rehabilitation:
https://seaice.uni-bremen.de/data/amsr2/today/extent_n_19720101-20191231_amsr2.txt
We just need to recover all those satellite photos from the 1930s and we would instantly see, the current level of sea ice is quite normal. Maybe even above “normal”. <Once again, do I need to…?>
[Mods, will I get blocked for repeating my own comment?]
You’ll only get blocked if you go fishing for a cheap laugh twice in one thread! Oh, wait…..
Satellite records extend back at least as far as 1972. They show Arctic sea ice was much less in the early 1970s than that of the period beginning about 1976.
Less arctic sea ice just means more heat being lost to space. When the planet cools enough, the sea ice will recover.
No big deal.
The only ones claiming to panic are those who are pushing an agenda.
How do you suppose the planet will cool with the planetary energy imbalance sitting at +0.8 W/m2?
If that number was accurate, and all that mattered, then we would be seeing 10 times the warming that has been seen.
The climate system is accumulating about 14e21 joules energy each year. That comes out to +0.87 W/m2. 10x that would be 140e21 joules per year. 140e21 j / 31556952 s / 510e12 m2 = +8.7 W/m2.
Except all of that happened more then 10 years ago, since then nothing. 1979 was a high during the last 100 years. Griff I am still waiting on your explanation of how the 2 great tsunamis of were caused by global warming, since by the logic you use that’s the only possible cause.
And when I was born I was 18″ tall, now I am 72″ tall, therefore in another 50 years I will be 150″ tall.
Ah, how easy it is to fool the simps.
Griff when are going to take the ice free North Pole bet, it’s been almost 5 years since I first asked and when you and Tony Mcloud said the the next year would have an ice free North Pole. He took that bet and is gone now, when will you?
Griff has no shame.
Stop lying Griff.
What happens if you use your eyes to have a look the charts ? What do you see ? 😀
Thanks Griff. As always when you say something we can take comfort knowing that the opposite is true.
I note this article has been fact checked by our griff…
Same old unsubstantiated tosh
Indeed, and as usual for “fact checkers” his verdict is the opposite of the objective truth.
Just look at the increase in Arctic sea-ice extent between 2012 and today, as documented in the above article’s first graph. I view this as just one more indication that Earth may have already entered into a long-term cooling interval, potentially of the severity of the “Little Ice Age” that occurred from the 16th to 19th centuries.
Other supporting scientific evidence of such:
— the increasing frequency of measured global warming “pauses”
— the increasing severity of cold and winter episodes
— the mathematical overlaying of various established natural cycles, from multi-decadal cycles in ocean circulation/temperature patterns to long term solar cycles to Milankovitch cycles of Earth’s variable orbital ephemeris as such determine solar insolation at TOA and differential heating between NH and SH.
As for Al Gore’s prediction about the iceless Arctic: pfffffthpt!
Ice volumes before the 1920’s are wild guesses based on a limited number of ship’s logs, and between then and the satellite age is an extrapolation of maritime captains’ radio weather reports. Even the early satellite numbers are the result of eyeball assessment of black and white photos from outer space of a planet with 65% cloud cover and icy parts totally in the dark….
We can rest assured, the death spiral is going to start any year now. At least that’s what the trolls keep telling us.
The warmists quit doing the sea ice death spiral graph about 2017 since it no longer matched their narrative. Here was their projection…
and actual…pretty embarrassing prediction really
“Here was their projection…”
Please link to the “projection” and/or show where that graph came from.
Oh, it’s from an anonymous Blog! ….
https://deepclimate.org/2012/10/04/2012-arctic-sea-ice-minimum-part-3-arctic-sea-ice-death-spiral-continues/
In the opposite sense as this one.
SO not a “projection” by climate scientists at all.
You just Googled and came up with a graph from a Blog called “Deep climate” by one ….
“I am a Canadian citizen residing in Canada. For private and professional reasons, I prefer to remain anonymous to the general public, at least for now.
The following facts may be relevant, however:
From late 2011 until last year, I was largely preoccupied with a life-threatening illness, proceeding through lengthy stages of diagnosis, debilitating treatment and very slow recovery. But I hasten to add that my prognosis today is very good, and I feel very lucky and grateful indeed.”
Shall I list the “projection/predictions” made on here by “Sceptics” ?
This is climate science’s Projections for Arctic sea-ice decline.

(for the 3rd time on this thread)
And You’re welcome!
Spammer.
Anthony, since you cast aspersions on someone else’s contributions of perspectives on climatic effects, can you point us to any of your original contributions on these topics please?
Given that IPCC contributions are sanitized line by line for political consensus before publication.
That second graph looks to capture it to me but, if you think there’s something wrong with the data accession, feel free to replot it and post.
…… or you could always do a diversionary distraction crap post as you seem to be a one trick pony.
Hint: It’s not a very good trick.
Ohh…you didn’t look too hard….there are dozens of pre-2017 death spiral graphs, from places like WSU, but most are published on blogs like “scientistswarning.org”
So thank you….you are confirming my point….what the media exposes to the public, is message-spun sciency looking blogojunk.
Self praise is no recommendation.
A dishonest graph from a dishonest troll.
The graph takes the huge loss in ice that was caused by a late season storm in 2012, and assumes it must be part of the trend.
The graph totally ignores everything that has happened since 2012.
At least griff doesn’t put up large graphs every time he repeats his lies.
And the Antarctic sea level is above the 30 year average
Antarctica has got 2 degrees COLDER since 1980.
Citation please
“Diagram showing area weighted Antarctic ( 70-90oS) monthly surface air temperature anomalies (HadCRUT4) since January 2000, in relation to the WMO normal period 1961-1990. The thin blue line shows the monthly temperature anomaly, while the thicker red line shows the running 37 month (c.3 yr) average. The year 1957 was an international geophysical year, and several meteorological stations were established in the Antarctic because of this. Before 1957, the meteorological coverage of the Antarctic continent is poor. Last month shown: June 2021. Last diagram update: 12 August 2021.”
https://www.climate4you.com/Polar%20temperatures.htm#AntarcticMonthlyTempChangeSouthOf50S
To be fair it was wrong to pick 1980 as a starting point as it was one of the lower dips on the graph. Your graph leaves out the last 3+ months which saw colder than average temps across Antarctica. There was a surface temp of minus 100 F in July, and the lowest temps for the last 100 days ranged in the high 90s F for most of that period.
I find this absolutely hilarious. If you were to provide him the citation, his only response would be, “On, that’s been debunked.” No responding citation, no nothing, just the assurance, you must believe me and not your own damn lying eyes!!!! “What a world! What a world!”
It took a little dip this last week, but still above 1979 levels.
Sea Ice extents value actually, rather than “Antarctic Sea Level.”
BUT! But ten years have a higher Antarctic Sea Ice Extent value than 2021 o this date (Sept 13 2021, DOY 256), but this year’s Antarctic Sea Ice extents is well over the quartile and decile (and Std Dev) of the average for this date. And all of those ten years are “recent” – today’s levels though are under those of 2013 and 2014 – when Antarctic Sea Ice areas exceeded the average for those years by an area larger than the entire area of Greenland.
Arctic sea ice is not stable at all over the last decade.
That is easy to observe on Wattsupwiththat own sea-ice reference page.
https://wattsupwiththat.com/reference-pages/sea-ice-page/
The last five years have clearly much less sea ice than the previous five.
This article gives a false impression of stability by comparing the outlier year 2012 with the last five years. 2012 had exceptionally low area of summer ice.
/Jan
Every single year since 2012 the September minimum is higher than the 2012 minimum, which means NO decline trend since then.
Special weather conditions made summer minimum exceptional in 2012.
A good graph is found here:
/Jan
Ah, the old trick of starting the graph in 1979, at the peak of the Arctic ice extent. Of course, ice extent was far smaller than that earlier in the 20th Century
Give up, chum – you’ve been rumbled.
The graph start in 1979 because we have good data from that year. Nobody knows for certain the. ice coverage before 1979.
This graph clearly debunks the claim that there has been no reduction over the last decade.
/Jan
False. This year’s Arctic Sea Ice extent is higher than 11 of the past 14 years (as of Day 253). Your statement “clearly debunks the claim that there has been no reduction over the past decade” is false. Arctic sea ice extents have RISEN the past decade – and longer (back through 2007), and today’s Arctic Sea Ice trend has been steady for nearly 1/3 of the entire satellite record.
I specifically started at year 2012, you revert to year 1979, thus you didn’t address my point at all.
You also didn’t acknowledge that it has never been that low ever since which indicate no more decline since 2012,
‘No decline since 2012’ is not correct because it only takes the melting minimum into account.
Correct is to compare complete yearly balances including ice rebuild phase during winter and spring.
And here you see what happens with 2002 when considering full year averages (Mkm²):
2016: 10.16
2020: 10.18
2019: 10.21
2018: 10.35
2017: 10.40
2012: 10.42
2007: 10.50
2011: 10.51
2015: 10.59
2010: 10.73
2006: 10.79
2014: 10.81
2013: 10.92
2005: 10.93
2009: 10.96
Simply because 2012 was in fact a very icy year, as you can see:
https://wattsupwiththat.com/2021/09/11/stalled-september-arctic-sea-remains-surprisingly-stable-over-past-decade-long-way-from-predicted-ice-free/#comment-3339763
2002 has been even a little bit above the reference period’s mean during spring, and was above mean in the Antarctic during nearly the whole year.
We will see how 2021 behaves in the yearly sum. With 11.4 Mkm² on day 251, it is a bit below 2012 with 11.5 Mkm².
By the way, 1979 is by no means the peak in Arctic sea ice extent when we look at HadISST1 ICE:
Source
https://www.metoffice.gov.uk/hadobs/hadisst/data/download.html
Exactly. We still have a lot of 2021 left and I suspect it’ll easily be above the record low years of 2016, 2019, and 2020, but we cannot yet eliminate the possibility that it will still end lower than 2012.
From the article: “When one looks at Arctic ice volume going back 170 years, today’s levels are in fact very similar to those seen in 1940”
That would make sense since both time periods experienced equal warmth. It was just as warm then as it is today.
I hope the build up of Arctic sea ice is slow this year as it was last year because I think that could be a reason for the north Atlantic ocean cooling. The freeze up has been very rapid following the low Arctic sea ice minimums we have experienced in the last twenty year. Is it now starting to slow down?
” I hope the build up of Arctic sea ice is slow this year as it was last year because I think that could be a reason for the north Atlantic ocean cooling. ”
I think exactly the contrary is the case.
The more ice melts, the more the ocean cools: like an ice cube in your whiskey glass.
And the more the ocean cools, the more atmospheric perturbations can develop over it.
Exactly what we are increasingly experiencing since years in Northern Germany.
Is there a lot of oil spill into the Arctic since WWII? North Slope and Siberia oil have come on stream since then. It might be worth checking the rivers for sheen.
JF
No.
The graph is not from the paper.
That is very misleading.
Don’t do warmist stuff.
Indeed.
https://tc.copernicus.org/articles/14/3479/2020/tc-14-3479-2020.pdf
Difficult to see the point of the paper to the article, especially as it utilises the dastardly Modulz
Reading glasses time. It’s Figure 1(b).