Reposted from Dr. Judith Curry’s Climate Etc.
15 minutes
Posted on September 3, 2021 by curryja |
by Judith Curry
In a recent invited talk at the American Chemical Society annual meeting, I attempted to explain the climate debate in 15 minutes.
This talk was given in a session on sustainability. Other invited speakers included James Green (NASA Chief Scientist), Marilyn Brown (Georgia Tech) . Our talks were followed by a panel discussion. This was an extremely interesting session, but was not recorded owing to an ACS glitch (you can read the abstracts at the link above).
Ok, with the new word press editor, no idea how the ppt file will show up. Below is the text of my remarks.
Slide 2 IPCC
The climate crisis can be summarized as:
- Its warming
- The warming is caused by us
- Warming is dangerous
- We need to urgently transition to renewable energy to stop the warming
- Once we stop burning fossil fuels, sea level rise will stop and the weather won’t be so extreme
A few weeks ago, the Intergovernmetal Panel on Climate Change, or IPCC, issued its 6th Assessment report. In response, the secretary general of the UN stated that
“This is code red for humanity.”
Slide 3 what’s wrong with this narrative
In my talk today, I’m going to present you with a different perspective on the climate change problem and how we can approach solutions.
So what’s wrong with the crisis narrative? It is my assessment that
- We’ve vastly oversimplified both the problem and its solutions
- The complexity and uncertainty surrounding climate change is being kept away from the public and policy debates.
- Rapid reductions in emissions are technologically and politically infeasible on a global scale
- And it overemphasizes the role of climate change in societal problems, distracting from real solutions to them.
Slide 4 97% consensus
Even people that don’t know much about climate science have heard that 97% of climate scientists agree. But exactly what do they agree on? Not nearly as much as is portrayed in the media. Everyone agrees that:
- Surface temperatures have increased since 1880
- Humans are adding carbon dioxide to the atmosphere, and
- Carbon Dioxide and other greenhouse gases have a warming effect on the planet
However, there is disagreement on the most consequential issues:
- How much of the recent warming has been caused by humans
- How much the planet will warm in the 21st century
- Whether warming is ‘dangerous’
- And how we should respond to the warming, to improve human well being
Slide 5 21st century warming
For policy making, the most consequential issue is how much warming we can expect in the 21st century. This figure from the latest IPCC report shows climate model simulations of global surface temperature anomalies over the 21st century. There’s a large range of warming shown in this diagram, from 1.5 to more than 4 degrees centigrade above pre-industrial temperatures. We’ve already warmed by about 1 degree centigrade, so whether the future warming is on the low or high end has huge implications for climate policy. The largest amount of warming is associated with an extreme emissions scenario, SSP-8.5.
These simulations should not be regarded as predictions for the following reasons:
- First, and most importantly, the IPCC does not include future scenarios of natural climate variability. These include solar variability, volcanic eruptions and multi-decadal ocean circulation patterns.
- Second, the IPCC does not assess the plausibility of the different emissions scenarios
Slide 6 Emissions scenarios
There are two primary factors that contribute to this large range of temperatures for the 21st century. The first is the emissions scenarios, which determine how much CO2 is added to the atmosphere, these are indicated by the SSPs. The second factor is the sensitivity of warming to a given amount of added CO2.
On the previous slide, recall that the largest amount of warming was associated with the emissions scenario SSP-8.5. The IPCC 5th Assessment Report regarded the 8.5 scenario to be our most likely future, and it was referred to as the business-as-usual scenario.
However, its becoming increasingly apparent that the 8.5 scenarios are implausibly high. The two lines at the bottom of this figure show projections of emissions made by the International Energy Agency out to 2040. The higher projection shows the expected emissions based on current policies, and the lower projection is based on current commitments under the Paris Agreement. Both of these show fairly steady emissions through 2040, that are much lower than the 8.5 scenarios.
Nevertheless, the most recent IPCC report emphasizes the 8.5 scenario. Not surprisingly, this extreme emissions scenario is the source of alarming impacts.
—-
The second major source of uncertainty is the sensitivity of the global temperatures to a doubling of CO2. For decades, the likely range for climate sensitivity has been between 1.5 and 4.5 degrees centigrade, which is reflected by the assessment from the IPCC AR5 published in 2013.
The red bars in this figure shows the range of climate sensitivity from the most recent climate model simulations. The sensitivity values range from 1.8 to 5.7 degrees, and overall are much higher than those from the AR5, whose highest value was 4.6 degrees
The IPCC AR6 substantially narrowed the likely range of climate sensitivity to between 2.5 and 4 degrees, rejecting the highest values from the climate models. However this narrowing of the range is disputed, particularly on the low end. The whole issue of climate sensitivity to CO2 remains unsettled, with a high level of uncertainty.
The bottom line here is some good news. The extreme tail risks from global warming, associated with very high emissions and high climate sensitivity, have shrunk and are now regarded as unlikely if not implausible.
Slide 7 Is warming dangerous
The next area of disagreement takes us away from science and into the realm of values. How dangerous is global warming? The IPCC 5th Assessment Report used a burning embers diagram to portray reasons for concern. The level of concern increases with the amount of global warming. Note that the IPCC does not use the words ‘dangerous’, ‘crisis’ or ‘catastrophe’ in its report; rather it uses ‘reasons for concern.’
Any evaluation of dangerous climate change must confront the Goldilocks principle. Exactly which climate state is too hot versus too cold? Some answer this question by stating that the climate we’re adapted to is ‘just right’. However, the IPCC uses a preindustrial baseline, in the late 1700’s. Why anyone thinks that this is an ideal climate is beyond me. This was during the Little Ice Age, the coldest period of the millennia. Think George Washington and the horrible winters at Valley forge.
While the categories of concern in the burning embers diagram seem a bit nebulous, the 6th assessment report focused on extreme weather and climate events. Lets take a look.
Slide 8 Extreme events
The recent IPCC report did not detect any global trends in flooding, meteorological or hydrological drought, winter storms or tornadoes. Trends were identified in heat waves, heavy rainfall events and fire weather.
The report concluded that it is likely that the global proportion of major hurricanes has increased over the last four decades. Global hurricane data supports this conclusion. However, there’s a large amount of natural variability in hurricane activity.
The diagram on the left shows the number of major hurricanes that have struck the U.S. since 1900. The year 2005 stands out as the highest, which was followed by a period of 11 years with no major hurricane landfalls. Also, there were a large number of major hurricane landfalls during the first half of the 20th century, when surface temperatures were significantly cooler
The large amount of natural variability makes it difficult to identify meaningful trends, and even more difficult to attribute any trend to manmade global warming.
The right hand side shows US heat waves, which have been the big climate story this past summer. As the global average temperature increases, it makes sense that heat extremes would increase and cold extremes would decrease. However, reality isn’t so simple. This figure from the EPA shows that heat waves in the 1930’s were horrendous and much worse than in recent decades, even though the average global temperature was significantly lower in the 1930’s.
An important issue is the mortality associated with heat events. Numerous studies have found that there are more deaths from cold events than from heat events, by as much as an order of magnitude. The inescapable conclusion is that more warming leads to fewer deaths from temperature extremes. So which would Goldilocks prefer?
Slide 9 Adapting
So far, the world has done a decent job at adapting to weather extremes climate change. The upper left figure shows the change in yield for major crops, with yields for many crops doubling or even quadrupling since 1960.
The figure in the lower left shows losses from global weather disasters as a percent of GDP. The spikes are associated with years that showed large losses from tropical cyclones. Overall for the past 30 years, there has actually been a slight decline in losses.
The diagram in the lower right shows the number of deaths per million people from weather and climate catastrophes. The large numbers early in the 20th century were mostly associated with tropical cyclone landfalls in south Asia. Over the past century, climate related deaths have dropped 97%.
Slide 10 urgently reduce emissions
Under the auspices of the UN Framework Convention on Climate Change, the world is attempting to reach netzero in carbon emissions by 2050. I refer to this as Plan A.
Using the precautionary principle, Plan A is based on the premise that rapidly reducing CO2 emissions is critical for preventing future dangerous warming of the climate.
The other side of the policy debate rejects the urgency of reducing emissions. They argue that any near term reduction in warming would be minimal and at high cost. An effective strategy requires global reduction in emissions, which is highly unlikely for developing countries.
They argue that its best to focus on keeping economies strong and making sure that everyone has access to energy. And finally, the argument is made that there are other more pressing problems than climate change that need to be addressed with the available resources.
Slide 11 Emissions
In spite of the numerous UN treaties and agreements to reduce emissions, the atmospheric CO2 concentration relentlessly continues to increase
The challenge to getting to netzero by 2050 is illustrated by this diagram from the International Energy Agency. This figure shows the pathways for emissions reductions that the major economies need to take to reach netzero by 2050. Europe and the US have already turned the corner, but they still have a very steep path to netzero. By 2050, global emissions will be dominated by whatever China and India have done, or have failed to do.
The IEA roadmap finds that there is a possible but very narrow pathway to netzero by 2050, provided that there’s a huge leap in energy innovation and major efforts to build new infrastructure. Others find that reaching netzero by 2050 is a social and technological impossibility.
Slide 12 Wicked mess
How did we come to the point where we’re alleged to have a future crisis on our hands, but the primary solution of rapid global emissions reductions is deemed to be impossible? The source of this conundrum is that we have mischaracterized climate change as a tame problem, with a simple solution. Climate change is better characterized as a wicked mess. A wicked problem is complex with dimensions that are difficult to define and changing with time. A mess is characterized by resistance to change and contradictory and suboptimal solutions that create additional problems.
In decision making, a problem is associated with deep uncertainty if prediction models are inadequate, there is heavy reliance on subjective judgment, and there is disagreement on desirable alternative outcomes.
For such situations, treating a problem as if its tame can result in a situation where the cure is not only ineffective, but worse than the disease.
We clearly need a Plan B, that broadens the climate policy envelope. By considering climate change as a wicked mess, climate change can be reframed as a predicament for actively reimagining human life. Such a narrative can expand our imaginative capacity and animate political action while managing social losses.
Slide 13 pragmatism
Here’s a framework for how we can get to a Plan B.
In addressing the climate change problem, we need to remind ourselves that climate isn’t an end in itself, and that climate change isn’t the only problem that the world is facing. The objective should be to improve human wellbeing in the 21st century, while protecting the environment as much as we can. Climate-informed decision making that focuses on food, energy, water and ecosystems will support human wellbeing in the coming decades.
We need to recognize that how the climate of the 21st century will play out is a topic of deep uncertainty. Once natural climate variability is accounted for, it may turn out to be relatively benign. Or we may be faced with unanticipated surprises.
Alarmism about climate change misleads us and panic makes us less likely to tackle climate change smartly.
A more pragmatic approach to dealing with climate change drops the timelines and emissions targets, in favor of accelerating energy innovation. Whether or not we manage to drastically curtail our carbon dioxide emissions in the coming decades, we need to reduce our vulnerability to extreme weather and climate events.
So what does a plan B look like? Local solutions that secure the common interest can avoid political gridlock. There are a lot of relatively small things that we can do to reduce atmospheric CO2 and other greenhouse gases, that have justifications independent of climate mitigation. Individual countries and states can serve as laboratories for solutions to their local environmental problems and climate-related risks.
Progress can be made on a number of fronts related to land use, forest management, agriculture, water resource management, waste management, among many others. Human wellbeing will be improved as a result of these efforts, whether or not climate change turns out to be a huge problem and whether or not we manage to drastically reduce our emissions.
Slide 14
Encroachment of politics into socially-relevant science is unavoidable. Problems arise from many sources, and scientists, policy makers and the media are all culpable. The issue of greatest concern to me is when scientists filter research results and their public statements of facts with an eye to downstream political use. Governments exacerbate this by funding a narrow range of projects that support their preferred policies.
Climate science is far from the only area of science that has been politicized. Others include COVID19, gender studies, genetically modified food. Cancel culture is alive and well in the sciences, where scientists that disagree with an interpretation that supports desired policy objectives are ostracized, with some even losing their jobs.
Slide 15 Personal statement
In conclusion, a personal statement. I regard my job as a scientist to critically evaluate evidence and to challenge and reassess conclusions drawn from the evidence. While I regard manmade climate change as a cause for concern, I do not view this as a crisis or an apocalypse.
This perspective has placed me at odds with the activist branch of the climate science community, who regard my perspective as inconvenient. The academic political pressures from activist scientists and even politicians caused me to retire prematurely from my tenured faculty position.
I’m now working in the private sector, helping businesses to understand and manage their weather and climate related risks.
I am also active in engaging with policy makers and the public. I have a blog Climate Etc. that provides a forum for scientists and the interested public to engage in discussion on topics related to climate science and the science-policy interface.
JC remarks
Well its been awhile since I’ve had an invited talk in a mainstream academic venue. 15 minutes is longer than 5 minutes, but this is still alot of territory to cover. This is the first thing I’ve written publicly on the IPCC AR6. I have been crazy busy for months, currently exacerbated by hurricanes.
I do have some material in the pipeline for blog posts, i will try hard not to let two weeks pass between posts.
So on the whole, things aren’t too bad, for now and in the future. Pity MSM and associated alarmists don’t see it that way.
Nothing unprecedented about the weather, but western cultures ARE declining precipitously.
They feel in their hearts that THIS is the most pressing concern for humanity evah, and they are willing to waste; um, er, SPEND other peoples money until they feel better!
That’s the problem with alarmists; if they could leave their feelings and religious beliefs behind, and start pursuing Truth they wouldn’t BE alarmists!
So when exactly are we going to see this ”warming effect” of carbon dioxide?
The real ”agreement”….Carbon Dioxide seems to mathematically or theoretically have the potential to warm the planet. Sorry Judy, you can’t go any further than that at the moment…..
No where in the atmosphere is at absolute zero. So carbon dioxide has a warming effect. But carbon dioxide increase the earth’s temperature 83/467=0.17 watts. 0.03% of each degree at the tropics, 0.05% of 1 degree increase at the poles.
And life giving CO2 has a welcome fertilising effect for our food crops.
And the “man-made” CO2 effects are much smaller than that.
You need to think out what you’re going to say, before saying it…
Excluding right. Curry makes an assumption about a chaotic system and states it as fact.
“Exactly right” – damn autocorrect.
Except that many very knowledgeable folks make a very strong argument that this is just backwards. Warming causes an increase in CO2, not the other way around.
Carbon Dioxide and other greenhouse gases have a warming effect on the planet”
Not so, exactly . . . and I do believe Dr. Curry used poor phrasing in writing this.
There are those (myself included) that believe the atmospheric CO2 concentration level may have already reached an asymptotic point such that CO2’s ability to induce further warming of Earth’s atmosphere has basically ended . . . somewhat analogous to the way that there is only a finite amount a salt that can be dissolved in a given quantity of fresh water.
The assertion that CO2 is near saturation at 400 ppm in its ability to absorb IR from Earth’s surface and thereby heat Earth’s atmosphere (via molecular collision-induced thermalization of energy) gives us an excellent explanation for critical observations:
— 1) for why Earth did not experience “runaway” greenhouse warming, and thus the extinction of all life, when Earth previously experienced CO2 levels 8 to 15 times higher than today’s level (Paleozoic era), and
— 2) for why Earth has a current on-going (now about 7 years long) “pause” in GLAT increase (see https://wattsupwiththat.com/2021/09/01/the-new-pause-lengthens-yet-again/ ) despite the fact that atmospheric CO2 concentration, as precisely measured by the NOAA observatory on Mauna Loa, Hawaii, went from 400 ppm in January 2015 to 413 ppm on Sept 1, 2021, and increase of 3.3% over this same time period (ref: https://gml.noaa.gov/ccgg/trends/monthly.html ).
I’m sure that Dr. Curry is aware of these facts; thus, IMHO, a more appropriate sentence would have been: “Carbon Dioxide and other greenhouse gases have had a warming effect on the planet.”
It’s a subtle, but important distinction . . . one that need further scientific examination and debate.
Except even a “past tense” statement is nothing more than an assumption, and said assumption incorporates an internal assumption of “all other things held equal.” Which they have never been, are not, and will never be.
There is no empirical support in the Earth’s climate history for “CO2 drives temperature.” NONE. There is, conversely, plenty of empirical support in the Earth’s climate history for “CO2 drives nothing.”
I’m going with the empirically supported vs. the hypothetical bullshit.
I’m with you! 🙂
You may find, upon re-reading, that neither Dr. Curry or I ever asserted that “CO2 drives temperature”.
First, it would be foolish for anyone to claim that CO2 currently at about 415 ppmv in the atmosphere would dominate over water vapor, ranging up to 50,000 ppmv (in humid tropical air) and even higher concentrations leading to rainfall, in terms of a greenhouse gas effect happening on Earth.
Beyond that, the fact that CO2 can absorb LWIR coming off the surface of Earth has been empirically demonstrated beyond doubt and the fact is the physics of CO2 absorption of LWIR is understood with theoretical and mathematical rigor.
Of course, I welcome any and all science-based, objective rebuttals to those statements in the single paragraph immediately above. Assuming there is such, of course.
Very nicely put together and explained. I wish this presentation would be seen and heard by everyone.
Quote: ” … activists … regard my perspective as inconvenient …” J. Curry noted. I don’t envy her repeatedly hearing some of the alarmist scientists not only pontificate, but be insistently dogmatic. I hadn’t known she prematurely retired from faculty.
Her presentation for some reason failed to be recorded. Call my paranoid, but….
This is wise and sensible and well balanced. There are things one would like to add given another five minutes, but as far as it went it hit all the main points and took a rational objective view on them.
It was good to see explicit coverage of the fact that China and India are going to totally dominate global emissions by 2050. Also of the fact that the 8.5 scenario is totally unrealistic.
I’d have liked to see some inclusion of Curry and Lewis recent work on the empirical evidence on climate sensitivity. Indeed the other observation based studies of climate sensitivity, which all tend to a non-alarming outcome.
And also of the bizarre way in which models are treated by most climate scientists – taking a bunch of proven failing models and averaging their output to give predictions alleged to be reliable enough to guide public policy.
When there is one model available, the Russian one, which has a proven successful track record. Why are we not using that and junking the ones that have been proven to fail?
But as far as it went, it was wise, moderate and sensible. Well done Prof Curry! Keep on with this kind of thing, and we will yet get to rationality and away from hysteria.
Good summary, michel. Prof Curry should get a special award for her great efforts in promoting rational climate science.
I don’t think it is rational to believe the bogus Hockey Stick charts represent reality. Especially when there is so much counter-evidence to it. Counter-evidence that the author is no doubt aware of, along with everyone else on the alarmist side, that actually follows the subject.
Is it willful blindness? The real evidence doesn’t support a Hockey Stick temperature profile. The alarmists are living in a false reality, created in a computer. We are not living in the hottest times ever. That’s a lie. The author’s problem is she believes this lie. Thus, her whole outlook and approach is predicated on a lie.
When there is one model available, the Russian one, which has a proven successful track record. Why are we not using that and junking the ones that have been proven to fail?
That unfortunately is a question that answers itself.
“When there is one model available, the Russian one, which has a proven successful track record. Why are we not using that and junking the ones that have been proven to fail?”
Yes, why not throw out all the models but the Russian model, since the Russian model is the closest to reality?
I guess most of us know the answer to that question. It wouldn’t further the narrative. The Russian model is not scary enough.
Btw, be careful when searching for “Russian model”. You might get distracted.
Louisiana oil spills are in the news this morning. Are they large enough to reduce salt aerosol CCN numbers by a detectable amount?
The presentation should be required watching/reading for every STEM-illiterate politician on the planet.
JF
I wonder if Goldilocks was vaccinated.
By the way, there is a must-read post at Judith Curry’s by McKittrick. Its rather technical, on the statistical methods being used (wrongly) in attribution studies, but its completely devastating.
The apparenty specialist technical question is: what method should be used when assessing whether a given event or series can reliably be attributed to a climate condition or change in condition?
But its not just a specialist technical question at all. It turns out the methods that have been in general use by climate scientists since a seminal paper in 199 are plain wrong, and no attributions studies based on them (and that means just about all of them) are reliable.
Read it, take the time to go through, look up the references. You don’t have to be a professional statistician to understand the points at issue. The essential conclusion is that climate scientists are using (and sometimes modifying) statistical tools which they don’t fully understand, and drawing fake conclusions as a result.
The problem is that the tools they are using are quite specialist. And they do not rope in proper statisticians and econometrists. We saw the same thing with Mann’s mistreatment of Principal Component Analysis, which depended on taking the mean not of the whole series used, but a subset. Tamino’s defence of this, with false invocation of Ian Joliffe in defence, was a low point of that already deep hole.
Here we have the use or misuse of an econometric technique while failing to observe the well known conditions for its use.
This is, as usual, the misuse of statistics by people incompetent in that domain. They don’t seem to realize that you cannot, as a non specialist, just invent new statistical techniques and go around modifying the accepted and proven ones. Or maybe they do realize, and don’t care.
The solution would be to have all these papers reviewed by professional statisticians and econometrists. Not going to happen, I am afraid.
“Attribution studies” are NOT science!
They are economics search for a “maybe”! They are a part of the activity of insuarance companies.
“Attribution studies” have to do with money, NOT with science: this is the “abstract of the abstract” of McKrittick’s post.
“The essential conclusion is that climate scientists are using (and sometimes modifying) statistical tools which they don’t fully understand, and drawing fake conclusions as a result.”
Whenever weren’t they? Going back to Jones and his “why should we make our data available to you when you only want to find fault with them?” we have seen that the default position of some in the climate science “community” seems to be to assume their own divinity and to maltreat computer science, statistics, and even real data (as in temperature records) in order to “prove” an already decided upon outcome.
One day one of them might have a big enough pang of conscience to come clean as to why. I’m not holding my breath.
Climate ‘scientists’ break every statistical rule in the book. Can anyone, anywhere, show me where even a basic confidence interval is provided for any climate model? I have NEVER seen one, yet this is the most basic requirement of any model in any scientific method. It’s high time the world’s statisticians called this out.
There is absolutely no way that any climate model can claim to predict future temperatures to the levels of accuracy they do, with any reasonable level of confidence, yet the world’s statisticians let them get away with it.
Shame on the world’s statistical community for allowing this!!!
To be fair there are no confidence intervals provided with modeling. It just doesn’t happen. It’s not the point of modeling, to put a fine point on it. Modeling is done on a hypothetical basis and in theory, at least, you’re supposed to use the best parameters you can find rather than the ones that give you the output you desire.
Make no mistake, modeling isn’t statistics. Looking for error measurement where it can’t be calculated simply won’t happen. Confidence intervals can only be derived from data and the output of models is not data. It’s a little bit science, a little bit hocus pocus.
When you think of models think of these two statements, always:
1. Garbage in, garbage out. Bristlecone pines. ‘Nuff said.
2. All models are wrong, some are useful.
You missed ‘the warming is caused by human CO2 emissions’ . NO. MAYBE PART of the warming is caused by our emissions.
Once again no, mention of the atmospheric contribution of CO2 by termites, which studies estimate to be 10X the rate of humans.
While some folks argue that this is a natural contribution and therefore cannot be considered along with the “un-natural” contributions as is the case with humans, the fact is that the atmosphere doesn’t care where the CO2 comes from.
So, the solution to the un-natural global warming caused by humans is to exterminate 10% of the worlds termites. No one will miss 10% of them as shown by the fact that they never mention them anyway.
Jobs created worldwide and the end of the climate crisis. Humans can then continue their un-natural ways guilt free. Win – win.
And yet the Arctic is warming rapidly, sea ice is declining (to below 1930s levels – and I can cite Dr Curry’s own website for evidence on that), the ice caps are reducing, glaciers are retreating, more rapidly since the 1990s, except at highest elevations, there are certainly extreme weather events not seen in the last century, there are more high temperature records.
the UK, according to the UK Met Office, has certainly seen climate change in the latest 30 year period, being, for example, 6% wetter with more extreme rain days.
and that is producing a constant impact through flooding and destruction of infrastructure in the UK… rail embankments, reservoirs, housing, railways…
It is likely rain events in Germany and China and New York this year and the fires and heatwaves in the Med and the USA are all climate related.
And if those things aren’t dangerous, I don’t know what is…
One advantage of being older is that one has seen an awful lot of variability in the weather.
So much of what is ascribed to climate change has happened before in the UK.
A big question is what previous climate would one like to return to?
MWP, LIA, 1940s (1947 was pretty cold), 1960s (1962/63 winter was also very cold), 1980s?
Remember more deaths are caused by cold than heat.
Maybe the answer is to move to Camelot:
ARTHUR:
It’s true! It’s true! The crown has made it clear.
The climate must be perfect all the year.
A law was made a distant moon ago here:
July and August cannot be too hot.
And there’s a legal limit to the snow here
In Camelot.
The winter is forbidden till December
And exits March the second on the dot.
By order, summer lingers through September
In Camelot.
Camelot! Camelot!
I know it sounds a bit bizarre,
But in Camelot, Camelot
That’s how conditions are.
The rain may never fall till after sundown.
By eight, the morning fog must disappear.
In short, there’s simply not
A more congenial spot
For happily-ever-aftering than here
In Camelot.
Camelot! Camelot!
I know it gives a person pause,
But in Camelot, Camelot
Those are the legal laws.
The snow may never slush upon the hillside.
By nine p.m. the moonlight must appear.
In short, there’s simply not
A more congenial spot
For happily-ever-aftering than here
In Camelot.
StephenP
You are spot on when you write: “One advantage of being older is that one has seen an awful lot of variability in the weather.” However, one could add to this that an old person is likely to have lived in a number of climate zones. I have lived in five very different zones.
An older person also has a much broader frame of reference than a teenager or uni-student activist. This is essential to make sense of our world and exposes the ignorance of most youngsters and many older folk who live with blinkers.
Some of us with a love of history have also read journals from centuries ago with some fascinating comments about weather conditions, droughts, floods, failed harvests and more. These were written by people struggling to adapt and survive which quite a few did or else many would not be around today.
The UK isn’t wetter than 20-30-40-50-100 years ago.Neither are the other places you mentioned.The flooding is because of more and more places being concreted over.
I bet some think that concrete is evil and must be banned.
We need to ban the water which causes the chemical reaction that allows concrete to harden.
Griff probably thinks water is getting wetter.
Usually the blowing away, flooding, burning, etc. of the things built by humanity increase because of a very simple thing: Our propensity to build more and more in the paths of the water and flames and wind.
griff:
Dangerous is ignorance.
Dangerous is the capture of scientists by political agendas.
Dangerous are activist scientists. (some are not scientists at all, but they are referred to as such).
Dangerous are illitrate polititians who at all time say they “listen to the science”.
Dangerous are populist polititians who make rules and laws according to the front page of yesterday’s papers.
Dangerous are illiterate or corrupt journalists who report just one side of the questions. Ddangerous are illiterate or corrupt journalists who report only the opinions of those who have power or influence.
Dangerous is the capture of the judiciary power by activist agendas.
Dangerous is the reduction of freedom, rights and legal guarantees of the citizens.
Dangerous is using science as an
excusejustification to create Orwellian police states.Dangerous is ignorance.
Dangerous is all these things, and more, occurring NOW, not some rise in temperature that may, or may not, occur in the next 50 years.
Dangerous is also the takeover of the educational system from pre-school day-care thru university by the cultural marxism.
I agree 100 %.
Because schools and universities are the “factories” feeding the system with acritical citizens.
Sorry, I must disagree. Ignorance is not generally dangerous. We’re all ignorant in certain areas, or about certain subjects. The danger is in incompetence, where incompetence is not admitting your own ignorance. Incompetence is raft among the climate literati.
Perhaps it is aquestion of what each of us calls “ignorance”.
Yes, decision makers are incompetent; but they were elected; and most often re-elected. What makes them being re-elected when it is clear that they will use the same political agenda, program and means, hoping that with more of the same we will have a different outcome, you may call it “incompetence” of the citizens. I call it “ignorance”, and I think it is due to a failure of the schooling system from K12 through to university to provide students with the means of anlysis and undestanding what is going on around them: ignorance of history, of philosophy, of the basics of the different sciences; ignorance of the several debates (and arguments used) that in our past led to progress in ethics, in justice and law, in welfare through the use of technology. Ignorance of the means to change that “reproduction” system of the ruling “incompetent”, also because of a lack of knowledge (thus, ignorance) of the basics of science that would tell why those ruling are incompetent: the means to criticize (i.e., to identify the causes) their ideas, actions, choices (because that political incompetence does not spring from corruption alone: remember Martin Luther King Jr.: “Nothing in the world is more dangerous than a sincere ignorance and conscientious stupidity”).
But I suppose that, at the end of the day, we are thinking roughly about the same thing… Please, don’t be “sorry” to disagree! Disagreeing is very importante to clarify the minds! For me, disagreement in good faith is most welcome!
The corrupt, partisan Media is the most dangerous aspect of our current situation.
We can’t govern ourselves properly or elect the right people to office if reality is constantly being distorted by the Media for political reasons. And that is the case today.
The fundamental sin of mankind is pride. It is pride that begets the arrogance that enables ignorance…and this ignorance relies on and amplifies arrogance anew and these reciprocating twin bastard of pride lead straight to insanity. That’s where we are globally.
Once more I realise that you have daydreams far of reality.
Looking at the actual nubmbers every day I realise, that certainely latest end of this week the melt sesson will be over.
Look at the small but visible increase per yesterday:
http://nsidc.org/data/seaice_index/images/daily_images/N_stddev_timeseries.png
The fact that Griff sees all these things as dangerous confirms the diagnosis of being paranoid. It is rather sad that someone goes through life so afraid of living. Just express pity and leave it at that.
It’s sad that people are so easily manipulated and made to fear. Their irrational panic ruins life in their being so afraid of living, as you say.
All should rationally come to terms with the root causes of fear in order to avoid this pervasive paranoia. There is always hope that one may awaken to the joy of life before senescence.
Griff should do breathing exercises to calm himself down. They work. And they are simple to do.
Griff has a bad case of “seeing what he expects to see”.
The grift is so provably wrong.
http://ocean.dmi.dk/arctic/icecover.uk.php
As usual 😀
Have we hit this year’s minimum already?
Nearly, as far as I saw today with yesterdays data, see charts above
It is likely that the troll griffter has not read any weather history…for instance…that hurricane in 1926 that destroyed the City of Miami was maybe the most expensive natural disaster in money terms “evah”..
You missed out “The sky is falling”.
Griff never comes up with new lies, he just repackages the ones from before.
The arctic hasn’t warmed in a decade. Sea ice is higher today than it was in 2012. Antarctic ice is increasing, some glaciers are receding, but all of them are still larger than they were in during the Medieval Warm Period.
If extreme weather events are similar to ones seen in the last century, that’s proof that CO2 isn’t causing it.
A 6% change is well within the error bars of the measurement system, and even if it does exist is probably caused by the AMO.
“If extreme weather events are similar to ones seen in the last century, that’s proof that CO2 isn’t causing it.”
Excellent way to put it.
History blows up the alarmist case for human-derived CO2 causing extreme weather to be more extreme. For every extreme weather event today, we can find one just as extreme or even more extreme in the past when CO2 was a minor issue.
Yes, hurricanes are very bad, and they were just as bad 100 years ago.
Griff
As usual you are full of crap, Arctic sea ice has been increasing, this year is likely to be top 3 highest minimum in the last 13 years.
Sea ice is down since 1979, the high in the last hundred years, but is no longer falling it has started it’s cyclical increase.
I have for years tried to get you to take the bet on when we will have zero ice at the North Pole but as is typical with your type you won’t put up or shut up. You are good at twisting facts and slandering scientist but really bad at pretty much everything else.
Stop lying, griff. It’s not funny anymore.
I don’t know why griff is allowed to continue to post here. It’s nothing but lies and misinformation every single time. It also never responds to criticism, just drive-by posts in nearly every discussion thread. This is classic troll behavior and should not be tolerated here.
Greg,
The grifter is the grift that keeps on giving!
Without the ignorant and in(s)ane things it claims, we would miss out on the numerous learned, and often hilarious, responses that it provokes! I sometimes think that Anthony or CtM are actually throwing the posts in just to keep everyone alert; but then I think about the mental pain and suffering that trying to get into such a mindless state would cause.
No, the grifter is real; a real tool!
Griff has been in Moderation for a long time, not all of his posts are approved just the few that violates blog policy fails to show up.
Entertainment value. And to keep us on our toes. Also to demonstrate the massive gulf between WUWT and Skeptical Science when it comes to free speech!
Griff has his uses. He throws out the CAGW propaganda and then the propaganda gets debunked.
It’s fun for the regulars, and educational for the new visitors.
griff, are you James Dyke, senior lecturer in global systems at Exeter University because you certainly sound like him?
😲Whoa… the “senior lecturer in global systems at Exeter University” is that bad?!?
Pity the poor students who must attend his lectures. 😥
antarctic sea ice is near record highs , most of the continent continues cold and shows no warming trend , greenland snow mass balance is near or above the thirty year average , the NW passage is clogged with ice , and world wide tide gauges continue to show no acceleration in sea level rise . many of the extreme weather events of the past were worse than present , but the increase in population , infrastructure and media coverage has increased associated anxiety exponentially .
in the US more than twenty of the all time state high temp records are from the year 1936 .no other year has more than two .
Alarmists want us to ignore all those temperature readings that don’t conform to the CAGW (Catastrophic Anthropogenic Global Warming) meme.
They can’t refute what you say, so they will remain silent and hope noone pays attention.
Actual temperature readings put the lie to the CAGW meme.
So, for the UK, a 30-year experience is sufficient to judge what is happening to the Earth which has existed for millions of years? I wonder what you would believe if it were possible for you to see the data for, say, a million years. When all those man-made constructions would not exist.
30 year trends are pointless.
Our daily drive-by by Griff, who won’t respond to any of the corrections people make about his screed.
IIRC I thought there were two points about the effect of CO2 on global temperatures.
1. The effect of CO2 was logarithmic, so the resulting increase in temperature as a result of a doubling of CO2 was a case of diminishing returns.
2. How much fossil fuel is there available to burn? I seem to remember from a comment in a blog some time ago that if it was all burnt the resulting level in the atmosphere would be between 600 and 800 ppm. Is this correct?
Has anyone got some more recent/better data or calculations on these matters?
You are correct
That is why RCP8.5 is useless crap
A fantasy
True, but only the warming after ~1945 can be attributed, if at all, partly or mostly to human emissions:
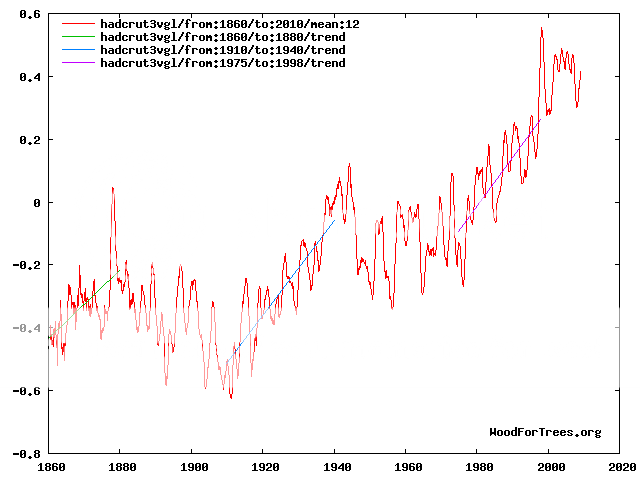
Which leaves pre-1945 warming of similar rate largely attributable to natural variation:
As far as I’m aware the IPCC have yet to offer a logical explanation.
Why the blip from 1940 to about 1946? Genuine question even asked Tom Wigley.
JF
see above
Thanks for that Anthony however I thought there may be a simple explanation, like the IPCC’s effortless explanation for the post-1950 warming 🤣.
Wasn’t there a war on about that time? Lot of smoke and stuff from bombs and guns and fires and like that?
That is why I asked “why 1946? Why not 1955? Why not 1970?”. Because the war ended 1n 1945, and I see (subjectively) that the “blip” possibly continued further, perhaps until 1955, perhaps until 1970. Big variation from one year to the next is frequent in the graph… smoke from war dissipated in 1945 and came back three or four years later?
“Because the war ended 1n 1945, and I see (subjectively) that the “blip” possibly continued further, perhaps until 1955, perhaps until 1970.”
Here’s the perspective from the United States:
Hansen 1999, US regional temperature chart:
As you can see the highpoint is 1934, where Hansen said 1934 was 0.5C warmer than 1998, and then after 1934 the temperatures cooled off for a while, and then they warmed up into the 1950’s, and then they cooled again down to about 1980, and then the current warming began.
In the late 1970’s, it was getting so cool that many climate scientists were beginning to worry that the world was going into another Ice Age.
Notice that the 1910’s and the 1970’s are equally cool, and the 1930’s and the 1990’s are equally warm.
“Why the blip from 1940 to about 1946?”
If I may ask, why 1946? Why not 1955? Why not 1970?
“As far as I’m aware the IPCC have yet to offer a logical explanation”
They have – you just wont find it on here.
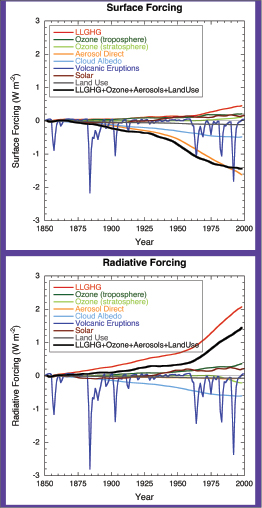
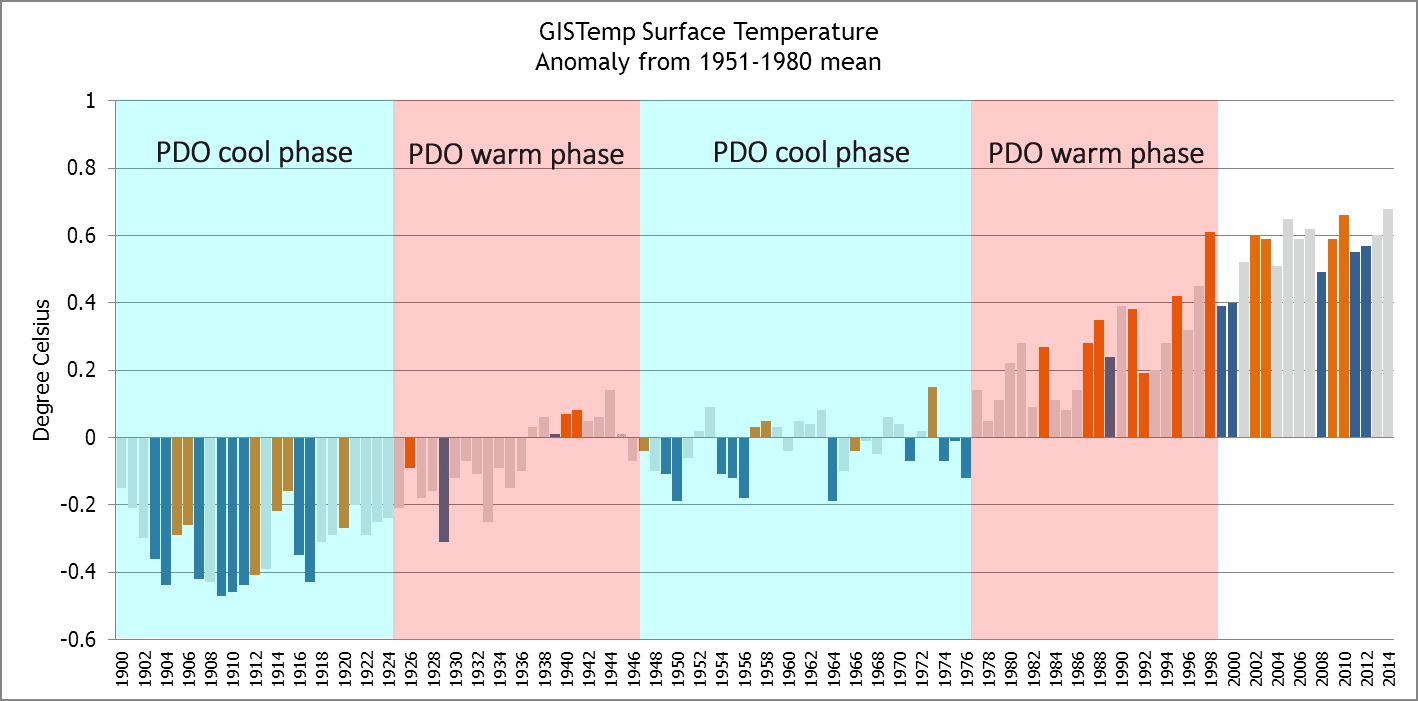
The 1940’s warming was a result of prolonged +ve PDO/ENSO + AMO in a period of little -ve aerosol forcing – then a post WW2 world experienced increasing atmospheric aerosol pollution creating “Global dimming”, which did not diminish until post the 70’s after the advent of clean air acts around the world.
In that period the forcing of CO2 alone was cancelled by the -ve one of aerosol – this when it represented less than 1 W/m2 of forcing – it is now ….
Using:
5.35 ln(415/280)
=2.1 W/m2 present day CO2 radiative forcing.
CO2 forcing in 1965 (Mauna Loa)
5.35 ln(320/280)
=0.71
So there is now 3x the RF from CO2 as there was 55 years ago
And then there is the added forcing of the extra 7% WV in the global atmosphere (Clausius Clapeyron)
Which works out at about another1.5 – 2.0 W/m2/K
So now we have an anthro forcing (minus aerosol -ve’s) of around 4 W/m2
https://agupubs.onlinelibrary.wiley.com/doi/10.1029/2020GL091585
“Climate change is a response to energy imbalances in the climate system. For example, rising greenhouse gases directly cause an initial imbalance, the radiative forcing, in the planetary radiation budget, and surface temperatures increase in response as the climate attempts to restore balance. The radiative forcing and subsequent radiative feedbacks dictate the amount of warming. While there are well-established observational records of greenhouse gas concentrations and surface temperatures, there is not yet a global measure of the radiative forcing, in part because current satellite observations of Earth’s radiation only measure the sum total of radiation changes that occur. We use the radiative kernel technique to isolate radiative forcing from total radiative changes and find it has increased from 2003 to 2018, accounting for nearly all of the long-term growth in the total top-of-atmosphere radiation imbalance during this period. We confirm that rising greenhouse gas concentrations account for most of the increases in the radiative forcing, along with reductions in reflective aerosols. This serves as direct evidence that anthropogenic activity has affected Earth’s energy budget in the recent past.”
The usual “dog ate my homework” explanation from alarmists for the inconvenient1940-80 cooling trend. Strangely, no one ascribed the cooling to this cause at the time.
This is the calculation. It’s basic Arithmetic, nothing fancy, no hidden agenda, just something you can do by taking your socks and shoes off.
Atmospheric CO2 levels in 1850 (beginning of the Industrial Revolution): ~280ppm (parts per million atmospheric content).
Atmospheric CO2 level in 2021: ~410ppm.
410ppm minus 280ppm = 130ppm ÷ 171 years (2021 minus 1850) = 0.76ppm of which man is responsible for ~3% = ~0.02ppm.
That’s every human on the planet and every industrial process adding ~0.02ppm CO2 to the atmosphere per year on average. At that rate mankind’s CO2 contribution would take more than 20,000 years to double which, the IPCC states, would cause around 2°C of temperature rise. That’s ~0.0001°C increase per year for 20,000+ years.
One hundred (100) generations from now (assuming ~ 25 years per generation) would experience warming of ~0.25°C more than we have today. ‘The children’ are not threatened!
Furthermore, the Manua Loa CO2 observatory (and others) can identify and illustrate Natures small seasonal variations in atmospheric CO2 but cannot distinguish between natural and manmade atmospheric CO2.
Hardly surprising, mankind’s CO2 emissions are so inconsequential this ‘vital component’ of Global Warming can’t be illustrated on the regularly updated Manua Loa graph.
It’s independent of seasonal variation and would reveal itself as a straight line, so should be obvious.
Not even the global fall in manmade CO2 over the early Covid-19 pandemic, estimated at ~14% (14% of ~0.02ppm CO2 = 0.0028ppm), registers anywhere on the Manua Loa data.
Why am I not surprised?!
Good summary of the issues but it’s a shame the graphs aren’t up to date – equivalent to the mysterious cool down in the 40’s-75′ during an orgy of co2 production is the basically flat-lining of temperatures 1998-present in spite of the huge co2 increases since 2000 with China and India especially taking advantage of all the gifts fossil fuels have to give to their citizens. And that lack of increase in spite of a warm AMO phase and an El Nino a few years ago (that always seem to leave a step change in temperatures for years afterwards).
It pains me to see a bogus Hockey Stick chart being used as “evidence” of anything.
Put the highpoint of the 1880’s, and the highpoint of the 1930’s and the highpoint of 1998/(2016) on the same horizontal line, and then you would have a real representation of the past, instrument-era temperature profile, where it was just as warm in the recent past as it is today. Notice how the chart shows the 1880’s and the 1930’s to be equally warm.
Here’s the way to tell if you are looking at a bogus Hockey Stick chart: If the 1930’s don’t show to be as warm as today, then you are looking at a bogus Hockey Stick chart.
The rate of change from 1910 to 1940 is the same as the rate of change from 1979 to the present, but the highpoint temperature for both periods was also the same, and the bogus Hockey Stick does not show this, instead making the 1930’s look cooler than today, in order to forward the CAGW narrative.
All unmodified regional charts show the warmth of the Early Twentieth Century. It’s only the bogus Hockey Stick charts that don’t show it, and this was done because of human manipulation of the temperature record in computers to create a false reality where CO2 needs to be regulated.
Hockey Stick Chart = One of the Biggest Lies ever told in Science.
Dr. Curry is scientist and academic. I greatly admire her work and calm persistence in face of attacks from her (supposed) peers. However she completely misses the point.
The climate change charade is a U.N. run hoax. “Climate Change” is not about reducing CO2 to keep the world from warming. It is about changing the world from democratic capitalism into UN run socialism. The UN bureaucrats have told us so. Plan A is supposed to fail. They think that then the world will agree to let them run the world in order to save it from the imagined ravages of climate change. They have no interest in a Plan B. But the rest of us should.
Spot on old engineer.
In our day we were taught to THINK before we calculate. Easy to comply; as log tables, slide rules and graph paper were laborious.
A thousand upvotes!
With the modern Left/Progressive Axis, it has never been about Climate (or any of the Left’s hobbyhorses like Racism), but about a power grab. Climate, racism etc. are merely pretexts.
Agenda 21. Davos Economic Forum. Christina Figueres.
The latter has openly stated that climate change is less about actually “fixing the planet” and more about moving away from capitalism.
They’re all telling us what they are working towards. Many refuse to listen.
I also conclude that that is the UN’s aim— wealth redistribution. But for many in the USA, there is just genuine fear and panic and in institutions, noble cause corruption.
THe Holocene climatic optimum tells us 2 C warmer better.
Which in we will probably never reach again.
Not during this inter-glacial. The next one? Who knows.
Love your work Judith. Assessing the science, but with a very healthy dose of pragmatism.
Rational, but the climate change crisis is postmodern and irrational.
In the end, no matter why, warmer is better.
Thank you, and keep up the good work.
Dr. Curry, thank you very much for this presentation. Too bad that this isn’t being presented to a wider audience. My 16 year old son has been thoroughly indoctrinated that there is a climate crisis by the media and school.
I’ll call myself a nitpicker, but this caught my attention:
Slide 9, this sentence “Over the past century, climate related deaths have dropped 97%”
I’m thinking this should read “weather related deaths”, I’m not sure what a *climate* related death would actually be.
Anyways, great work, thanks again, and please, may we have some more?
I agree with her use of the word as it throws it back at the climate scientologists
They refer to climate not weather, so it’s important to point out that using their metric it’s far better
I don’t agree with that use of the word because it lends credence to the “climate change causes bad weather” bullshit.
Satellites mean more hurricanes are detected. Before weather satellites, storms not making landfall and out of shipping lanes went unnoticed.
Not only are more detected, the intensity is also increased.
By reflecting away 30% of the incoming solar energy the albedo makes the Earth cooler than it would be without the atmosphere much like that reflective panel behind a car’s windshield.
The non-radiative heat transfer processes of the contiguous atmospheric molecules render “extra” energy upwelling from the surface radiating as a LWIR black body impossible.
For example, the 396 W/m^2 upwelling from the surface is a “What if?” theoretical calculation without physical reality. (refer to: TFK_bams09 attached)
Without the 396 W/m^2 upwelling there is no 333 W/m^2 GHG energy up/down/”back” LWIR greenhouse gas loop to not “warm” the terrestrial surface.
The greenhouse theory and man caused climate change are negated by any one of these three points.
Hysterical speculations over sea levels, ice caps, glaciers, extreme weather, etc. are irrelevant noise.
Zero greenhouse effect, Zero CO2 global warming and Zero man caused climate change.
Version 1.0 090521
What “Loop” Nick ? Surface averages 288 K which is 396 W/m^2 and clear sky plus clouds plus atmospheric window averages 276 K which is 333 W/m^2 worth of IR photons. What is it about the net 63 watts of heat, of which 40 goes through the atmospheric window to outer space, that you do not understand, even though you obviously identify them ?
289 K, 16 C, plus S-B at BB equals 396 W/m^2.
396 upwelling from the surface is 54 more than the 342 that arrived ToA from the sun in the first place, 156 more then the net after albedo, 236 more than the net/net 160 to the surface.
LoT 1 has a serious problem with that plus that the 63 is on the diagram TWICE
396 is the theoretical what IF^6 value for assessing emissivity: 63/396 = 0.16.
Upwelling surface IR instruments assume 1.0 emissivity which is obviously incorrect.
396
Does
Not
In
Fact
Exist!!
BTW
The Earth is cooler w atmosphere not warmer.
Yes? No, pls ‘splain.
GHGs need “extra” energy upwelling from surface as a BB.
In other words, where does the 396 actually come from?
The surface does not radiate as a BB – as demonstrated by experiment.
Thank you for typing slowly for us, Nick; it helps our comprehension. Who asserts the Earth radiates as a blackbody? The numbers I have seen are around .91 to .93.
Whom asserts such?
Trenberth in TFK_bams09 page 315 and all of the copies and clones.
396 is the surface radiating as a BB at 16 C. It’s the theoretical denominator in the emissivity calc.
You have some other explanation?
0.91 or 0.93 or 1.0 – equally not possible.
Theoretical = 63/396 or 0.16.
Physical = 63/161 = 0.39.
Earth cooler w/ atmos.
GHG’s “extra” energy violates LoT 1.
Upwelling “extra” energy as BB not possible.
Any one of these negates the greenhouse effect.
What say you?
“Earth cooler w/ atmos.” Not at night.
“GHG’s “extra” energy violates LoT 1.” LoT 1 relates to NET energy flow.
“Upwelling “extra” energy as BB not possible.” All matter above 0 K emits energy. “Upwelling” and “downwelling” are simply descriptive words. The Sun emits SW “downwards” to the Earth. The Earth emits LW “upwards” into the atmosphere and reflects SW to space. The atmosphere (including clouds) emits “upwards” (at TOA), reflects SW to space and emits “downwards” at the Earth’s surface. Do you deny that the atmosphere (including clouds) emits LW towards the Earth’s surface?
I’m done wrestling with you in the pig wallow. I’m getting dirty and you are having too much fun.
How about you calculate what the equivalent values would be for the moon and see how they compare? Though I don’t know what you would do about the slow rotation, maybe use the half full moon as a starting point.
Also, remember that S-B would take into account the whole system (planet and atmosphere). The ground maybe hotter than what S-B says but if you look at the ‘centre’ of the atmosphere, where the pressure is half that at sea level because half the atmosphere is above and below you, the average temperature is the S-B expectation.
Nick’s magical math again. He proves he is the only one in the world that understands radiative physics. Drs. Happer & Lindzen are mere tools of the worldwide elite.
Stand under an IR heater at Home Depot.
Consider the hood of a black car under the sun.
Experimental demonstrations of the attached graphic.
Also demonstrated here:
For the experiment write up see:
https://principia-scientific.org/debunking-the-greenhouse-gas-theory-with-a-boiling-water-pot/
“The principle of science, the definition, almost, is the following: The test of all knowledge is experiment. Experiment is the sole judge of scientific “truth.””
Richard P. Feynman, “Six Easy Pieces”
The GHE occurs over the vast distances of the atmosphere. Your “experiment” is a boiling pot of water. Your “test” fails Feynman’s experiment condition. Additionally, your graphic is not an experiment by any stretch.
The graphic illustrates how outgoing radiation does not function alone but in concert with the non-radiative processes and as such cannot be BB.
Yes, radiation is a function of only temperature, but temperature is a function of the non-radiative processes.
As demonstrated in the heating element section of the experiment.
In case you missed it:
The boiling pot of water demonstrates how the Earth’s surface cannot radiate “extra” energy as a BB. 90%+ of the incoming energy is leaving by phase change evaporation. Radiation’s share is tiny. That is also the case with the ocean surface where emissivity is on the order of 15%.
No “extra” energy, no GHG warming, no CAGW.
And 97% of “climate” scientists (and WUWT participants) will have to go back to molesting sheep.
Nick Schroeder posted: “By reflecting away 30% of the incoming solar energy the albedo makes the Earth cooler than it would be without the atmosphere much like that reflective panel behind a car’s windshield.”
Begs the question: Why is it then that Venus with an atmosphere having an albedo of 0.77 (about 2.5 times greater than that of Earth), has a surface temperature of about 700 K compared to Earth’s average surface temperature of 15.5 K?
Glad you asked.
Venus, we are told, has an atmosphere that is almost pure carbon dioxide and an extremely high surface temperature, 750 K, and this is allegedly due to the radiative greenhouse effect, RGHE. But the only apparent defense is, “Well, WHAT else could it BE?!” (besides/also molten core volcanism)
Well, what follows is the else it could be: (Q = U * A * ΔT) aka a contiguous participating media.
Venus is 70% of the Earth’s distance to the sun, its average solar constant/irradiance is about twice as intense as that of earth, 2,602 W/m^2 as opposed to 1,361 W/m^2.
But the albedo of Venus is 0.77 compared to 0.31 for the Earth – or – Venus 601.5 W/m^2 net ASR (absorbed solar radiation) compared to Earth 943.9 W/m^2 net ASR.
The Venusian atmosphere is 250 km thick as opposed to Earth’s at 100 km. Picture how hot you would get stacking 1.5 more blankets on your bed. RGHE’s got jack to do with it, it’s all Q = U * A * ΔT.
The thermal conductivity of carbon dioxide is about half that of air, 0.0146 W/m-K as opposed to 0.0240 W/m-K so it takes twice the ΔT/m to move the same kJ from surface to ToA.
Put the higher irradiance & albedo (lower Q = lower ΔT), thickness (greater thickness increases ΔT) and conductivity (lower conductivity raises ΔT) all together: 601.5/943.9 * 250/100 * 0.0240/0.0146 = 2.61.
So, Q = U * A * ΔT suggests that the Venusian ΔT would be 2.61 times greater than that of Earth. If the surface of the Earth is 15C/288K and ToA is effectively 0K then Earth ΔT = 288K. Venus ΔT would be 2.61 * 288 K = 748.8 K surface temperature.
All explained, no need for any S-B BB LWIR RGHE hocus pocus.
Simplest explanation for the observation.
But why compare to Venus when the moon is just next door?
And w/o atmosphere the Earth would be very moon like negating RGHE.
Nikolov, Kramm, UCLA Diviner all concur.
“The Venusian atmosphere is 250 km thick as opposed to Earth’s at 100 km. Picture how hot you would get stacking 1.5 more blankets on your bed. RGHE’s got jack to do with it, it’s all Q = U * A * ΔT.”
and
“The thermal conductivity of carbon dioxide is about half that of air.”
But your original argument was that it’s the albedo of the planet’s atmosphere reflecting incoming solar radiation that makes the surface cooler “much like that reflective panel behind a car’s windshield” (your words).
So, by your own calculations the atmosphere of Venus is absorbing only 601.5 W/m^2 net compared to Earth’s atmosphere absorbing 943.9 W/m^2.
In addition, since the Venus atmosphere is mostly CO2, with “thermal conductivity of carbon dioxide is about half that of air” (again your words) and “is 250 km thick as opposed to Earth’s at 100 km” (again you words) that incoming energy flux, absorbed at top-of-Venus-atmosphere, will have a much higher resistance to reaching the surface of Venus to cause heating in the first place.
In simple terms, the insulating properties of “blankets” works in both directions.
If you now want to argue that Venus has a much higher surface temperature and associated surface radiation power flux (W/m^2) than Earth due to internally generated thermal energy, that is a totally different argument that you did not previously present.
All.
If the 396/333 were stripped from the K-T graphic the balance would be unaffected since the 63 is in two places
What say y’all?
Since you asked, I’d say your post, as it stands, needs to be rewritten.
It is you that did the hatchet job on the original K-T diagram with your insertion of the extra “Solar 63” in the yellow box with red line pointing to Earth’s surface (posted above on Sept 5 at 6:43 am). You then repeated that mistake in your mathematical calculation given to the right of your incorrectly-modified graphic power flux balance by assigning it as “Outgoing originating from SUN!”
No, since your “Solar 63” is clearly coming off Earth’s surface, it “originates” at Earth’s surface. Furthermore, that quantity is equal to (as clearly shown in the original K-T diagram in tan-colored arrows on the right side) the difference between the 396 W/m^2 identified to represent ALL outward surface radiation and the 333 W/m^2 identified to represent ALL incoming radiation from the atmosphere back to the surface of Earth.
It is YOU that introduced the extra, misidentified “Solar 63” W/m^2, and then turned around to claim that “it appears in two places”. Just ridiculous.
BTW, the entire, original K-T diagram is a balance of power fluxes that account for redistribution of power received from the Sun . . . there are no separate sources of power being considered in the balance (such as geothermal heat). Thus, ALL of the separately identified power fluxes (the thermals, the evapotranspiration, the atmospheric back-radiation . . . all of it) in a sense originated from the Sun!
Thus, one wonders why you felt the need to break out only 161 W/m^2 as “Outgoing originating from the SUN!” For the Earth to be in approximate thermal equilibrium, all 341 W/m^2 of incoming solar radiation MUST be balanced by 341 W/m^2 of outgoing radiation, whether by reflectance or by direct LWIR, as correctly show in the original K-T diagram.
Your checkbook must be total train wreck.
And that, folks, is a prime example of an ad hominem response.
Or, as stated more bluntly by Socrates, “When the debate is lost, slander becomes the tool of the loser.”
Everyone subscribing to Judith Curry’s webblog Climate Etc. has seen this already. The issue is Big Brother now wears the disguise of Climate Change and the Climate Change messaging has substantial backing in numbers and money. There is no “97% of scientists believe that climate change is a pending disaster … this is a hyperbolic rant from all those people that are on the climate payroll – the IPCC, all those university, UN/IPCC and government types whose positions and salaries require them to walk the talk and speak the gross exaggeration. Not 11,000 scientists are warning of untold misery coming right across the corner in a neighborhood hear you.” Not the fake Union of Concerned Scientists crying out. Not “The consensus couldn’t be clearer. Climate change is happening. It’s caused primarily by the burning of oil, gas, and coal. If we do nothing, the world will blah blah blah … It is baloney… baloney is junk … fake baloney is much worse.. Somehow, someone, please organize and bring together the real truth and real messaging on what we know and what we can say we know and what is can say is really happening … as we are now hearing from objective scientists with creds including Steven Koonin, Judith Curry, etc. The Red Team – Blue Team debate that Koonin pushed is the right way forward… and why do the climate change left strongly oppose it… because it would make them look bad and undermine their storylines and sources of personal wealth, positions and notoriety. So let’s do THE RIGHT THING…. NOW.
Look for the Climastrology nut bags to start pivoting away from CAGW, and start throwing their weight behind the China virus scare! The public has become largely complacent about the dire prognostications of the high, climate priests; and the last year and a half have shown that many are willing to sacrifice all of their freedoms and economic prosperity if Big Brother will only protect them from a really bad cold virus!
The totalitarian Left will push for Perpetual Covid, and all it’s benefits; unlimited power, easily stolen elections, and the imprisonment or deaths of numerous rebels and malcontents! All they have to do is to keep suppressing the effectiveness of therapeutics, while pushing for a never ending stream of booster vexxines! Those who push this agenda, like the Big Tech Nazis and the Lame Stream Media, are guilty of mass murder; but that doesn’t concern them because their hearts are pure. Pure evil!
Quite right. Look, for example at electric vehicles. There are currently around 1.4 billion cars in the world and by 2050 it is estimated there will be 2 billion. There are also large fleets of Heavy Goods and Light Goods vehicles.
Yet earlier this year the IEA published ‘The Role of Critical Minerals in Clean Energy Transition’ and this found
OK a few more million EV’s will be added by 2050 but there will still be almost 2 billion non electric vehicles around.
Here is the Abstract of my Paper ” Net Zero threatens Sustainable Development Goals ” posted at https://climate sense-norpag.blogspot.com
Abstract
This paper begins by reviewing the relationship between CO2 and Millennial temperature cycles. CO2 levels follow temperature changes. CO2 is the dependent variable and there is no calculable consistent relationship between the two. The uncertainties and wide range of out-comes of model calculations of climate radiative forcing arise from the improbable basic assumption that anthropogenic CO2 is the major controller of global temperatures. Earth’s climate is the result of resonances and beats between the phases of cyclic processes of varying wavelengths and amplitudes. At all scales, including the scale of the solar planetary system, sub-sets of oscillating systems develop synchronous behaviors which then produce changing patterns of periodicities in time and space in the emergent data. Solar activity as represented by the Oulu cosmic ray count is here correlated with the Hadsst3 temperatures and is the main driver of global temperatures at Millennial scales. The Millennial pattern is projected forwards to 2037. Earth has just passed the peak of a Millennial cycle and will generally cool until 2680 – 2700. At the same time, and not merely coincidentally, the earth has now reached a new population peak which brought with it an associated covid pandemic, and global poverty and income disparity increases which threaten the UN’s Sustainable Development Goals. During the last major influenza epidemic world population was 1.9 billion. It is now 7.8 billion+/. The establishment science “consensus” that a modelled future increase in CO2 levels and not this actual fourfold population increase is the main threat to human civilization is clearly untenable.
Figure 5 shows the projections to 2037 :
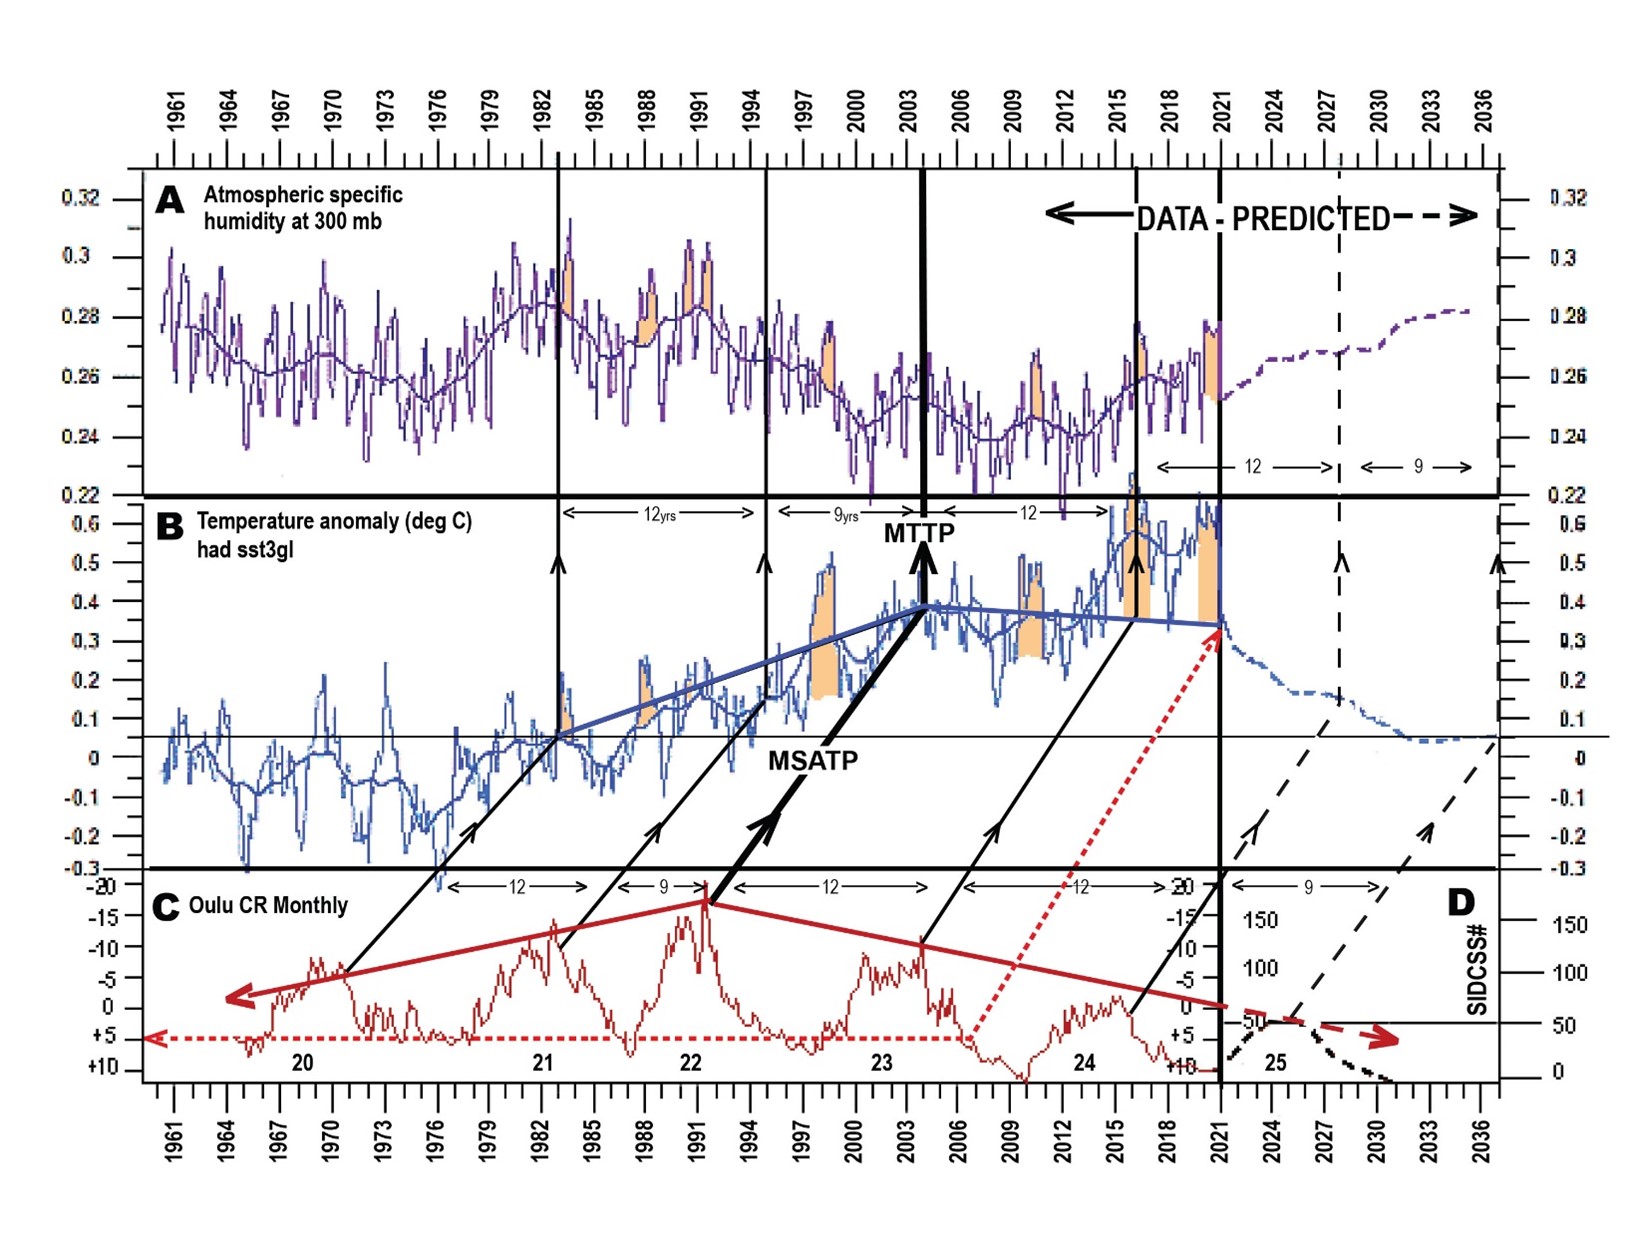
Fig 5 Correlation of the last 5 Oulu neutron cycles and trends with the Hadsst3 temperature trends and the 300 mb Specific Humidity. (28,29)
The Oulu CR data shows the decrease in solar activity since the 1991/92 Millennial Solar Activity Turning Point and peak There is a significant drop to a lower solar activity base level post 2007+/-.There is a new solar activity minimum at 2009. As in Fig.4 the MSATP at 1991 correlates with the MTTP at 2003/4 with a 12/13 +/- year delay. Short term temperature spikes are colored orange and are closely correlated to El Ninos.
Temperature Predictions
Loeb et al 2018 in “Changes in Earths Energy budget during and after the “Pause” in Global Warming”(30) provided an important observational database from 1998 – 2018.This
showed that a reduction in global mean reflected short wave top of atmosphere flux in the three years following the hiatus resulted from decreased low cloud cover which added to the 2016 El Nino temperature spike.
Figure 5 also predicts SST3gl and Specific Humidity trends from 2022 – 2037. (Blue and Purple dashed lines) The secular change in the Solar Activity to a lower base level after 2007 projects to 2021. The SST3gl general decline trend from 2021 to 2037 is here projected as the reverse of the increase from 1983 – 2004 with the cycle 24 peak projected at 2028 and the cycle 25 peak at 2037.
Kitiashvili,I 2020 (31) estimated that Solar Cycle 25 will start after the 2020 solar minimum and will be weaker than Cycle 24.The maximum of Cycle 25 solar activity should be in 2024/25 with a sunspot number of about 50 +/- 15. The correlative HadSST3gl anomaly is 0.05C. in 2037.The intervening solar activity minimum would be at 2031.
Link working:
Net Zero threatens Sustainable Development Goals
Thanks.
Excellent “Reader’s Digest” version of the AGW non problem.
I hold Dr. Judith Curry in very high esteem. She is one very smart and reputable person!
However, I cannot resist making this tangential remark: in my career in engineering, I was advised (repeatedly) by public speaking coaches to allocate 3 minutes per “slide”/viewgraph presented in a public talk. And that was for relatively simple slides of text and/or graphics. It simply takes, on average, that long to first “clear the slide” and then to talk to the key points it contains.
Dr. Curry’s slides made available in the above article (kudos and thanks to her for doing that!) are, after Side #5, on the “heavy’ side of info content and thus should have been allotted even more time for presentation.
If she indeed made a presentation of all 13 slides within a 15 minute presentation window, and yet did not leave her audience with “eyes glazed over”, she has, IMHO, accomplished the impossible.
Does CO2 really have a warming effect? The following diagram would seem to contradict the consensus. It describes where CO2 radiates energy to space.
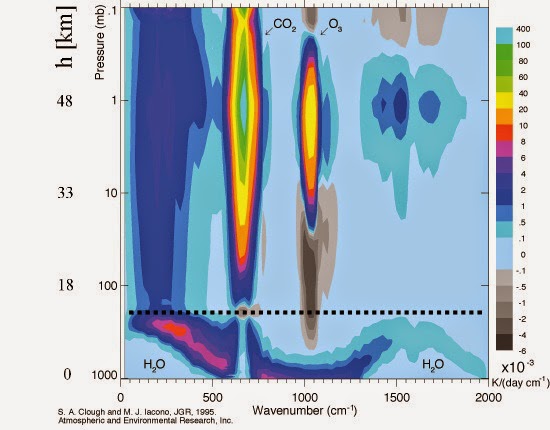
Keep in the mind what determines the actual warming of the greenhouse effect. It is changes in the ability of Earth to cool itself. Often this is referred to as being defined by the effective radiation height (ERH).
If the ERH is located in the troposphere and it rises, then because the average temperature is cooler, there is less energy radiated away. This means the Earth will warm.
Notice that CO2 is NOT radiating much energy from the troposphere. It is almost all radiating from the stratosphere. Rises in the ERH of CO2 moves it to a warmer part of the atmosphere due to the reverse lapse rate of the stratosphere. Wouldn’t this mean more energy is radiated away? The Earth would not warm. In fact, it would cool.
If you examine the physics behind the exchange-of-energy from CO2 molecules that have directly absorbed IR radiation coming off Earth’s surface (be it land or water or ice), you quickly discover that the overwhelming energy transfer is by collision of those “IR excited” CO2 molecules with the overwhelming number of non-“IR excited” molecules surrounding them . . . that is, N2 and O2 molecules comprising 99% of the lower atmosphere by volume).
This molecule-to-molecule collisional redistribution of excess kinetic energy (energy originating from absorbed IR photons being converted into molecular vibration and translations modes) is the process known as “thermalization” of energy associated with driving any mixture of gases towards an equilibrium Maxwell-Boltzmann energy distribution that determines the given mixture’s volume’s “sensible” temperature.
The fact is that, for a given CO2 molecule that has absorbed a given IR photon, the characteristic time delay to re-emit that energy in one or more photons is 5-6 orders of magnitude SLOWER than the time between collisions of that CO2 molecule with either a nearby N2 molecule or nearby O2 molecule.
This thermalization of IR energy from Earth’s surface via CO2 molecules (or any other “greenhouse” gases, such as water vapor, for that matter) has largely been accomplished within the first 10 km altitude.
The graph of CO2 radiation versus altitude that you present largely reflects the fact that above about 20km altitude the air is so thin (i.e., lower collisional frequencies due to inherently lower air density) that the thermalization process starts to lose out to the direct CO2 photon emission process (the measured CO2 radiation at TOA). However, at these higher altitudes, the CO2 molecules have already thermalized most of the IR energy they intercepted coming off Earth’s surface. The graph represents only a tiny fraction of the energy (as photon radiation) that those CO2 molecules intercepted and then “thermalized” below 20 km.
Given the time delay that you specified it would seem CO2 molecules would have difficulty absorbing any IR low in the atmosphere. They would be constantly sharing energy with other molecules through collisions and almost never in a relaxed state.
If that is true it’s one more strike against the CO2 greenhouse effect.
Is the slow relaxation time unique to the C-O bond such that the H-O bond of water vapor doesn’t have this issue?
1) Indeed, atmospheric CO2 molecules are almost always (over time) in a relaxed state and this is reflected in the fact that their sensible temperature, reflecting their Maxwell-Boltzmann distribution of molecular energies, is for all intents and purposes the same as N2 and O2 molecules at any given altitude. A CO2 molecule that intercepts a LWIR photon coming off Earth’s surface does so almost instantaneously, but then nearly as fast has a collision with a statistically much-“cooler” (being non-LWIR absorbing and in much higher concentrations) N2 or O2 molecule.
The laws of statistical thermodynamics (particularly that of entropy) state that over time, in a mixture of gases, molecules with high energy (i.e. LWIR photon-energized) will transfer energy, via collisions, to molecules that are in a lower energy state. These laws also state that it is highly improbable that a lower-energy molecule (e.g. N2 or O2) will transfer energy to a higher-energy molecule (e.g.,a LWIR photon-energized CO2 molecule), although that is theoretically allowed.
This rapid “thermalization” of LWIR-energized CO2 with the non-LWIR active N2 and O2 means that at any given time most CO2 molecules are ready to absorb yet another LWIR photon, and why the absorption of LWIR being radiated off Earth’s surface is essentially completed (asymptotically, of course) within the first 10 km altitude.
This is not a “strike against” the CO2 greenhouse effect, but rather an explanation for why it is so effective over such a short distance given the rather low concentration of CO2 at 400 ppmv (of course, water vapor is the predominate greenhouse gas absorber/thermalizer here). Most significantly, it supports that argument that CO2 above a certain ppm concentration can become “saturated” in its ability to further increase greenhouse-effect atmospheric warming. This explains, for instance, why Earth did not experience “runaway” greenhouse warming, and thus the extinction of all life, when Earth previously experienced CO2 levels 8 to 15 times higher than today’s level (Paleozoic era).
2) My understanding is that the relatively very slow “relaxation time” for a CO2 molecule to emit one or more photons after having absorbed a single LWIR photon is not unusual compared to that of other LWIR-active molecules, such as H2O or CH4.
Molecular relaxation times are determined by laws of quantum mechanics and are computationally burdensome (as well as being very difficult to find anywhere on the Web!) . . . if you are interested in pursuing this, I suggest you start with this slide presentation by Prof. William Happer: https://www.youtube.com/watch?v=PXg_JfuRqTU
In it, Dr. Happer has several slides regarding CO2 relaxation times and the underlying complexities.
There are many other very informative articles/communications from Dr. Happer available via Web search, many of which further discuss atmospheric thermalization of LWIR energy absorbed by GHGs.