By Christopher Monckton of Brenchley
The New Pause has again lengthened by another two months. On the normative UAH lower-troposphere dataset there has been no global warming over the 6 years 8 months from January 2015 to August 2021. As always, the Pause is calculated as the longest period ending in the present that shows no warming trend, taken as the least-squares linear-regression trend on the UAH satellite monthly global mean surface temperature anomalies for the lower troposphere:

The trend on the entire UAH dataset since December 1978, a period of 42 years 9 months, is equivalent to only 1.35 C°/century, even though the data began shortly after the naturally-occurring Great Pacific Shift of 1976 that is responsible for much of the warming over most of the period.

Furthermore, over the 18 years 1984-2001 a naturally-occurring reduction in cloud cover was responsible for most of the period radiative forcing (Pinker et al. 2005) and hence global warming.
IPCC (2021) tries to pretend that there has been 1.27 K global warming since 1750, all of which is imagined to be anthropogenic. However, the HadCRUT4 dataset showed only 0.91 K since 1850, but HadCRUT5, in preparation for IPCC’s latest report, pushes that up to 1.04 K.
Since January 2014, the beginning of the year after the previous IPCC Assessment Report, there has been only 1/8 C° global warming.
It is by now clear that even with constant adjustments to nearly all of the major temperature datasets it is difficult to discern clearly a large anthropogenic influence. But that is not what the world is being told.
Every natural disaster – Hurricane Ida, the drought in much of the western U.S., the wildfires in some nations, the floods in others – is instantly and automatically blamed on global warming that is barely happening.
A simple question for the climate fanatics: how can global warming be worse than you thought given that it is a whole lot less than you predicted?
The Pause that keeps giving warmist/alarmists a pause over it.
La-Nina watch is still in the forecast for Fall and Winter time which should help the pause along for a few more months.
Cold & Warm Episodes by Season
A pause on a proxy measured troposphere, from only one of the teams researching temps like this?
I think they see what they want to see…
All the main GAT series since 2015 show no trend or a falling trend.
Lol
https://wattsupwiththat.com/2021/07/03/el-nino-and-the-lengthening-new-pause-now-6-years-10-months/
Where you’ll find
Hey but you believe man did not land on the moon….Lol indeed
Huh?
If Loydo had bothered to look at the pictures in the head posting he would have seen the full trend since December 1978 clearly shown.
So another team (RSS) doesn’t see what it wants to see, Griff? If you charge bad faith on your opponents, should you not analyze the claims of your friends?
Leftists never judge themselves by the standards they hold others to.
If they did, how could they justify the lifestyles of their leaders?
leftists live by “rules for thee but not for me”. If they didn’t have double standards they’ve have no standards at all
“I think they see what they want to see…”
And you, griff, how much of your talk only repeats what you want to see?
griff, in the WATTS article posted August 31, 2021 at 2:36 pm, I posted a comment about your expertise and you responded with a challenge to say something concrete and scientific, which, being an actual Scientist, I did in a follow-up. Would you please return to that posting and refute my response to your request? Thank you.
Don’t be silly, Griff only does drive bys, a la Mosher.
Griff is a failure even as a troll.
What ever happened to Mosher?
Does anyone really care? Mosh devolved into a drive-by troll long ago. Such trolls are a dime a dozen.
There’s no urban heat island effect in satellite temperatures. As compared to surface measurements, which are chock full of it, and pairwise homogenization, which spreads it across even the clean data.
You are critical of the most comprehensive accurate unaffected by UHI or site setting changes system we have? Do you know that UAH is verified by the most accurate weather balloon carried instruments we have?
Or, are you seeing only what you want to see?
My understanding is, also, that the US Climate Reference network (by their own admission, gold standard) shows little if any warming since 2005. can anybody recall that post?
I don’t care who you are, that thar is funny.
Funny ha-ha? Or funny peculiar?
Sorry, griff: you are in a pause of your intelligence (if you got one of the later, of course)…
All griffter sees are the BS from the failed models, not facts.
Some people just can’t accept reality! Griff… is this a religion for you?
More cold – as we predicted in 2002.
EARLY-SEASON SNOWFALL HITS UTTARAKHAND, INDIA, EUROPEAN SKI AREAS OPEN IN SEPTEMBER AFTER HEAVY AUGUST DUMPS, + ‘GREEN’ EUROPE FACES ENERGY CRISIS AS WINTER LOOMS
September 2, 2021 Cap Allon
Prepare for energy restrictions, empty grocery store shelves, and ZERO help from the emergency services–work with the assumption that nobody is coming to help.
The BBC’s response – “warming causes cooling”
https://www.bbc.com/news/science-environment-58425526
Lying with statistics, is something I was good at seeing when I was doing my economics courses in the 1970s, it is a skill most can learn. In the case of temps rising since 1750, they don’t ask what the climate was actually like in 1750 (really rotten) and they fail to notice that it started to slowly warm from 1700 not 1750. In England, by 1810, we managed to warm from the 1600s mini ice-age so much, that the river Thames stopped freezing solid (yippee), though, we still had the cold Dickens years to go through, with snow in London feet thick from the end of November to the end of April.(read Pickwick Papers) Yes, you would need to be bonkers to want to go back to that. So, even though God warned them not to do it, liars do like to lie.
Well now we have a new, additional rapid warming, from human CO2 , on top of that historical/natural warming… and do note the Thames stopped freezing when it wasn’t dammed by old London Bridge any more
Now all you need to do is provide some evidene to support your imaginings of human causation. Prove that CO2 has had any influence in the warming at all.
He’ll just bite your ankles instead.
🙂
Uh, Griff, warming is cyclical. Prove CO2 didn’t cause early 20th Century warming, but did cause late 20th Century warming. It seems obvious the world has warmed from the Little Ice Age. Prove that CO2 caused all or most of that warming. UN IPCC CliSciFi GCMs run hot.
Your observation is effectively laying down a null hypothesis challenge for Griff to address.
So come on Griff, we’re getting down to the nuts & bolts of proper science now –
answer Dave’s observation: if the temps warmed in earlier times when CO2 was at “safe” levels, how can you attribute recent warming solely to man-made CO2?
Whatever made the temps rise earlier obviously had nothing to do with CO2, so what’s to say the same influence(s) aren’t responsible now, since we’ve established by past observation that CO2 alone doesn’t cut it?
Slight modification requested to include Anthony’s comment giffiepoo is trolling.
Could be:
Don’t confuse Griff with mere FACTS, Mr., his mind is already made up!
Nope. The last Frost Fair took place in 1814 – about 20 years before the old London Bridge was demolished. Also, in the early 19th century, the Thames froze at Rotherhithe which is well downstream of London Bridge and in a strongly tidal part of the river.
You won’t get anywhere using facts with griff!
You won’t even be given the courtesy of a reply
griff has his own facts and doesn’t need any from anyone else!
Yes but as a Londoner and sceptic I have to say that the embankment of the river made it flow faster but to the east and west of London pre drained marshland slowed the river down
Can you please provide evidence that the tiny human contribution to CO2 has had ANY measurable effect on temerature.You keep coming out with unsubstantiated statements and have NEVER offered any scientific, testable evidence that the hypothesis that Human CO2 is a driver of climate is in any way true. Put up or shut up.
In the minds of warmistas like griff, models are proof.
If you could put ALL of humanity (7 billion?) in one giant spot, from space it would hardly even show up as a small dot, yet we are to believe that humanity is the cause of all that horrible CO2? And that the CO2 is causing the earth to heat up, faster than it ever has, even though we KNOW it has been much higher before and didn’t cause any heating then, either! Looking down on earth, again, at all those swarming humans is similar to watching a huge swarm of ants from a height, and just about as remarkable. We humans hardly make a tiny mark on the earth. Yet some are so egotistical as to think that we are ‘harming’ the planet? Everything ON this planet, BELONGS on this planet, save for a few meteors and comets and such that ‘migrated’ here over the past 5 billion or so years! If we humans find a use for some of those ‘things’ we are not adding to or distracting from the earth. It, and US, too, are all just part of what we call the ‘earth’. Everything in and ON the earth BELONGS here! Nothing is ever wasted, on a long enough timeline. But people like Griff, and, of course, Chicken Little, all need something to fear, so today’s subject is ‘Global Warming/Climate Change’. But, the sky is NOT falling. Not yet, anyway.
My calculation – 90billion could tread water in Lake Superior, each with a sq m of space.
Another: The GND (green new deal) in the US estimated to cost $90 trillion. A dollar bill is ~15cm long. The distance earth to sun is 15 trillion cm. So 1 trillion bucks end to end would reach the sun. 90 trillion would make 45 round trips.
Apply your supposed skills in statistical physics, the laws of physics, math and Raman Lidar observations to see if you can debunk this compilation of known facts;
“Quantum Mechanics and Raman Spectroscopy Refute Greenhouse Theory
Blair D. Macdonald”
https://vixra.org/pdf/1811.0498v2.pdf
That is trivial to debunk. N2 and O2 have a zero electric dipole moment due to symmetry and therefore they cannot couple to linearly polarised light. Thus IR light is not absorbed by N2 and O2 despite those molecules having transitions are the right wavelengths. Raman spectroscopy excites those transitions by down conversion from an excited state which is allowed by quantum mechanics.
Izzy denies quantum mechanics!
It would rather believe late 19th century pseudo science.
Try reading the paper next time, D. izzy.
The electric dipole moment is well defined in quantum mechanics and to lowest order mediates the coupling between a quantum system and light. Hence if a molecule has a zero dipole moment then it will not absorb linearly polarised light. It is what is known as a forbidden transition.
OK, Griffypoo, you have to answer this question: Do you prefer to freeze to death and not be able to cook food and stay warm, or would you rather have a sunny, warm environment to live in, with appropriate seasonal changes?
You seem to be unable to coordinate seasonal changes with normal weather. Do you live in a sealed environment? That’s not healthy!!!
Seasonal changes are normal and part of the planet’s NORMAL cycle of existence. So where I live, we’ve been having a dearth of rainfall and my lawn looks chewed on, despite reseeding spots and watering, and yet we had nice, cool weather up to August 15, when it got hot and obnoxious, and the humidity levels rose substantially. That rise in humidity would be NORMAL for increased summer heat, since water tends to evaporate in heat. Dearth of rain, though, until the other day.
Yeah, water also does something called subliming in cold weather, but that’s going from frozen (ice) state to gas state, which is nothing unusual. Conditions have to be just right for water to do it. Frozen CO2, a/k/a “dry ice”, is notorious for its sublimation antics.
What rapid warming, Griffypoo? I’m really concerned about your misconception of natural events in physics and atmospheric chemistry. never mind how weather works.
To Griff, every change in the weather is a CRISES! Something that, to him, has NEVER, EVER happened before, not withstanding people who have actually LIVED through times when it actually DID happen. So, don’t confuse him with facts, because his mind is ALREADY made up, and it doesn’t listen to the truth! AS for living in a sealed environment, we have a president who does that, never ‘hearing’ about anything bad in his proclamations! And yes, it is VERY unhealthy, and not just for him!
I’ve been through more blizzards than I care to count, starting when I was 7 and the summer weather had been quite hot (113F in the the shade) and rainless. Garden nearly wilted, which upset me because when you are 7YO and you plant five rows of garden peas and 4 of radishes and onions, you expect results!!!
Eventually, it rained and everything was back to normal.
Griff is, as usual, merely peddling the Party Line. We have a small additional warming, not a rapid warming, arising from returning to the atmosphere some of the CO2 that had been there before. Distinguishing between natural and anthropogenic contributions to overall warming remains problematic, but the overall warming rate is small enough to be well within natural variability, which is why only 0.3% of published papers on cloimate chynge state explicitly that recent warming was chiefly anthropogenic.
The global warming protagonist always chant the mantra ‘trust the science’ yet ignore the Greenland and Antarctica ice core proxies which show we are at the end of the coolest and longest interglacial of the lot. We need to hope and pray that any man made co2 helps delay the overdue period of glaciation
Yes we’ve proved that we humans can survive a very warm climate, but the evidence is still out on whether we can all survive a global icing like the last few. Luckily, though, it probably won’t occur instantly, we hope, so maybe we can find another planet to migrate to?
It will start with not enough food supplies in grocery stores.
OH, wait, we just had that during that lockdown thingy…!
That’s an improvement. Griff usually claims that there is no natural warming, it’s all CO2.
So griff, when would you prefer to be alive? Back when the old London Bridge was still standing, i.e., the good old days of River Thames freeze-ups and Frost Fairs and Dickens?
Or today when “we have a new, additional rapid warming, from human CO2”, that will likely kill you (in your estimation), and ruin the lives of your children (hopefully you don’t have any)?
If griff has any children he doesn’t need CO2 (or anything else) to ruin their lives, just having him as a parent will do that job.
Has not CO2 reached saturation in the atmosphere? I believe we have or rapidly reaching saturation.
Why not see the benefits of increased CO2? Plant food means more food and the expansion of better lands that can be useful to society and a growing world population.
Anyone who only argues CO2 as the driver of warming is being dishonest and lacking in critical thinking skills. Foolish, dangerous and there will be hell to pay when the green energy insanity fails miserably.
Anthony
You correctly recognize a crucial matter, namely context. Stats without context are worthless. A historical incident without context is meaningless. A snapshot without the complete video is worthless. This is what I find most frustrating in the claims of alarmists that they are so adverse to giving the full context.
Take the recent IPCC report “FAQ 8.3 Climate change and droughts.” It gives a world map with certain brown areas illustrating the caption: “In some regions, drought is expected to increase under future warming.” One of the large brown areas covers the whole of Southern Africa.
context comment continued:
South African records covering over 350 years describe this area as alternating between droughts and floods. Cape Town in March 2018 was said to be fast approaching Day Zero when they would run out of water. Today the dams are 101.9% full. They have had a succession of four good years of winter rain. In 2007-2010 the country had bumper harvests because of weather conditions. Because of good rainfall across large areas it appears that 2019-2022 will have a repeat of this. However, there are some areas with serious drought like around Port Elizabeth. Their main dam with some 5% has been very low for a number of years. But overall Southern Africa weather has not co-operated with the pundits and context blows up their alarmist narrative.
I looked this up on Wiki… Old London Bridge (1209–1831) Demolished 1832…….
and it still seems from a few comments that, liars do like to lie.
Anthony,
Exactly! Great observation. The various books I have read detail precisely what you stated. Paintings during that time, ice skating on the Thames River makes your point. Thank goodness the climate has warmed. The low information reader and the MSM would fail to see your point.
As the Wall Street Journal always said; “If you torture statistics long enough they will confess to anything.” I think this is an apt description of the entire Global Hysteria movement that includes Global Warming and Saars-CoV2. Most of my older friends just want to duck and get out of the way with so little time left. The problem is the same as it has always been; liberty and freedom aren’t free.
It’s actually worse than that. There is no evidence to support CO2 in control of climate, nor that we are in control of CO2. This is medieval. We are still a superstitious people.
Absolute nonsense! There is any amount of detailed evidence, supported by the indisputable physics of how CO2 works in the atmosphere!
What is it in the phrase ‘CO2 in control of climate’ that you do not understand?
“indisputable physics” – you are having a larf!
See https://notalotofpeopleknowthat.wordpress.com/2021/08/31/the-impact-of-co2-h2o-and-other-greenhouse-gases-on-equilibrium-earth-temperatures/
Phillip, that is a very well written paper, fully referenced, difficult to refute the author’s equation based methodology….
full version here
http://article.ijaos.org/pdf/10.11648.j.ijaos.20210502.12.pdf
He’s having a physic.
That “indisputable physics” is the primary reason that alarmists fear debating skeptics in public.
They have zero proof for the claimed CO₂ physics. Like giffiepoo’s, lolly’s, izzy’s, silly simian’s constant whinging, there is no proof supporting their specious nonsense.
It is superstition belief to actually think that industries trading carbon credits (arbitrage profits for international banks and traders) and sending billions of dollars/pounds/euros to a UN Climate Aid Fund (to buy favors) has any relevance to “solving climate change.”
It is all about money and power. IAnd at its core, really not even about money, for if you have all the power, all the money (productvioty output) is yours. The UN, the UNFCCC, and all the carpet bagger climate pseudoscientist rentseekers are all complicit in massive fraud on the public. A confidence game to scam the middle class to give up our freedoms and affluence. The climate scam is Pure Communism at work.
It’s all about the money and power, but let’s not forget the gullibility and ignorance of the people that allow it to happen.
Griff, gullible and ignorant? How dare you! 😇
Still confused about the meaning of evidence, I see … just like most true believers. “Any amount” also includes “0” so finally you got something right.
Uh, Griff, the UN IPCC CliSciFi models dictate a tropospheric hot spot. Their “physics” is obviously incorrect. Do you read anything by actual atmospheric physicists like Dr. Lindzen?
Yes, there IS any amount of evidence, and that amount, when actually measured, approximates zero. Prove me wrong. Use real data.
Seems you have clue how physics work.
Dear Griff
The physics of how CO2 works in the atmosphere supports less than one tenth of the global warming that the IPCC predicts.
Did you not know that?
But you can’t reference any.
It’s most often phrased as “there is overwhelming evidence …..’ but, curiously in all its forms, statements like that have never, ever, in the entire history of written and spoken language, been followed by any evidence.
Where’s your proof?
Can you explain this “indisputable” physics?
Thank heavens, there is any amount of detailed evidence.
But unfortunately your post seems to have lost that part. Please could you re-post it?
Griff is, as usual, flat-out wrong. It is known that returning to the atmosphere some of the CO2 that was there before will cause some warming, but it has long been clear that the official predictions of how much warming are substantial exaggerations compared with sober observation.
As a Yorkshire Terrier, he does the best he can with the bones they toss to him.
Yip!
Please don’t denigrate Terriers.
Use instead, a common prey of terriers. Invasive obnoxious Norway rats
Might be too late, the tag “Yorkie” seems to have stuck. But yeah, Terriers are usually pretty sharp.
🤣
Indeed there is “any amount” and specifically that amount is ****ZERO!!!!****
Since the models don’t predict well, we obviously do not know how CO2 really works in the actual, entire atmosphere. Here are your indisputable physics: Physic (fĭz′ĭk) n: 1. A medicine or drug, especially a cathartic.
Indisputable?
People who write should not use words that they do not know the definition of.
Jim, we do put CO2 into the atmosphere. Relax. UN IPCC CliSciFi models overstate CO2 impacts.
Where did Jim say any different?
Jim: “There is no evidence to support CO2 in control of climate, nor that we are in control of CO2.”
But, but, but Griff told us we were all gonna die of global warming
And the RSS? and the lower atmosphere?
Mears adjusted RSS to conform to the team’s meme. Read the derivation of UAH6’s methodology. Anyway, even RSS’s temperature trend is significantly lower than the UN IPCC CliSciFi GCM’s.
Griff is, as usual, wrong. Some years ago, when Senator Cruz reached out to the Heartland Institute to ask for a single piece of evidence that global warming was not all it was cracked up to be, Joe Bast sent him a graph showing that, at that time, there had been no global warming for 18 years 9 months. NOAA’s State of the Climate report for 2008 had said that any period of 15 years or more without global warming would indicate that the models were wrong.
So the Pause had to be got rid of. I predicted that month that RSS would tamper with their data to eradicate the pause – and that is exactly what the dreadful sMears did – he who calls those who dare to disagree with him “deniers”. RSS is no longer a reliable source.
Yes, thanks for the perspective and conclusion.
I wonder if Karl got a retirement bonus for his role in the fabrication?
NOAA’s State of the Climate report for 2008 had said that any period of 15 years or more without global warming would indicate that the models were wrong.
Firstly, to be pedantic, no, it did not. In fact you have to do a bit of detective work to track down the source and details of this canard, it actually appears in a paper published in 2009 by the Bulletin of the American Meteorological Society (BAMS) entitled ‘Do global temperature trends over the last decade falsify climate predictions?’ which is in turn included in the review article ‘State of the Climate 2008’ published annually as a special supplement to BAMS. Clear?
(It also appears in Lord Monckton et al 2015 ‘Keeping it simple: the value of an irreducibly simple climate model’. Quote:
” it is often stated that periods ≥15 years without warming are inconsistent with models’ predictions. For instance, 68., 69. state: “The simulations rule out (at the 95% level) zero trends for intervals of 15 year or more, suggesting that an observed absence of warming of this duration is needed to create a discrepancy with the expected present-day warming rate”.”
Reference 69 is to the ‘Falsify?’ paper.)
But what was actually being discussed? What were these ‘simulations’? Let us take a look:
Two things are clear: the ’15 years’ refers to surface rather than tropospheric datasets, more importantly it refers to datasets that have been ENSO-adjusted.
So using this quote in the context of the RSS dataset which is neither a surface dataset nor ENSO-adjusted is thus doubly-wrong. The mendacity runs deep with this one.
Yes you predicted that in November 2017, an amazing prediction since the paper by Mears and Wentz describing the adjustments was submitted in its final form in June 2017 and was first received in October 2016.
RSS certainly isn’t using physics to derive their alleged temperature series.
Mears should be ashamed forever.
A relatively rare (happens about 17% of the time) back-to-back La Niña cycle will be in effect from around November of this year, so by the middle of next year, UAH6.0 will likely hit -0.3C, which will substantially extend this new pause.
Moreover, both the Pacific and Atlantic are near (or already in) their respective 30-year cool cycles, which will eventually cause the pause to start from around 1996, so by 2026, the pause could be in its 30th year…
We’ll see soon enough.
The Australian BOM does a great job on tracking ENSO sea temperatures. La Niña is definitely forming
http://www.bom.gov.au/climate/enso/#tabs=Pacific-Ocean&pacific=Sea-sub%E2%80%93surface
Eastern ENSO regions are following suit
I hope not! We’re in drought conditions in California and Las Niñas don’t help that situation. We had a lot of water, but the Democrats threw it all away.
Thomas-san:
There likely won’t be an El Niño cycle until 2023, so California will suffer terrible drought conditions for at least another year.
I really feel sorry for the people of California, especially the farmers who will have a very tough time of it.
The Grapes of Wrath 2
Saying this, that CA “will suffer” through years of drought, as if it is a foregone conclusion, is not the sort of thing a cautious climate realist would declare in unequivocal terms.
Simply put, the uncertainty is large and nothing is a foregone conclusion.
Not a foregone conclusion re whether or not there will be a la nina, and not a foregone conclusion that if there is or is not one, it means years more of drought.
This is what alarmists do, give voice to certainty when there is none, and intone gravely on an uncertain future.
We should not emulate them.
Just sayin’.
If the climate and its associated weather events were amenable to statistical analysis then all the climate models would converge and would match actual observation.
It’s been raining quite a bit in Arizona. Arizona is close to California. Some of that rain may slip across the border.
Ohio goziamas, Samuria-sama,
We can store more than five years of water in California. The problem is the Democrats emptied the reservoirs, based on the theory that fish are more important than people.
Fish are more important than shipping almonds to China. Almonds are one of the major crops using water in the naturally driest part of CA and most of them are exported to China. I prefer to eat wild Salmon and truly hate any more extinctions of truly beautiful and tasty species. Fishermen are as important as almond farmers.
I think they rated humans as more important since releases are made for flood control and hydroelectric power generation. For example, the Oroville hydroelectric plant was shut down last month because the level dropped too low. In spring 2019 Oroville was close to its full level with 47″ of rain that season, the next season only 19″ and therefore significantly lower level, this season so far 16″ and record low levels. It’ll be a couple of months before significant rain can be expected, hopefully a more normal season will top up the reservoir.
While there is some correlation between wet years in southern CA and el nino events, the relationship is not perfect, and certainly does not make anything like a rule.
Neutral ENSO years are all over the map re rainfall in CA as a whole.
And la nino years have been dry or wet.
I for one am not wringing my hands…yet.
Or ever, really.
60 million people should not be living in a place that is largely a desert.
Fun with Statistics: El Niño and California Rainfall | NOAA Climate.gov
Many do not click links, so here is a quote:
“Can the past give us a hint at what the future may hold?Not surprisingly, the two regions have historically seen different impacts from El Niño. In fact, the relationship in the San Joaquin Valley can best be described as “kinda messy.” There are El Niño “years” with lighter amounts of rain… La Niña years with heavy rain.. and neutral years all over the place (1). Yes, if we took an average of all the El Niño, La Niña and Neutral years together, we would discover that, on average, El Niño years meant higher rainfall totals. But from looking at Figure 2b, we know that there is a lot of variability in the historical record. Thus, we can conclude that while El Niño might in general lead to higher rainfall totals, there certainly is no 100% guarantee.
This holds true for areas that show even stronger relationships between SST anomaly and rainfall, such as southern California (Figure 2a). One interesting aspect is that rainfall possibilities during neutral and El Niño are somewhat similar. In other words, the onset of El Niño might not lead to a strong increase of wintertime precipitation compared to Neutral years. Neutral and El Niño years in this region both show a large range of possible outcomes, which includes some pretty wet years (2).
It is only during La Niña (when the tropical Pacific is colder-than-average) when the number of wetter years diminishes. So in this region, a declaration of El Niño versus ENSO-neutral does not historically mean a large change in rainfall probabilities. In either case, there is a wide range of possible rainfall totals, including above-average accumulations.
From the historical record alone, it is clear that there never is a 100% confidence in an above-average, below-average or average rainfall forecast, even if there is an El Niño or La Niña. The best we can say is that there is a tilt in the odds in one direction or another.”
“Many do not click links, so here is a quote”
I don’t usually click links, unless an interesting excerpt is provided which causes me to want to know more.
Correction: Population of CA is not 60 million, it is slightly under 40 million last time I checked.
Sorry for the typo.
The point remains the same.
It is roughly the inverse of New Zealand: 5 million people, 40 million sheep.
That seems about correct. 40 million Democrats and two or three Republicans.
Thanks Nicholas. I have noticed that in the past decades there have been some strong El Niño years that were not wet in Southern California. I think we get most of our water from the Colorado River and from aqueducts that bring water from Northern California, so rain in Souther California might not do us much good.
If 60 million people want to live in a near desert, they better build some good water storage and delivery systems, and not throw away the water that they do manage to store.
Welcome to California, an arid state.
a) It’s normal for California to be in drought.
b) Make sure everyone you know, knows it was the democrats that drained the reservoirs.
c) The first places that should have their water shut off are the State Legislature Offices and buildings.
d) Second, shut down every well on every golf course and shopping malls. They can not pay retail prices for water from the main water supply.
e) Make sure that the first faucets, toilets and sprinklers turned off are those of the California legislators.
Welcome news SAMURAI!
I’m going to miss the warmth, but I am far more eager to see the climate scam cartel destroyed.
I have warm clothes and a wood stove.
With luck, those fools thinking it will be warmer forever with mild winters, will be thoroughly cold knee deep in snow while installing solar arrays and wind towers.
Gee- start with a conclusion-no warming, the find the right formula, and right data set that confirms it. That’s real sciency- no wonder WUWT commands so much respect in scientific circles.
Tony, even the UN IPCC CliSciFi AR5 acknowledged the pause. The recent Super El Nino broke it. The ongoing temperature decreases should affect surface and atmospheric temperature trends. But, who knows?
Back in 2005 the U.S. constructed the Climate Reference Network (US CRN), a series of hundreds of state-of-the-art weather stations located in pristine locations in the lower 48, Alaska and Hawaii. As of last month it shows slight cooling for 10 years and 4 months. So whatever people in the U.S. think they are feeling, it ain’t country-wide warming.
The way I read the temperature graph thirty years of warming ended about 2004-5 and a pause began which, if it matches the pauses that began about 1915 and 1945, should last until about 2035.
Must be clueless Pause-denying Troll Day. Lucky us.
Using the same alleged cherry picking complaints as before.
Odds are they are the same crying trollops as before.
Didn’t work then.
Won’t work, now.
How
leftist, always accuse your opponent of your own sins/acts/crimes etc….It’s “Projection,” seeing others through the lens of ones own Shadow.
Or you could start with the latest temperature point in a data set and work backwards to the nearest point which gives you a line of zero warming. If the end were really nigh you’d get a few short periods of no warming, but in general they’d be insignificant.
Over six years is not insignificant.
JF
How do you calculate the significance of this period?
You take a look at the graph showing no trend in global warming for about seven years and you ask how likely it is that there will be such long periods without warming so often in the temperature record, given that anthropogenic global warming is supposed to be catastrophic.
In other words, unlike paid totalitarians such as Bellman, we merely report the data and allow people the liberty to draw their own conclusions.
No, the question I’m asking is how you determine the pause is statistically significant. In order to do that you need to define what a pause is, determine the null hypothesis, then determine a test that will fairly tell you how likely the observed trend would have happened if the null hypothesis had been true.
Given the uncertainty of you pause is much larger than any past warming I find it difficult that you have done this exercise.
If you had, you could show your work rather than resorting to ad hominems.
Haha!
This is rich…a warmista with thin skin!
“Ouchy…that ad hominem hurtzed me!”
What next, thin skinned lawyers?
Boo frickin hoo.
Put on your big boy panties if you are gonna take the side of those who want to drive us all into poverty.
Not upset at all by Monckton’s silly insults. I’m sure no intelligent person here really thinks I’m a paid totalitarian. I just like to occasionally highlight when he resorts to them as a substitute for actually justifying his claims.
You just admitted you are trolling.
Maybe I didn’t word that as carefully asI should have. “as a substitute” is refering to Monckton’s usage, not mine.
Dude, you’re not a casual observer; you have skin in the game, because you’re only appearing on temperature related issue to dismiss anything that contradicts the warming hypothesis. Whether you’re a totalitarian or not is just a consequence of that position.
Lots of lawyers are thin skinned.
Once you find their weakness, you can play them like shrieking harps. Usually it includes their egocentricity and/or narcissism.
Mr. Bellman: Your question assumes that Monckton is the one trying to prove something. It is the model folks who are trying to prove something with their models. If Monckton’s data falsifies the models, he has met his burden and doesn’t need to show statistical significance, he only needs to show that models predict heat which is not happening. Nice try, but your effort to muddy the water was successful (per Joe Biden definition).
I assume Monckton isn’t trying to prove his claims, with good reason. But if he wants skeptics to accept his claim that there’s been no warming for exactly 6 years and 8 months, the onus is on him to provide some justification.
Lazy, too.
He has provided the evidence it is self-evident from the graph and regression line.
Now, the question of its practical significance is the important question. However, he leaves that up to the readers to reach their own conclusions.
But he has just shown you there hasn’t been any accelerated warming for six years and eight months.
Who said anything about accelerated warming? I’m questioning whether there is any significant evidence for a change in the long term trend over the last few years. My conclusion is there is insufficient evidence for either a slow down or a speed up.
All Monckton has shown is that for a specific period the best fit for the variable data is for no change, but that is not at all the same as showing evidence that this represents a change in the rate of warming since 1979, rather than the effect of starting the trend just before a massive El Niño and ending on a LA Niña. Choosing different periods, either longer or shorter you can find best fits that show a faster rate of warming, but again that is a long way from showing evidence that there has been an acceleration in warming.
How do you determine statistical significance in a system that is not amenable to statistical analysis? If the climate were amenable to statistical analysis then all climate models would converge and their output would match observations. The models don’t converge. There isn’t even any agreement on what the inputs to the models should be!
About the only statistically significant thing about climate is its dependence on the earth’s orbit and its axial tilt – i.e. seasons. Even then it’s impossible to forecast what the summer, fall, winter, and spring weather will be in detail next year because it is not amenable to statistical analysis. Too many unknowns and too many unknown unknowns.
If you think the UAH data is “not amenable to statistical analysis” then how can you claim there is any sort of pause. The “pause” only exists as a concept because of some sort of statistical analysis, just not a very good one. This has nothing to do with models converging, it’s not about predicting the future, it’s just about the idea of claiming something happened in the recent past with no attempt to test if this is likely to have happened just by chance.
You asked abut “statistical significance”, not the use of statistics to analyze the data.
“Statistical significance” implies the past influenced the present or that the present influences the future. Next years climate is *NOT* determined by this years climate therefore there is no statistical significance that can be assigned to current climate.
This becomes even more important when trying to use the GAT as a proxy for climate. The GAT is *not* climate, it doesn’t even imply anything about climate. The GAT can’t tell you if maximum temps are going up or going down. Same for minimum temps.
CM is merely determining the current trend for the GAT. Whether the slope of that trend line stays the same, goes down, or goes up is determined by physical processes that the GAT simply doesn’t even know about, let alone handle properly.
Nothing about the climate “happens by chance”. It happens because of the totality of the physical processes that the climate scientists simply don’t understand as a coherent whole and don’t handle properly in their models. If the climate scientists did understand the whole Earth system then you could assign some statistical significance to the model outputs. The models *would* all converge and would match observations.
I’m not sure you understand what statistical significance means. It’s just an indication that an observed result is unlikely to have happened in the absence of a cause, i.e. if the null-hypothesis were true.
If, for example I said that temperatures were rising over a specific period, and could show that the best linear fit over that period had a positive fit, it would only be statistically significant if you could show a trend of that magnitude was unlikely to have happened if there was no actual warming.
In the case of the pause, I might interpret that as a claim that warming had slowed down, and then try to show it is unlikely that you would have seen a zero trend if warming was continuing at the same rate.
Your probably right to say none of this happens by chance – what is random in the universe – but there are clearly variations month to month some of which can be explained others might just as well be chance. But when you talk about the rate of change in temperature you are only talking about that change compared with time. Any other changes are noise to that signal and create uncertainty in the best fit trend, regardless of what caused them. The “pause” period starts on a high point ends on a low point – the calculations for the trend doesn’t take into account whether they are part of the ongoing trend, or just random fluctuations, hence the large uncertainty. What would the trend look like if that big spike hadn’t happened in 2016, or if there had been a spike in 2021?
Of course, if you do know what is causing some of this variation, you can always try to factor them out. I suspect if you factored out the ENSO conditions over the last 7 years, the trend would look quite different.
“I’m not sure you understand what statistical significance means. It’s just an indication that an observed result is unlikely to have happened in the absence of a cause, i.e. if the null-hypothesis were true.”
GAT is not an observed result. It is a calculated result. Therefore how can it have a cause?
The GAT trend line is just that, a trend line. It is no more predictive than the climate models projecting a linear trend line into the future and calling it a prediction.
“If, for example I said that temperatures were rising over a specific period”
The GAT is not a temperature. It is a calculated metric. There is no way to know what causes it to go up or down. Are max temps going up? Are min temps going up? Are both going up? Since you don’t know how can you say what the cause is?
“In the case of the pause, I might interpret that as a claim that warming had slowed down, and then try to show it is unlikely that you would have seen a zero trend if warming was continuing at the same rate.”
The GAT doesn’t tell you what is changing. It could be that max temps are falling at the same rate minimum temps are rising. Is min temps going up considered to be “warming” of the Earth?
“but there are clearly variations month to month some of which can be explained others might just as well be chance”
Nope. The thermodynamic system we call Earth doesn’t operate based on chance, it is a macro system that doesn’t have to be analyzed using quantum physics. Those variations occur because of the physics of the system. If those physics were known completely and could be modeled then all the models would converge and would match with observations. What *is* chance is if the models actually get the predicted temperature correct!
“But when you talk about the rate of change in temperature you are only talking about that change compared with time. Any other changes are noise to that signal and create uncertainty in the best fit trend, regardless of what caused them.”
There aren’t any changes to the signal that don’t have time as part of the change. That’s why the temperature profile is not stationary.
.”The “pause” period starts on a high point ends on a low point – the calculations for the trend doesn’t take into account whether they are part of the ongoing trend, or just random fluctuations”
The pause period starts with today and goes backward – by design. And, again, there are no RANDOM fluctuations. There are *natural* fluctuations but they are *not* random, they follow the rules of physics. If our measurement systems are not sufficient to identify what is causing the fluctuations then *that* is the issue. The uncertainty comes from our ability to measure, it can’t just be written off as “random change”.
“Of course, if you do know what is causing some of this variation, you can always try to factor them out”
Factoring out the causes of variation is done to suit an agenda, and that agenda is not science.
“GAT is not an observed result. It is a calculated result. Therefore how can it have a cause?”
The “observed result” in this case is the pause. It has been observed by Monckton that if he starts a trend from January 2015 it is not positive.
“There is no way to know what causes it to go up or down”
I’m not interested at this point what causes it to go up and down. The objective is to establish if it is going up or down or staying flat.
“Nope. The thermodynamic system we call Earth doesn’t operate based on chance, it is a macro system that doesn’t have to be analyzed using quantum physics.”
I said “might just as well be considered to be chance”. not that they were caused by chance.
“The pause period starts with today and goes backward – by design.”
You still haven’t explained what that means, or why you think it’s relevant. I’ll remind you again of how Monckton describes the pause:
Note how he describes it ending in the present. How do you both start and end in the present?
“And, again, there are no RANDOM fluctuations. There are *natural* fluctuations but they are *not* random, they follow the rules of physics.”
And again you are agreeing with what I said.
“The uncertainty comes from our ability to measure, it can’t just be written off as “random change”.”
But the issue is, regardless of what caused the fluctuations, they are not part of the linear trend. We are interested in how global anomalies change linearly over time, not how they change as a result of ENSO conditions.
I’m old enough to remember the 2016 El Niño and the numerous WUWT articles pointing out how in no way should you base a linear trend ending on it, and call it global warming. If your argument is that we have to ignore ENSO effects and just look at any linear trend as real, with no uncertainties, will you say the same when the net big El Niño arrives?
“The “observed result” in this case is the pause. It has been observed by Monckton that if he starts a trend from January 2015 it is not positive.”
You didn’t address the issue! How do you determine the CAUSE from an average of mid-range values that totally obscure what the actual temperature profiles are?
“I’m not interested at this point what causes it to go up and down. The objective is to establish if it is going up or down or staying flat”
*YOU* are the one that brought up the subject of “CAUSE”. –“It’s just an indication that an observed result is unlikely to have happened in the absence of a cause”–
If the trend line can’t help you identify a CAUSE then of what use is it in the physical world we live in?
“I said “might just as well be considered to be chance”. not that they were caused by chance.”
ROFL!!! Nice dance move. But we all know what you were trying to imply.
“You still haven’t explained what that means, or why you think it’s relevant. I’ll remind you again of how Monckton describes the pause:”
It means that claims (including yours) that CM is cherry-picking dates is incorrect. He cherry-picked nothing.
“Note how he describes it ending in the present. How do you both start and end in the present?”
The trend line ends in the present. The data analysis *starts* in the present. Get it?
“And again you are agreeing with what I said.”
Really? You didn’t say —“the calculations for the trend doesn’t take into account whether they are part of the ongoing trend, or just random fluctuations”–?
You can run but you can’t hide.
“But the issue is, regardless of what caused the fluctuations, they are not part of the linear trend”
If you can’t account for the natural variation then how do you know the trend line means anything? You are, as usual, trying to dismiss uncertainty as a factor in anything to do with temperature measurement.
“We are interested in how global anomalies change linearly over time, not how they change as a result of ENSO conditions.”
“I’m old enough to remember the 2016 El Niño and the numerous WUWT articles pointing out how in no way should you base a linear trend ending on it, and call it global warming. If your argument is that we have to ignore ENSO effects and just look at any linear trend as real, with no uncertainties, will you say the same when the net big El Niño arrives?”
You are the one that just said we should ignore ENSO, not me. And it is you that are trying to ignore the uncertainties by saying we can ignore natural fluctuations and just concentrate on the trend line.
“And it is you that are trying to ignore the uncertainties by saying we can ignore natural fluctuations and just concentrate on the trend line.”
That is the exact opposite of what I am trying to say, and if that is what you understand me to mean I obviously haven’t been making myself clear.
A trend line is simply the best linear fit for the data. You need to know the uncertainties (the standard error) to see how meaningful it is, in particular to see if it is statistically significant. And the uncertainty in the trend depends on how much natural fluctuation there is around the line along with the sample size.
It’s very much my point that you cannot ignore the uncertainties in any linear regression, hence my claim that there is no evidence that the trend of the last 6 years and 8 months is significantly different to the trend up to that point.
“It means that claims (including yours) that CM is cherry-picking dates is incorrect. He cherry-picked nothing.”
and
“The trend line ends in the present. The data analysis *starts* in the present. Get it?”
You still refuse to explain exactly how you think Monckton determines the start date for each pause. I’ve shown how you can determine it by searching from the earliest date forward. You could also start at the most recent date and work backwards, though this would be a little less efficient. But whichever direction you do the search, you will get the same answer.
I fail to see how the direction of the search can avoid the charge of cherry-picking, when the whole point is to find the exact month that will give you the longest possible non-positive trend.
“You still refuse to explain exactly how you think Monckton determines the start date for each pause”
The difference in temp at time -t1 and time t0 to start with. Then the difference between time -t2 and time t0. And so on. Why is this so opaque to you?
”You could also start at the most recent date and work backwards, though this would be a little less efficient”
Now you have it. No cherry picking the start date.
If you can’t see that working from the present backward in time is NOT cherrypicking the start point then I’m sure you are being willfully ignorant.
Firstly, why are you looking at the difference between temperatures? That’s not how the trend is calculated.
Secondly, what’s opaque is that you are leaving out the critical bit, where you have to say how you know when you’ve found the start of the pause.
As I said you can search backwards, but you will find the same start month as you do searching forward. If one is cherry picking so is the other. And as the only objective is to find the start point that gives you the longest “pause”, I find it difficult to see how it isn’t picking a cherry.
Wow! If there is no difference in temperatures then you have no slope – your trend line will be horizontal – i.e. a pause.
You work backwards till your line no longer has a zero slope.
You are *still* missing the point. Picking a start date in the past *is* cherry-picking. Starting the analysis in the present and working backwards is *NOT* cherry-picking.
If there is a pause then that *is* significant and finding where it started is not cherry picking. How can you be so dense?
If you have lost something during the day do you go all the way back to where you left your house and then search forward? Or do you start looking backwards from where you currently are?
Your previous comment was suggesting you simply compared the difference between a single month and the current one. That is not how you determine the trend. You don’t just look at the difference between the start and finish points, you have to take into account all points in between.
But the main issue is where you say “you work backwards till your line no longer has a zero slope.” Thus is what I suspect a lot of people who go on about working backwards think the Monckton pause is derived, and it simply isn’t so. There would be no guarantee that this would give you the longest pause as Monckton requires.
With the current date, you get a positive slope going back just 2 months, starting in June 2021. In fact a trend equivalent to over 10°C / decade! So maybe you would object to a trend of just 3 months. However go back just over three years and the trend is positive, starting from June 2018. Do you end the search there? No, because you know it will turn negative again.
So you go back through more positive trends , then through a couple of years of negative trends, until you reach December 2014 which is again positive. And there you stop and declare the pause now starts January 2015.
But why did you stop at that points? Only because you can see that there are not going to be any more negative trends however far back you go.
The point is you do not stop as soon as you find the first positive trend, you stop once you have found the last negative trend, or if you search forward, the first negative trend. Either way you get the same result, and if one is cherry picking so is the other.
“Your previous comment was suggesting you simply compared the difference between a single month and the current one. That is not how you determine the trend. You don’t just look at the difference between the start and finish points, you have to take into account all points in between.”
Did you read this before you posted it? How do you determine the slope of a line segment? y1-y2/delta-x
You then step backward till you find a point where the slope is not zero. Again, what is so hard abut this? You are trying to find the starting point where the trend is zero. You are *NOT* cherry-picking the start point as you claimed! You are *finding* the start point.
“With the current date, you get a positive slope going back just 2 months, starting in June 2021”
Now you are trying to claim that the pause isn’t real? That it ended in June, 2021?
Take it up with CM.
Did you read Lord Monckton’s article. He is not looking for the slope between two points but “the least-squares linear-regression trend”. The formula for that slope is not y1-y2/delta-x. It’s
There’s nothing hard to understand, in the idea of stepping back until you find the first positive trend – it’s just not how Monckton does it. Your method does not find the longest possible non-positive trend, which is what Monckton wants. Your method will actually find the shortest pause, stopping as soon as the trend becomes positive.
“Now you are trying to claim that the pause isn’t real?”
I’ve been saying it’s not “real” all along, or at least it’s not something with any statistical merit at present. But I’m not the one saying the pause only started in July 2021, you are if you insist you stop at the first positive trend working backwards.
Jeeeshhh! Bellman, if you step backwards and recalculate the trend line and the slope of the trend line is something other than zero (i.e. y1 = y2) then you have either warming or cooling. If the slope is zero then you have neither warming or cooling.
You have *not* succeeded in moving the issue away from the fact that you claimed CM was cherry-picking his start data. HE DIDN’T.
The point is to find the length of the CURRENT PAUSE. Not the longest pause we have recorded. Why do you keep trying to shift the issue to something else?
The pause did not start in July, 2021. The CURRENT PAUSE has extended through July, 2021. Who knows when it will end?
Stop trying to rationalize your claim that CM is cherry picking data. He isn’t. You haven’t convinced anyone that he is.
“(i.e. y1 = y2)”
What do you mean by y1 and y2, they would normally refer to specific data points, initially you said they were the temperature at t1 and t2. do you now accept that the trend is derived from least square linear regression and not simply comparing the temperature of one month to another?
“The pause did not start in July, 2021.”
Of course Monckton doesn’t start his pause in July, but that’s where your method would put it – remember you say you search backwards and stop as soon as you get a positive trend.
“The point is to find the length of the CURRENT PAUSE“.
The point is to find the start date that will give you the longest non-positive trend to the current date. Saying you want to find the length of the CURRENT PAUSE is just begging the question as the pause is defined by the selected date. In case you haven’t noticed this is a different start month each time.
“Why do you keep trying to shift the issue to something else?”
All I want at this point is for you to show me you understand how the start date is selected using a backward search, and then to explain why it matters if you search forward or backwards.
“What do you mean by y1 and y2, they would normally refer to specific data points”
Are you kidding? What’s the issue of the discussion? Think about it!
“The point is to find the start date that will give you the longest non-positive trend to the current date.”
You said CM was cherry-picking the start date. Are you changing your claim?
“Saying you want to find the length of the CURRENT PAUSE is just begging the question as the pause is defined by the selected date”
Guess not. You don’t *select* a start date when you are working backwards!
“xplain why it matters if you search forward or backwards.”
What’s the use? You aren’t going to change your mind that CM is cherry-picking the start date of the pause. All you are doing is trying to rationalize that assertion to yourself. I’ve explained this over and over and you won’t listen.
*FINDING* a start date is not the same as *PICKING* a start date.
“You don’t *select* a start date when you are working backwards!”
Really? What’s the point of searching backwards if you don’t use it to select the start date?
“*FINDING* a start date is not the same as *PICKING* a start date.”
How do you pick the ripest cherry if you don’t find it first? Monckton finds the start point that gives him the desired result, the longest pause, and then picks it as his start point.
You are making yourself look like a fool. Stop it. Finding the start of a pause is not the same thing as “cherry-picking” a start date to make a trend line say what you want.
You keep making a distinction between finding” and “picking” that I don’t understand. Monckton wants the trend line to say there is no warming so finds the earliest month that give him that, and then picks that month for the current report. Next month he’ll find another month if that gives a longer pause.
Someone else could use the same method to find the longest period over a certain value. For example I find that the trend since January 2011 to present is 0.4°C / decade, a warming rate three times faster than the overall trend. If I say we have had rapid warming for 10 years 8 months, have I cherry-picked the start date, or did I find it by working backwards?
CM doesn’t “pick” that date, the data does it for him, he just finds it. I don’t know how to be any more clear.
Are you complaining that he has found a pause at all?
Of course someone else could look for something else. That’s a red herring argumentative fallacy.
The cherry picking comes in when someone *picks* a start date to make the trend line come out like they want. They don’t “find” that date, they “pick” it. It’s like eliminating the 30’s from all baselines so temps today won’t look cooler than the 30’s.
OK, I think the problem with this discussion may just be that you just don’t understand what cherry-picking means. You seem to think that “pick” in the phrase cherry-pick means something like manipulate or destroy evidence, when what it actually means is to selectively choose the data that suits your argument, and ignore contradictory data.
What you describe as picking a start date to make the trend line come out like you want is, exactly what Monckton is doing. He wants a flat trend line so he picks the date that gives him a flat trend line. He wants the longest possible pause so he chooses the earliest start date that gives him a flat trend.
The point of my looking for something else, was to illustrate how easy it is to cherry pick data to show a contradictory argument. But it also illustrates how meaningless the pause is – the trend of the last 10 years 8 months is almost 3 times faster than the long term UAH trend, despite over 60% of it occuring during this supposed pause.
The “pause” is a matter of observations and not of statistics.
What do you think least-square linear regression means?
Linear regression is used for humans to more easily see what is happening. That does not mean it is the truth in any way, shape, or form. It is not predictive at all. And calling the extension of a trend line a “projection” is hand waving and guessing. If you don’t know all the inputs and how they interact then your “projections” are what you call “random chance”.
So, are you saying Monckton’s pause is “not the truth in any way, shape, or form”?
Trend lines based on GAT are not the truth in any way, shape, or form. The GAT is not a proxy for climate. There is no place you can go to observe it. You can’t even tell what is causing the GAT to go up or down.
All CM has done is used the climate alarmists own data to show the folly of their models and predictions. And that *is* the truth.
Replay all of the explanations given during the previous pause.
You were around then.
It’s not a surprise, unless you expect the same troll tactics to work this time.
The explanations were spurious then, but at least you had 15+ years to work with. Now we have less than half that time and the explanations are twice as bad.
It is clear from the way you calculate your so called pause that there is likely to one every time there is a large el-nino event. Such events cause the temperature to rise by by about half a degrees for about a year. Which combined with a steady rise of 0.14 degrees per decade means that it will be some time before temperatures reach the peak of the el-nino year.
You can do the maths very simply. Take a linear temperature increase of 0.14 degrees per year, add some random noise plus occasional super el-nino events and you find Monckton pauses lasting 10 years or so. But none are statistically significant or physically meaningful being just an artefact of random numbers.
Are you claiming the UAH data are random numbers, Izaak the Idiot?
And yet CO2 continues to rise…
No. There is a linear trend in the UAH data of 0.14 degrees per decade on top of which are random fluctuations (i.e. weather) along with a super el-nino event once every while.
The long term UAH trend continues to rise along with CO2 levels. But it is a noisy signal.
No longer. Reduced to 0.13, last month. Now, Im just a simple fella, but if a 4 decade trend, has reduced – oh, and the previous data is invariant – then it would seem to me that the most recent data must be on a reducing trend, at least in the short term.
David,
short term trends can easily be driven by noise and randomness. And people tend to see patterns in randomness that don’t exist (eg constellations). The real question is whether or not such a trend is physically and statistically significant or if it is just noise on top of a relatively small signal.
“short term trends can easily be driven by noise and randomness”
Yes, like the shortterm trend from 1979 to the present.
If it’s a relatively small signal why do you and your tribe get your knickers in a twist over it?
Not if you subtract out the baseline that goes back to pre-man made CO2 levels, per the scientific null hypothesis. If you do, noise or no noise, there is no signal from CO2 that is distinguishable from zero. Arrhenius (1896) was a conjecture that has failed at levels of CO2 above 280ppm.
“The long term UAH trend continues to rise along with CO2 levels.”
Horsefeathers!
You are leaving out the part about how the UAH data set begins at a point in time which is well known to be very close to exactly the lowest point in a multidecadal downward trend in GAT.
We could also correlate the trend since then with the price of adult diapers.
Which of course come in handy for all the supposedly educated adults who are wetting their pants over a tiny increase in temp on a planet in an ice age!
A planet which is well known to have cyclical variations in temp!
A graph of temp for a single day will look very worrisome if at 4:00 PM one concludes that given the current trend, within a couple of days in will be 180°F.
How many times do we have to have this discussion wherein you pretend that 1979 was the very beginning of time, and/or conveniently forget that alteration of the historical data sets are the only reason anyone believes these lies?
I like that graph. I’m going to put it in my collection.
That’s what tacking the UAH satellite chart onto the end of the Hansen 1999, U.S. surface temperature chart would also look like.
Here’s the Hansen 1999 U.S. surface temperature chart:
So, a combination of the UAH chart and the HadCrut3 chart shows the same thing a combination of the U.S. surface temperature chart and UAH would show, and both combinations show it was just as warm in the Early Twentieth Century as it is today.
This means there is no unprecedented warming today, as the alarmists claim, and no unprecedented warming today means that CO2 is a minor player in the Earth’s atmosphere. So minor that we don’t need to worry about it or regulate it. We can move on.
…
A bogus, bastardized, instrument-era Hockey Stick chart is your reply?
Yes, it is. That would be because this is the only thing you can show as “evidence” that it’s warmer today than in the recent past.
All the actual temperature readings from around the world, show a completely different temperature profile where it is just as warm back in the past as it is now, just like the U.S. regional temperature chart shows, and you ignore all of them in favor of a bastardized record.
Spare me the computer-generated Hockey Stick propaganda. I do not accept that they represent the real temperature profile of the Earth. You shouldn’t either.
Neither graph is bogus. The difference is that the graph you posted does not address known biases whereas the one John posted does.
Additionally it is not the hockey-stick graph or a variation of it. It is a graph of the temperature in the United States from 1880 to 2020. The hockey stick graph (and variants) are in regards to the global temperature over a 1000+ year period.
Tom, remember the discussion we had at least 4x now regarding your U.S. Temperature graph? Don’t you think it would be more ethical if you informed the WUWT audience about the details regarding that graph?
“Tom, remember the discussion we had at least 4x now regarding your U.S. Temperature graph? Don’t you think it would be more ethical if you informed the WUWT audience about the details regarding that graph?”
I don’t recall what you are referring to, and I don’t appreciate being called unethical just because I don’t agree with you version of reality.
Make your argument again.
The graph is contaminated with non-climate biases including but not limited to station moves, instrument changes, time-of-observation changes, etc. The graph John Phillips posted above has those biases addressed.
It even has it’s own entry in GISTEMP FAQ.
Q. Why are the US mean temperatures in the Hansen 1999 paper so different from later figures?
A. In the Hansen et al. (1999) paper the GISS analysis was based on GHCN data alone; in the meantime, the group working at NOAA/NCEI had taken a closer look at the US data, an investigation that resulted in substantial modifications compensating for station moves, procedural changes, etc. These corrected data were made available as “adjusted USHCN” data.
The adjustments and their effects are described here, with a graph showing the effect of each of the five individual adjustments here. These adjustments caused an increase of about 0.5°C in the US mean for the period from 1900 to 1990.
They had no significant impact on the global mean. About half of that increase was due to information obtained about station moves (mostly from cities to airports where conditions were generally cooler), the other half from changes in the time of observation (mostly as a consequence of a concerted effort to transition to a uniform time of observation for a whole network of stations). After 1999, GISS replaced the unadjusted USHCN reports by the adjusted reports, and reported on the differences this made in Hansen et al. (2001).
https://data.giss.nasa.gov/gistemp/faq/#q215
Fun with Graphs! Why have you plotted the (obsolete) NH HADCRUT 3 dataset versus UAH Global?
Why have you not noted that UAH and HADCRUT have different baselines? This accounts for 100% of your supposed uptick. Here’s what happens if you continue the surface dataset to compare with the satellite.
“Fun with Graphs! Why have you plotted the (obsolete) NH HADCRUT 3 dataset versus UAH Global?”
Probably because it is the least bastardized version of the temperature record. That would be my guess.
And if we use the up to date global HADCRUT dataset and align the baselines we get the graph below.
The start of the satellite era was in fact a local maximum, the exact opposite of the claim.
You’re welcome.
“And if we use the up to date global HADCRUT dataset and align the baselines we get the graph below.”
Yeah, that’s the problem. The latest version is the most bastardized version.
It’s all alarmist climate change propaganda in the guise of a global temperature chart. The alarmists made it all up in a computer and expect gullible people to believe it’s real.
Obviously, they have had some success at their deceptions.
The graph John posted here uses HadCRUTv4. HadCRUTv5 is the latest version.
If you plot two anomalies with different baselines, inviting viewers to think one is a continuation of the other you are being deliberately deceptive or you don’t have clue one.
This is like comparing the height of two people while one is standing on a box. It really is that dumb.
/me points at Mickey Mann…
You nailed it!
Ok, so you think you have shown how GAT has increased. Now show us the regional graphs that make up this composite. The sum of the parts must make up the whole. Let’s see how much of the earth has warmed a lot and how much has cooled a lot and how they combine to make up the GAT!
Show the temperature graphs for each continent and then break it down even further. Those of us who have played with this don’t find the sweltering regional temps that offset those with no or little cooling.
Maybe you’ll have better luck.
They aren’t “random numbers”. But that doesn’t mean there is any statistical significance that can be assigned to them.
And 18+ years is truly epic.
I don’t see any claims made as to the significance (if any) of a 6.5 year pause.
The data shows no trend since 2015, end of story.
The data shows a zero trend +- 0.8C / decade since 2015.
Pretty meaningless, really.
Gee, start with a conclusion – warming caused by man, then find the right formula, and the right data set that confirms it. That’s real sciencey too, and that’s the IPCC in a nutshell.
…. and, as I mentioned above, that’s an uncanny definition of Karl et al., (2015).
OK, Tony, if you can’t understand seasonal changes, e.g., spring warms things up, summer increases heat levels, autumn cools things off, winter increases cold/decreases heat, you aren’t living on the same planet I live on. And in the middle section of the planet (the equatorial zone), it is a not-quite steady warm state. I say “not quite”, because they also get cold spells in the tropics, sometimes snow appears on those mountains, too.
It all has to do with where the planet is in its annual orbital run around the Sun, along with the polar wobble and how much daylight each half gets. We’re more likely to have longer winters and heavy snows, as well as floods and major storms, than anything else, but that’s just weather. Try to understand the difference between weather –> short term, and climate –> long term. Early snow in the north (see the Austrian Alps episode) is a shift in the WEATHER.
Would you like fries with your misconception?
Tony, like so many who are handsomely paid to troll these threads, simply cannot come to terms with the straightforward notion that one may calculate a trend over any desired period of interest. The fact that such a trend, now approaching seven years in length, now exists is a matter of straightforward calculation. One understands how little the climate Communists like the fact that for nearly seven years (or more than seven years on the HadCRUT4 dataset) there has been no global warming, but – however much the mere fact disagrees with the Party Line, it is a fact. Get over it. If there is a second small la Nina this winter, the period without any warming at all will lengthen.
Just want to let you know, Lord Monckton, than in my area (NE IL USA), the weather abruptly changed from a pleasant cool summer with very little rain (bad sign) up to August 10th, to a hot, humid, and very obnoxious typical August heat wave (weather, not climate). Then someone, some unseen Weather God (Uranus?) hit a switch and we got the cooler air back on Labor Day (9/1/21) and the humidities also dropped. The switch coincides with Ida making a right=hand turn and going east, and now there is a weather front moving in my general direction from the northwest. Cooler air, rain (needed!), etc., the rain volume this year has been poor to bad.
While I welcome the cooler weather, I would like more rain. But this only applies to my area, not to the entire state, so I don’t know how it is down in the cornfields south of me. Too little rain reduces the sugar content in high fructose corn, which is a high-value commodity with traders. Ditto soybeans and wheat, as well as other grains. This is something that some people simply do not understand.
Who’d be a rancher? One can never depend on the weather. You get sun when you want rain and vice versa. The Western U.S badly needs a whole lot of rain. In general, warmer weather should also mean wetter weather, which is why it is so inconsistent of the climate Communists to say that global warming is increasing both droughts (which are actually declining globally) and floods (which show no particular change).
Yes, the Greenbeaners do not make any sense. I see flooding in China and Europe and they holler “Drought!” and I wonder if they are on the same planet I’m on. (Mentally, definitely not. 😉 )
I still think having to spend some quality time on an island near Antarctica might bring them down to the Real World, but it’s only an idea on my part. They seem to not have any connection to or cognizance of natural forces, over which they have no control.
Anyone paying close attention can see the obvious…they make it up as they go.
Nothing the warmista whine about is even consistent from day to day, week to week, and certainly not year to year, and most of it makes no sense even if it was consistently stated.
Likewise, as noted, very little of anything they say comports even slightly with factual information.
I reckon it takes a good long while to work out the kinks in any new religion.
Yes, liars have to be quick on their feet.
“Gee- start with a conclusion-no warming, the find the right formula, and right data set that confirms it.”
Are you talking about Karl et al (2015)?
Possible artifacts of data biases in the recent global surface warming hiatus
you have to consider AMO cycle (article published 2 days before) , then you could understand why the pause lengthens for 20 years and should end with the cold phase of AMO …next years …before the temperature will drop a little bit …like 1970 years …
It’s already dropped around here, Hubert.
Even now griff won’t pause for thought
If it’s cooler this year – and it definitely is – it’s obvious there is no warming
Yeah, if it isn’t cooler, then why did we get only two weeks of ‘hot summer’ where I am (back to cool now) and why did it snow in the Austrian Alps in August, never mind all those other oddball weather events?
Oooh. Oooh. Choose me. Because warming causes cooling, dry weather, wet weather, more clouds, less clouds, stable weather and unstable weather, and the rise of the Taliban in Afghanistan.
“how can global warming be worse than you thought given that it is a whole lot less than you predicted?”
That’s an excellent and another very intelligent question of Lord Monckton! It puts a smile on my face despite the rather cold and dull whether today here in the Netherlands.
The trend on the entire UAH dataset since December 1978, a period of 42 years 9 months, is equivalent to only 1.35 C°/century, even though the data began shortly after the naturally-occurring Great Pacific Shift of 1976 that is responsible for much of the warming over most of the period.
Still warming though isnt it. If it dropped half a degree for ten years I might be convinced warming had stopped.
The pause deniers are out in force today.
Somebody’s hired a bus for the event!
A nasty, diesel-fumed, CO2-emitting bus. At least it wasn’t a private jet.
There is no pause, it has been cooling for 8000 years!
No, it has been warming for 8000-9000 years since the end of the Little Ice Age.
I think Matthew is referring to the Holocene Climatic optimum at 8,000 years ago:
But cooling since the last anbd much warmer interglacial! 🙂
Here are a few different views over a few timescales, from different proxy measurements:
And you are a couple of thousand years out there Christopher:
 8000 BC was the peak temp
Not one original thought from the lot of them. They’re all rehashing their fears from the previous pause.
Likely they hope RSS will add another false increase of temperature.
Mr Sykes says it is “still warming”. No, it isn’t. For almost seven years (UAH) or more than seven years (HadCRUT4) there has been no warming. So, for the time being, global warming has stopped, and it may be that the pause will continue for some months or even years. Or it may cease. But such Pauses, which tend to follow exceptionally large el Ninos, are an indication that the long-run trend – also shown in the head posting – is about a third to a quarter of the 0.34 K/century equivalent medium-term warming predicted in IPCC (1990), particularly when one allows for the fact that not all warming is necessarily anthropogenic.
Are you ever going to state the uncertainty in the claim that there’s been no warming for almost 7 years? As I hint below, it’s strange that almost 7 years of “no warming” results in an increase in the overall rate of warming.
Bellman should read some of the previous posts in this series, in which I have shown the error-bars in the HadCRUT4 temperature series, with the trends thereupon. Taking proper account of the error-bars actually lengthens the pause, because we cannot say with certainty that there has been any warming in the zone of uncertainty, which is longer than the period shown in the Pause graphs.
And no, it is not strange that while temperatures are above the longer-term trend the longer-term trend will increase a little. Welcome to elementary statistics. The longer-term trend is fully and fairly shown in the head posting, and it is a great deal less than the trend originally predicted by IPCC in 1990.
+100
” The longer-term trend is fully and fairly shown in the head posting, and it is a great deal less than the trend originally predicted by IPCC in 1990.”
Actually no, there were several trends projected in AR1 and His Lordship is almost certainly referring (because he nearly always does) to just one – Scenario A. This had an associated warming trend in early decades of 0.29C/decade. Not really ‘3x observed’.
However IPCC (1990) presented four scenarios (A-D). Scenario A had the most warming. To be sure the IPCC did describe the assumptions about forcings behind Scenario A as ‘Business as Usual’ meaning no emission controls (amongst many other things), but as predicting how forcings will develop is not in their competence, they developed the 4 scenarios in an attempt to bracket possible futures. Scenario A was the most extreme in terms of forcings and and as it turned out it incorrectly predicted a far greater rate of forcing, and hence of temperature change, than actually occurred. In reality greenhouse gas concentrations evolved somewhere between Scenarios B and C. From the report:
“under the other IPCC emission scenarios which assume progressively increasing levels of controls rates of increase in global mean temperature of about 0 2°C per decade (Scenario B), just above 0 1°C per decade (Scenario C) and about 0 1 °C per decade (Scenario D) “.
So the observed UAH warming rate of 0.13C/decade lies between Scenario B and Scenario C. The IPCC may not be prescient in terms of future forcings, but properly assessed, their 1990 temperature projections turn out to be have been pretty skillful.
Based on crude and bogus computer models?
Accidents happen.
And, assumptions that didn’t happen! Hansen assumed major volcanic eruptions for the low-growth scenarios, to make it look like “draconian” reductions in anthropogenic CO2 would have wonderful results, and then didn’t apply the effects of the hypothetical eruptions to the “Business as usual” scenario, to exaggerate the difference between the scenarios.
We are talking about the UAH data, and the uncertainty in the trend, not in the temperature. Depending on how you calculate it, you might say something like the trend since January 2015 is 0 ± 7°C / century, for a 95% confidence interval.
Shhhhhhhh!
Bellman is lecturing on statistics again.
Which means you have absolutely no idea what is going to happen in the future. We’ll just have to wait till the future gets here to see what happens.
Oh the irony.
Oh come on, its been cooling for 8000 years, warming for 150, warming for 50, not warming for 7 and cooling for 2.
We all know how this works Christopher, and saying ‘it is still warming’ is not an alarmist statement, nor a statement about CO2. Its just a statement of fact given a certain time frame.
No, it isn’t still warming. There has been no trend for about seven years. That has the effect of increasing the longer-run warming trend by a very little, but there has still been no warming for almost seven years (or more than seven years, on the HadCRUT4 dataset).
And if you update to July 2021 you get the warming bac:
http://www.drroyspencer.com/2021/08/uah-global-temperature-update-for-july-2021-0-20-deg-c/
Like I said, you can get warming and cooling where ever you want just by picking a start date, so you need a reasonable time frame.
Is 7 years a reasonable time frame, is 8000?
So we need to chose, so how about a generation, 30 years, does that sound reasonable to you?
In that time frame it is still warming.
Matthew, do you know the real difference between WEATHER and CLIMATE?
I doubt that you do, kiddo. There is no such thing as climate or weather stasis on this planet.
“There is no such thing as climate or weather stasis on this planet.”
So you deny there is a pause then? 🙂
Anyway, nice patronism, do you specialise in that just use it on special occasions?
“do you know the real difference between WEATHER and CLIMATE”
Yeah, its called time.
Your answer doesn’t make any sense. A “pause” is not the same as stasis, which is a steady state, stagnation, also a state of equilibrium. And dropping in the word “time” in regard to weather versus climate is just plain lazy on your part.
And no, I have NEVER denied any pause of any kind, other than my cat’s paws getting into things that are MINE!
stasis
/ˈsteɪsɪs,ˈstasɪs/
nounFORMAL•TECHNICAL
Dont be silly, stasis and pause are the same.
“And dropping in the word “time” in regard to weather versus climate is just plain lazy ” Oh come on, if you get rainy weather for long enough you have a rainy climate. Of course time is the difference between weather and climate!
Sara:
You have somehow mixed up what M. Sykes has been posting.
Sykes accurately stated that global temperatures have been declining for 8,000 years.
Here is the last 10,000 years. With the CO₂ levels charted too.
1) Caveat: Most of the resolution size is much larger than modern temperature series.
2) Caveat 2: Even with the spurious temperature datasets tacked on to the end of this graph, temperatures are far below temperatures 8,000 years ago.
Every honest temperature graphic going back to or before the last maximum glaciation shows that Earth is getting cooler. In spite of the super powers alarmist attribute to CO₂ our future looks darn cold.
You are chastising the wrong commenter.
As far as Lord Monckton, I assume he misread Sykes’ comment.
Here is the last 740,000 years:
Well, Matthew, the Pause lasted over 18 years. Cognitive dissonance, much?
“If it dropped half a degree for ten years I might be convinced warming had stopped.”
Wait a second…you seem to be saying that even if you knew that it was not warming for ten solid years in a row, you would only maybe grudgingly acknowledge that reality?
Congrats, you do not have a rational bone in your body or scientific thought in your head.
If warmistas stopped making stuff up, moving the goalposts, and altering historical data sets, I might be convinced they had bought an speck of integrity.
On second thought, no…no…there is zero chance that pack of lying liars could ever convince me of anything.
Lets get this straight, I think CO2 is good for the planet, mild warming and a big increase in plant growth.
OK, got that?
Right, down to the temp trend. To me, I see a steady increasing trend in that graph. For me to see otherwise I would need to see it cool by half a degree for ten years.
DO you understand?
I look at stock charts all day long.
It is amazing how a cyclical pattern can hide and suddenly emerge when even a slightly longer view is taken.
If it cools in the coming years, we could be back at values seen in the 1970s or lower, and the sine pattern can easily become evident before ten years have passed.
Sorry I misunderstood your position.
I can see I spoke rashly and was out of line, and I regret it, and apologize.
In any case, I have a different mindset when it comes to data analysis: I look at it as it happens and see what is in front of me, and do my very best to never decide anything ahead of time…before the evidence is available.
If you were intellectually honest, you would have to admit that it had been cooling for a decade, and based on that interval of time, an extrapolation would suggest that warming had stopped for the near-term. However, there are no long-terms guarantees of the behavior.
From the UAH data above? If you pick exactly 2010 as the start point you can claim it has not warmed for 10 years, but only a fool would do that. The fact is there is an upward trend. I need to see a solid period of temperature fall to be convinced it is over.
“Still warming though isnt it. If it dropped half a degree for ten years I might be convinced warming had stopped.”
Well, according to the UAH satellite chart, the temperatures have dropped by half a degree since the “hottest year evah!” of 2016. We are currently sitting at 0.5C cooler than 2016.
Where’s all this warming the alarmists are always talking about? Aren’t we putting more CO2 in the atmosphere? Yet it is getting cooler. I don’t get it. Maybe that means CO2 doesn’t have much to do with our temperatures.
“since the “hottest year evah!” of 2016″ which isnt ten years.
Good comback.
Give it time.
Yep, time indeed. As I said, we get ten years of solid lower temps I will say the warming has paused.
I’ll look forward to it.
Furthermore, over the 18 years 1984-2001 a naturally-occurring reduction in cloud cover was responsible for most of the period radiative forcing (Pinker et al. 2005) and hence global warming.
In case anyone believes Pinker et al supports Lord Monckton’s claims of global brightening causing global warming, it has been pointed out, not least by Dr Pinker herself, that they do not.
1 Viscount Monckton attempts to directly link the change in surface solar radiation to a change in temperature. He states:
“What, then, caused the third period of warming? Most of that third and most recent period of rapid warming fell within the satellite era, and the satellites confirmed measurements from ground stations showing a considerable, and naturally-occurring, global brightening from 1983-2001 (Pinker et al., 2005).”
This statement in effect equates temperature change with surface solar radiation change which, as noted in points 2 and 3 above, is only one input into a complex climate process. Also, it is not necessarily the case that global brightening is naturally-occurring; it can be caused by anthropogenic aerosols or changes in the atmospheric moisture content as well as clouds, possibly affected by increasing CO2 levels.
2 Viscount Monckton states the following about the data used in our study:
Allowing for the fact that Dr. Pinker’s result depended in part on the datasets of outgoing radiative flux from the ERBE satellite that had not been corrected at that time for orbital decay, it is possible to infer a net increase in surface radiative flux amounting to 0.106 W m-2 year-1 over the period, compared with the 0.16 W
m-2 year-1 found by Dr. Pinker.”
In the Pinker et al. (2005) study, no use is made of outgoing radiative flux from ERBE observations; observations from ERBE are not used at all. The observations used are from the International Satellite Cloud Climatology Project (ISCCP).
https://web.archive.org/web/20130926035034/http://scienceblogs.com/deltoid/2010/09/24/rachel-pinker-on-moncktons-tes/
Mr Phillips does not realize that, since Pinker et al. did not use ERBE, the radiative forcing arising from the global brightening over the 18 years 1994-2001 was 0.16 Watts per square meter per year, compared with only 0.038 Watts per square meter per year from all anthropogenic greenhouse-gas forcings.
Mr Phillips also does not realize (as Dr Pinker did not) that the radiative forcing concept is designed to place the temperature effects of various climatic influences on an approximately equal equal footing. It follows that, since the 0.16 W/m^2/yr from naturally-occurring solar brightening exceeded the 0.038 W/m^2/yr total annual anthropogenic forcing more than fourfold, the solar brightening was the chief cause of the global warming over that 18-year period. Whether or not Ms. Pinker had herself drawn that conclusion from her paper, it was a conclusion legitimately drawn.
Ms Pinker tried to maintain that the solar brightening was anthropogenic. But then it went and reversed itself, as it does quite naturally.
In general, adherents of the Party Line are prone to exaggerate the influence of anthropogenic aerosol forcing in whichever direction is convenient. Ms Pinker chooses to maintain that we were responsible for a decrease in aerosols from 1984-2001, leading to the brightening. IPCC chooses to maintain that there has been an increase in aerosols, leading to a dimming and consequently a negative forcing, for reducing the total observed forcing when compared with the observed temperature change appears – quite falsely – to increase climate sensitivity.
If Mr Phillips were not so lavishly paid to peddle the Party Line, he would me more critical of those who, like Ms Pinker, were not aware of the implications that might legitimately be drawn from their own findings.
Now I am confused. At first His lordship cites Pinker 2005 in support of his global warming from global brightening claim, now he is saying she got it all wrong. Which is it?
Well, you can probably guess. Dr Pinker correctly points out -as she has had to do on several occasions – that His Lordship is guilty of serially misrepresenting her work. Smart people learn from their mistakes. He claims that a change in solar surface irradiance due to cloud cover changes – which he derives from Pinker – is directly comparable to other causes of radiative imbalance. It is not. Dr Pinker could not be clearer:
“The CO2 “radiative forcing” value that Mr. Christopher Monckton is quoting refers to the impact on the Earth’s Radiative balance. The numbers that we quote in our paper represent the change in surface SW due to changes in the atmosphere (clouds, water vapor, aerosols). These two numbers cannot be compared at their face value“
Radiative forcing is a measure of a net global energy imbalance, the surface SW radiation flux will always be a lot higher than the corresponding RF change as the former does not include the full picture of global brightening, including such factors as aerosols and cloud. Oranges will always be oranges and apples will always be apples. Global brightening never did and never could cause much global warming. This has been spelt out by Dr Pinker on at least three occasions and yet His Lordship continues wrongly to cite her work.
With regard to Mr. Monckton’s use of the work of Pinker et al., (2005) he is totally misinterpreting the physics. In addition to ignoring the long-wavelength (infrared; LW) radiation, he also ignores the non-radiative terms involved in the surface energy budget: sensible and latent heat fluxes (SH, LH) and heat storage. While a change in solar insolation at the surface alters how much solar heating of the surface occurs, changes in LW, LH and SH fluxes modify how much surface cooling occurs. There is no observational evidence or plausible physical justification to assume these cooling mechanisms remained constant during the period of apparent “global” brightening (which is questionable in its own right at the global scale). By Monckton’s logic, surface temperature variability is a simple linear function of variability in surface insolation. While this logic would make climate prediction much simpler than it is, life on Earth would be quite miserable. Not a place I’d want to live..
Dr Norman Loeb
Source.
So, increased SW doesn’t provide additional energy to the Earth’s thermodynamic system? Whodda thunk?
Nobody has ever made that claim.
Doesn’t “There is no observational evidence or plausible physical justification to assume these cooling mechanisms remained constant during the period of apparent “global” brightening (which is questionable in its own right at the global scale).” count?
I would suggest a renewal of attention on GHCNM, the source of the vast majority of land surface temperature data for global products. This database is in major decline, it no longer has updates for rainfall, Tmax and Tmin, it is unstable, it has clearly invalid QC adjustments for recent decades, and some of its homogenised versions are clearly wrong, many with excessive cooling of the past. It also has insufficient data for many countries in recent years.
Confirmation bias and fear of contradicting the Party Line both apply, if temperatures fall or pause massive efforts will be expended to “fix” the problem, if they continue to rise then nothing will happen.
Finally 3 scientists have calculated the value of “ECS” to 0,5K including the watervapor forcing. Water vapor accounts for 29.4K, CO2 3.3K and CH4+N2O 0.3K of the total 33K greenhouse gas warming. It means that an increase of CO2 from present 412ppm to 1600ppm will take approximate 800 years. (and this team is not the only – several other papers get the same result ECS is 0.5K)
http://www.sciencepublishinggroup.com/journal/paperinfo?journalid=298&doi=10.11648/j.ijaos.20210502.12
Chris , 2 months every month is far to slow, though better than nothing. It will take 6 years to get to 18 years. Can you not speed it up a little bit?
Please.
If global return to normal [I mean global cooling] is real then Piomas would go ballistic this month. But not a whimper?
As Dr Roy Spencer says, the data are what they are. Unlike the climate fanatics, we don’t bend the data. The fact that ever-increasing anthropogenic forcing is insufficient to prevent successive long periods without any global warming at all should by now have demonstrated to all honest enquirers that the anthropogenic influence on global temperature is not as great as some profiteer by claiming.
Thanks for the courtesy of an acknowledgment , better still in temperate language which is a rare commodity these days.
Thank you also for your updates.
The attention it garnishes is very important.
I hope the Pause can extend to twenty years in closer than 5 years but realise good change, like bad change, can be slow.
No need to reply.
I’ve been enjoying (sometimes not) the discussions and debates on CC for around 20 years now and my scepticism is even greater now than when I started. Sad to say, the UN is on a crusade to get its political will to dominate the world and CC is just one of its tools. The ‘new enlightement’ will come and be awful to experience (many of us won’t): when the new generation, huddling in their cold and under-powered homes, begin to hold the successors of the likes of Mann, Oreskes and many others responsible. It will not be pretty.
it really would be nice if more people would start objecting to the lies and misrepresentations that Mann, Oreskes, Gore, Obama, and the host of other alarmists who are using fear to terrorize the clueless. While it has been a coolish summer in a lot of places, a hottish summer in others, all in all, I see nothing unusual going on, lots of weather, nothing more.
Pamela Matlack-Klein is correct: nothing that has happened since 1750 is definitely beyond natural variability. That is why so very few published papers (0.3%) even go so far as to state that global warming is chiefly anthropogenic, for it may not be.
The childish ascription of every weather-related natural disaster to global warming is as empty-headed as it is baseless.
Chris, the 20+ years of ‘successful’ CC anti-science has merely been underscored by the fact that the great and the good, along with their poodle MSM have managed to deprive the USA of a legitimate President because, again, the great and the good thought he was brash, gauche and popular. That is why I fear for the backlash. The G&tG should understand from history (French, is a good start) that they are very often the first to scaffold. The rest of this century is gong to be very, very interesting. Pity I won’t be around for the denouement.
Thank you for your continued input to the cause: your (very) early videos, along with those of the late Bob Carter were – are – inspirational.
Many thanks to Mr Passfield for his very kind words. It is a great shame that the Republican National Committee did nothing when I went to see it in 2011 to warn it of a massive, organized system of voter fraud organized by the “Democrat” National Committee. The RNC did nothing, and America is now paying the price for its useless inaction.
At least half of them were/are also benefiting from the fraud system.
I’m sure there was yesterday a thread on the UAH satellite temperature anomalies (I even posted a comment) but at the moment it has disappeared (or at least my browser can’t see it); may be I’m going senile prematurely.
Cancelled when they realised they were linking to the wrong month.
It’s now back and corrected
Here it is:
https://wattsupwiththat.com/2021/09/01/uah-global-temperature-update-for-july-2021-0-20-deg-c-2/
Sometimes a comment I make will seem to disappear from a thread here.
Clicking refresh solves it.
Trend up to the start of this pause was 0.110 ± 0.064°C / decade. Trend to current date is 0.135 ± 0.050°C / decade. (Using Skeptical Science Trend Calculator for uncertainty at 2σ)
Could someone point me to the evidence that much of warming was caused by an event in the mid seventies?
Perhaps a review of the newspaper articles in the 70’s would be helpful. You know, the ones where climate scientists were predicting a new ice age because of falling global temperatures. Any trend from a colder period to today would show warming, CO2 increase or not.
It wasn’t just the climate scientists – I was very interested in it at the time; the MSM, leading physicists, mathematicians and statisticians were all convinced that the onset of the new ice age was imminent. It got strong worldwide traction until temperatures starting going up again. We’ll see what happens with this ideaology when temperatures go down (again).
Atmospheric aerosols, when CO2 forcing was a third of what it is now ….

If I’ve understood you correctly, you are ascribing the falling temperatures of the period 1940-80 to the cooling effect of aerosols. In that case, any warming by CO2 must be puny.
In the 70’s it was outweighed by the -ve forcing of atmospheric aerosols (1975 = 330 ppm).
So 5.35 ln(330/280)
=0.88 W/m2
Now 5.35 ln(413/280)
=2.1 W/m2
http://www.climatechange2013.org/images/figures/WGI_AR5_Fig8-18.jpg
Assuming your figures are correct, these are tiny values which are lost in the uncertainties and error bars.
Do any of these articles talk about the Great Pacific Shift of 1976? I’m still trying to figure out how an event in the mid 70s causes ongoing warming from 1979 to 2021.
Bellman should read up on the great Pacific climate shift of 1976, and then simply look at a temperature-trend plot from, say, 1945 to the present. Res ipsa loquitur. Try approaching these questions with an open mind, not a handsomely-paid open mouth.
I am trying to look at it with an open mind, that’s why I asked for the evidence. If you’re saying it speaks for itself do don’t need to provide evidence, then might I suggest your mind isn’t as open as you suggest.
Bellman
Exactly. Over the period of this latest pause there has been an increase in the overall rate of warming in UAH, as calculated by linear regression. This is because temperatures have, for the most part, remained at historically high levels relative to earlier periods in the data.
However, the overall rate of warming is still only a third to a quarter of the rate originally predicted, and is well within the 0.15 K/decade natural variability of global temperatures.
Global temperature averages are NOT climate.
“As always, the Pause is calculated as the longest period ending in the present that shows no warming trend…”
Will any of those who tell me I don’t understand how Monckton determines the pause, also point out that Lord Monckton doesn’t understand how it’s calculated?
But you don’t understand, Bellman, he doesn’t look for the longest pause, he starts the pause today and ends it as soon as he finds an end date that has a positive trend. That’s why it’s not cherry-picking.
You regress the the temperature anomaly versus time for N as N goes up, until the slope coefficient is statistically different from zero.
You really shouldn’t. Looking for a warming trend like that is still cherry-picking. You want to show that the slope us statically different from zero, but if you look month by month to find such a significant trend the significance can be an illusion caused by the selection process.
So you think we shouldn’t read too much into the great +6.8C per century warming trend in UAH that started in January this year?
No, one should not read too much into a trend of a few months’ duration. That is only a little less silly than the climate Communists’ oft-repeated device of taking a single month’s temperature and drawing all manner of lurid conclusions from it.
Anyone but a sullen. paid partisan such as TheFinalNail can at once understand that if there has been no global-warming trend for around seven years the situation is not Worse Than We Thought: it is remarkably stable, particularly given that anthropogenic radiative forcings have continued to increase linearly year by year, in which case a far larger warming than we have seen to date ought to be occurring, and long Pauses ought not to be occurring.
It was meant as a joke, to illustrate how ridiculous it is to read too much into the significance of short periods in a long term data set. Ironic.
Bellman is, as usual, wrong. He had himself previously stated that a pause would have to be at least six years long before it became significant. Well, this one has passed the Bellman test for significance.
And no, it is not cherry-picking to calculate the trend on any sufficiently long given period of a dataset. The trend on the period covering the last 80 months is indeed a zero trend. Get over it.
That’s the third time Lord Monckton has accused me saying that a six year pause would be significant, and I expect it will be the third time he ignores my request for evidence that I ever said such a stupid thing.
So once again, there is no magic number of years that a trendneeds to be in order to be statistically significant. Even if a 6 year period might be statistically significant I wouldn’t use it to make any assertions about what’s happening to the climate. You can find quite a few 6 year periods where there is a rapid cooling or warming trend and none of them so far have any significant effect on the long term warming trend.
And yes, by definition choosing the start date because you know it gives you a specific trend is cherry-picking, or if Monckton prefers, it is the end point fallacy, where by carefully selecting the start point you can get any trend you want.
Bellman
May 10, 2021 9:47 am
My prediction is that next month will see the pause starting in March 2015, for a length of 6 years 3 months, with a 5 month overlap of the two pauses.
This will be the case if May 2021’s anomaly is between -0.19 and 0.00°C.”
All you have to do is add the anomaly for May I’ll be waiting.
Yes, a failed prediction on my part. May 2021 was a little warmer than expected at +0.08°C, and so the new start date for the “pause” for that month was April 2015.
So your in denial you agreed there is a 6 year pause ,I don’t know were you get + 0.08c that’s completely out of context to this debate and the previous thread,last chance to speak the truth bellman.
I got the 0.08 from Dr Roy Spencer’s blog. I’m not sure what point you think you are making, or why you cannot figure out when I use the word “pause” sarcastically.
You really don’t stand up to scrutiny do you bellman there’s not a hint of sarcasm in your post.
“Bellman
May 10, 2021 9:47 am
My prediction is that next month will see the pause starting in March 2015, for a length of 6 years 3 months, with a 5 month overlap of the two pauses.
This will be the case if May 2021’s anomaly is between -0.19 and 0.00°C.,”
What exactly is 0.08 bellman thats meaningless perhaps you could provide a link to the data?
You really should try reading this site more often, they copy the UAH data every month, and that has a handy list of past months’ data. But as you asked so nicely here’s a link
https://www.drroyspencer.com/2021/06/uah-global-temperature-update-for-may-2021-0-08-deg-c/
A 0.03 c difference makes no difference bellman particularly when the next month is a negative anomaly, the pause continues , even a 0.06 rise would still be within error bars, what you relied upon is insignificant to the 6 year trend ,my overall point stands you agreed and wrote so the 6 year pause is real.
Yes it is all insignificant, that’s my point. It matters to Monckton’s argument that he can say exactly what month a pause started, even if it’s a different starting date each time, yet this exact date, and the whole concept that there is a pause rests on variations in month to month anomalies.
I’m still not sure what point you are trying to make. If you think my comment is what Monckton is using for his libel that I said 6 months gives you a statistically significant trend, then read my comment again, no mention of significance at all.
It is significant to mr Moncktons point ,not to your point , a 6 year pause is significant a 80 month zero trend of warming is significant,
I’d like to see your workings on that. Half the time people insist there is no significance to the pause as it is merely a technically correct assertion that the trend over the selected period is not positive, and the other half the time people are claiming this is highly significant and means something, even if nobody is sure what.
What people bellman no one has agreed with anything you have said, its very simple bellman no warming trend for the past 80 months thats significant ,particularly as your denying and belittling the fact, your convincing no one here, your trying to cast doubt to the casual reader,particularly as you have agreed to the pause.
Bellman
May 10, 2021 9:47 am
My prediction is that next month will see the pause starting in March 2015, for a length of 6 years 3 months, with a 5 month overlap of the two pauses.
This will be the case if May 2021’s anomaly is between -0.19 and 0.00°C.”
You come here on the pretence of truth when in fact your sole game is to disrupt and bring into disrepute any evidence of the lie of global warming your particular bent is temperature, you don’t appear on any other topics ,
Its a very rare event any of the scientists on this forum have agreed with you , you never agree with any temperature topics ( as above) even when learned members go into great detail explaining the science to you ,you dismiss out 9f hand,
You have obviously been trained in distraction, probably a member of some agw tribe, its obvious by your obsession with temperature related topics were you arrive almost at once and stay all day .
I do find it flattering that so many think I must have been trained or well paid for my comments here. But if I was taking orders from “my tribe” I wouldn’t engage on sites like this at all.
I do tend to comment on temperature issues, specifically the bad statistics used here, but it’s hardly the only topic I’ve engaged in.
As to spending all day here, that’s mainly because anytime I post, I’m greeted with a wave of responses of various quality, and like the masochist I am I try to respond to as many as possible.
“He didn’t pick the start point. He picked the end point and worked backwards.”
Just for once, I’d like to see someone who describes it like this actually describe the algorithm they think Monckton uses.
Here is how I would describe what I think Monckton does:
Now you are just lying. As you’ve been told many, many times, it is a simple numerical procedure for determining the onset of a period in the UAH data which shows zero warming, despite linear increasing CO2 concentration for many decades.
“He doesn’t select the start date to show the longest possible period of zero warming, because he uses a numerical procedure to determine the start date that will show the longest possible period with zero warming.”
Is that the distinction you are making?
The Bellman lie, repeated over and over and over:
So, you calculate winning streaks your way?
Banned from betting now? Not surprise when you refuse to calculate correctly.
Believing themselves to be agile rikki tikka tavi tag teaming and fending off snakes.
Instead they’re like a pair of fake wrestlers misstating red herring phrases, falsely believing they’re winning some points,
That is, they are really a pair of mental midgets who don’t understand when they are far outclassed; in knowledge, experience, mathematics, statistics, facts and reality.
Trollops from the slime ignoring time, thread bombing commentary not worth a dime.
Their negative red votes prove their lack of scores and innate inability to count higher than fingers and toes.
Science is not a democracy.
If 80 month trends are now considered an interesting length of time, I wonder if much fuss was made in October 2017 when the 80 month trend starting in March 2011 was +0.81°C / decade.
The same old empty whine devoid of any substantive information.
Hey moron, the reason it is not cherry-picking is because no significance is being attached, the way Alarmists do. It was only after the old Pause grew to 18 years that Alarmists became alarmed, as in the fact that they knew that it threatened their ideology. Thus, they switched tactics, from denying that the Pause existed, to a miriad of the-dog-ate-my-homework “explanations” for it. It was actually quite amusing to see.
No significance is attached, apart from Lord Monckton above saying it signifies there has been no warming for almost 7 years.
So you admit that it exists then. Progress.
It is a matter of observable fact that there has been no global-warming trend for almost seven years. Whining about it merely confirms that prejudice against the facts is present.
It is an “observable fact” that for the last 10 years the world has been warming at 0.4°C / decade. What would you say about someone using that fact to suggest warming had accelerated over the last 10 years?
Repeat yourself much, moron? No one has suggested anything other than the fact that there is no warming trend for almost 7 years. It doesn’t mean much now, but as the Pause lengthens, it will.
Harping and nagging show desperation.
Lack of warming shows CO₂ is not the climate control imperative they claim.
Talking to yourself now?
Only way I can be sure of intelligent conversation around here.
Mightily impressed with yourself you are, then.
Then go some were else, no you won’t because your here to discredit real science.
The pause is even more spectacular with data from Swiss météo :
https://twitter.com/meteosuisse/status/1432303148119560193?ref_src=twsrc%5Etfw%7Ctwcamp%5Etweetembed%7Ctwterm%5E1432303148119560193%7Ctwgr%5E%7Ctwcon%5Es1_&ref_url=https%3A%2F%2Fwww.20min.ch%2Ffr%2Fstory%2Fle-tower-bridge-bloque-par-extinction-rebellion-153508118833
It makes you wonder what an outright decline in AMO will do with natural stability elsewhere.
6 years 8 months = 80 months zero trend. A nice round number at least.
There are 513 monthly values in the UAH_TLT data set. This yields a total of 434 rolling 80-month periods. Of these, 127 show a zero or cooling trend. That’s almost 30% of the total 80-month periods in the UAH record with no warming trend. Yet the full trend remains a statistically significant +1.35C per century warming.
Considering the above, it should be clear that, even in UAH, periods as short as 80-months, whether they be warming, cooling or zero, have very little impact on long term climate trends.
Just so, TheFinalNail. When will they see this?
The Final Nail is reliably wrong. It would surprise no one but an ideologue to realize that the longer or more frequent the zero trends comprising a dataset, the less likely it is that the overall trend will be as large as the profiteers of doom had predicted. Elementary!
Lord M is reliably evasive. He skips over the point being made: that periods spanning several years of zero warming, or even cooling, occur frequently in the UAH data set; yet this has not prevented it from exhibiting its long-term, statistically significant warming trend. He offers no evidence that the curent pause will be any different in respect of its effect on the long term trend than any of the many previous ones.
The 42+ year UAH6 trend is 0.13 C/decade. Explain how that is consistent with the UN IPCC CliSciFi GCM’s 3+ C/doubling CO2. The CMIP6 models doubled down on stupidity.
The mean trends posted here and the “consensus” models make the fundamental error of ignoring the long- term decline in solar activity and temperature following the Millennial Solar Activity Turning Point and Activity peak which was reached in 1990/91 as shown in Figure 5. in “Net Zero threatens Sustainable Development Goals”
Climatesense
The correlative UAH 6.0 satellite TLT anomaly at the Millennial Temperature Turning Pont at 2003/12 was + 0.26C. The temperature anomaly at 2021/8 was + 0.18 C. This satellite data set shows that there has been no net global warming for the last 17 years.
(Edited by request) SUNMOD
The trend in the UAH data between 2003/12 and 2021/08 is +2.0C per century warming:
I agree . This shows that as my comment illustrates, the trend shown above is irrelevant in any discussion of global warming.
So the satellite data set that you agree shows +2.0C per century warming over the last 17 years illustrates that it shows there has been no net global warming for the last 17 years??
Yes. check the data in the link Ref(34) in the Net Zero paper
https://climatesense-norpag.blogspot.com
Damn! Those are nice cherries.
Yes-very sweet and ripe. All interpretations are cherry picked as are the basic data. Some people are better than others in figuring which ones fit into a coherent overall picture.
Using a linear regression on a natural varying phenomena is a joke, especially when used to predict the future.
If predicting the future was as easy to do as chunking some data into excel and have it do a linear regression we should all be rich. It is obvious that you have never held a job where your continued employment relief on making forecasts that come true. Otherwise you would be a lot less confident in what you are espousing.
What a prime example of cherry pie making by carefully selecting a specific time period.
Bend over and kiss your AGW warming good bye.
Please Change link to https://climatesense-norpag.blogspot.com
So, where are the acceleration, the code red, and the tipping points you guys get pretzeled about?
A least-squares linear-regression trend fit on UAH’s chaotic data, R^2 <.0.46/decade, is about as meaningful as a Ouija board or Tarot card result.
Who cares if it has paused or not? Even if CO2 triggers 3 C of warming we are just going back to Holocene Climatic Optimum conditions, when the Sahara was green, and forests grew in the far north.
If Climate Change means deserts going green, what’s the problem?
At every point CAGW fails, there is no point for alarm and it is immaterial whether we have RCP 1.5 or 3.5.
You think man cant adapt? That animal that lives in the arctic and the desert? That can live underwater or in space for months? Come on, anyone who believes human civilisation is at risk from Climate Change is an idiot!
OK, a few species might die out, big deal, 95% of all known ones already died out, do we bemoan the loss of them?
And thats the truth of it.
Can you post a comprehensive Holocene global mean temperature reconstruction showing that the HCO was 3C warmer than today?
Evidence that the Arctic at least was much warmer during the Holocene comes from treelines: https://royalsocietypublishing.org/doi/10.1098/rstb.2007.2200
At the height of the HCO the TSI falling in the summer at 65 deg north was a full 50 W/m2 more than now, and it’s fallen steeply since then – so it is no surprise ….
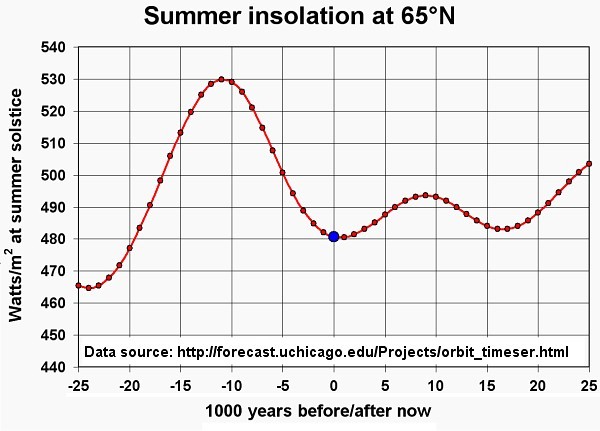
So you accept that this climate excursion was driven by the Sun and not CO2?
The graph is a plot of solar insolation at 65N. It is not changing because of the Sun. It is changing because of Earth’s orbital perturbations.
Notice that we came out of the last glacial maximum while solar insolation at 65N was increasing and beginning to peak. Also notice that it hasn’t changed much over the last couple of thousand years nevermind the last 170 years. And what changes have occurred have been negative.
Seems to me something more must be going on to cause the glacial advances and interglacials.
The orbital parameters change gradually and smoothly, but the transitions to and from glacial and interglacial do not do so.
This is of course separate from the observation that all that is changing is how the energy that impinges on planet is divided up by season, hemisphere, and latitude.
The total amount received at the TOA varies almost not at all over these time scales.
Milankovitch cycles by themselves do not do a good job of explaining what we see in the paleo data sets.
Maybe we would have more information if so many people were not wasting all of their time and all of our money on fantasy, and erasing and/or obfuscating what information had been gathered, prior to the era of climate insanity.
Agreed. Milankovitch cycles provide a general background nudge, but it probably takes the more chaotic and random forcing of volcanoes, biology, etc. to tip the system over the edge.
I also agree that the total energy received by the Sun doesn’t change by any significant amount. It is the timing and distribution of the energy that is changing. But this effects how snow/ice ebbs and flows in the NH and SH and by extension the planetary albedo.
From Earth’s point of view, it IS the Sun which is causing the climate to change, even if the Sun’s power is constant.
I don’t know. We could just be arguing semantics here, but IMHO since the Milankovitch cycles are caused by internal dynamics within the Earth and interactions with the other planets I don’t really consider it the Sun causing these insolation timing and distribution perturbation.
However, the Sun does directly effect insolation via the grand cycles. That is a different topic though.
Is this direct-only?
Direct+diffuse?
Horizontal orientation?
Tilted orientation?
10:00am local time?
6:00pm local time?
Arguing for Edenic stasis of a fictitious past unchanging climate, based on poking holes in the difficult science of reconstructing the deep past, puts you in exactly the same category as 6-day creationists.
Are you saying that asking for a global temperature reconstruction is equivalent to believing the Earth was created in 6 days?
We might have something we can trust if so many people were not spending so much time and effort and money trying to prove something, and convince everyone else, of a conclusion which is not true but which they decided ahead of time was true.
The hypothesis we want to test is “the Holocene Climate Optimum was 3C warmer than today”. I didn’t think it was unreasonable to ask for a global temperature reconstruction so that we could test it. And I definitely don’t think testing this hypothesis means you have to believe the Earth was created in 6 days.
Can you post a comprehensive Holocene global mean temperature reconstruction showing that the HCO was 3C warmer than today?
Iceland 1.5-3 C warmer during Holocene optimim 8-6.7 kya:
Early Holocene climate variability and the timing and extent of the Holocene thermal maximum (HTM) in northern Iceland – ScienceDirect
North Atlantic SSt 4-5 C warmer in the Holocene optimum
Nonuniform response of the major surface currents in the Nordic Seas to insolation forcing: Implications for the Holocene climate variability – Andersen – 2004 – Paleoceanography – Wiley Online Library
Early Holocene Svalbard 7 C warmer than today
Holocene glacial history of Svalbard: Status, perspectives and challenges – ScienceDirect
That’s just a few seconds on Google Scholar. There are hundreds more such published studies.
There’s no doubt that certain regions were warmer back then. The question is…was the entire Earth 3C warmer back then?
What makes you think the whole Earth should warm by the same amount?
I don’t think it does. That is my point.
So then, CO2 is not well distributed in the atmosphere and does not follow the ideal gas law. Because if CO2 is indeed the temperature control knob from radiative back radiation, your point must also say that
CO2 is a well mixed gas in the troposphere.
CO2 follows the ideal gas law.
I have no idea why I need to challenge the above points to accept that the Earth does not warm/cool homogenously.
Hmmm?
CO2 –> 44 g/mol — 0.89 J/gK
O2 –> 32 g/mol — 1.04 J/gK
N2 –> 28 g/mol — 0.918 J/gK
H2O –> 18 g/mol — 4.1 J/gK
Funny how these “mix” well together and don’t stratify. Maybe wind and convection are worthwhile. I wonder if specific heat values have any effect on the energy absorption capability?
CO2, O2, and N2 mix well because they are non-condensing gases. H2O does not mix well because it condenses and evaporates readily.
go here: https://climate.nasa.gov/vital-signs/carbon-dioxide/
play the video on CO2 global concentrations. Then come back and tell us how CO2 is well mixed.
CO2 being well mixed on a global basis is a simplification climate scientists use in their models to make things easier. It isn’t well mixed. Ask anyone that has ever watched the smoke plume from a fire.
It looks like well mixed in the NASA animation.
Are you color blind? Red is not yellow.
The range of ppm horizontally appears to be about 10-20 ppm in any given month in that animation with higher ranges occurring during the NH spring. Checking with other sources this is about right. And the vertical range is about the same throughout the troposphere. If that is not well-mixed then I don’t know what is.
Well mixed implies the *same* everywhere. Vertically mixed is crazy as well as horizontal. CO2 is highest in concentration downwind of producers. You would expect to see different and far higher climate impacts in China than in Central Africa. But you don’t. Even 10ppm means there is a difference. You can’t just blow it away with your magical handwaving.
Well mixed does not mean the *same* everywhere. It just means relatively homogenously mixed. I think you’re argument is that CO2 is not perfectly homogenous. No one is going to challenge that.
More magical hand-waving. Ignoring convection and gravity. “Relatively homogenously mixed” is *NOT* well mixed. That’s a false equivalency. It’s part of the problem with the climate models – too many simplifications, they don’t even purport to accurately describe the physics.
And exactly what is the physics that is behind non-condensing gases mixing well. In a gravity well the heaviest should be at the bottom and lighter ones up higher. What physics causes a stirring?
And yet well mixed gases do not stratify in the troposphere. Why do you think that is?
“The question is…was the entire Earth 3C warmer back then?”
Lemme find a really smart pine tree and I will get back to you on that.
Do you think one pine tree can act as an adequate proxy for the global mean temperature? Can dendrochronology even be used that far back?
Still waiting for an El Nino.
https://rclutz.com/2021/05/08/adios-global-warming/