Reposted from NOT A LOT OF PEOPLE KNOW THAT
AUGUST 15, 2021
By Paul Homewood

You will recall this story from 1st August, regarding the coldest weather in decades which has been affecting Brazil for much of July. Strangely the fraudsters at NOAA have decided that last month was warmer than average!

Despite having no data for much of the country, and most of the data they do have shows it has been a cold month:

And they call it science!
Outrageous! Their noses must be meters long from telling all these porkies!
While the measured data they do have is scant regarding area of coverage, that which they do have is indicating mildly warmer in some areas and mildly cooler in others (+/- 1-2C) the problem is, when they replace the missing data with that from “Near By” grid sources, they always opt to adjust the un-measured grid cell to match the warmer cell, then homogenization forces an artificial warming trend onto the cooler regions
Zachary like the BoM in Australia … real data that does not match the agenda is dumped and replaced with ‘homogenised’ data from the hot red centre of the country.
Oh no, I am sure that John Phillips and bdgwx have a perfectly reasonable explanation for why this is totally, totally not fraud.
With the geriatric now running the nursing home they probably figure they can get away with anything.
So tragic.
Meanwhile Creepy Dementia Joe and Cackling Karmela are hiding, and Circle-Back PSnarki is on vacation.
It might just be me, but I would have evacuated the embassy before evacuating the military.
There you go, trying to make sense again.
It certainly seems the Biden and his advisors gave little thought to the logistics of leaving. And, Vietnam wasn’t all that long ago! Maybe the mental state of Biden should be considered when looking for someone to blame for the atrocities that will almost certainly follow.
Several Democrats are already trying to blame Trump.
They have short memories. Initially Trump proposed withdrawing from Afghanistan in an organised way, but he then took the advice of his generals and halted the withdrawal when advised that the Afghan army could or would not stand alone.
Of course. What else can the Democrats do?
I saw an opinion poll this morning about Biden’s Afghanistan disaster, and he was getting bad ratings even from the Democrats. The Independents and Republicans were giving Biden “F’s”.
Biden is not going to escape blame for this one.
Crash and burn time, even the leftists can see it now.
It’s easy to make those strategic insights after the event.
In the UK you’d be called “Captain Hindsight”.
Yeah, I suppose he makes the same mistake going to the toilet.
You mean he fills his britches before he heads for the john? I can just see the guy shuffling around the halls of the WH …
perhaps the reason for his now famous …
“mybutt’sbeenwiped”
Precisely.
Bwuahahaha, everyone knew this would happen. You grow up in a lead paint house?
Blimey. Didn’t you guys recognise the sarcasm?
My point was that such self-evident cock-up is identical to our UK PM’s performance.
His excuse is to call the person who had warned him, “Captain Hindsight“.
I considered it, but I didn’t appreciate the insult.
My apologies. I did not realise that the”Captain Hindsight” reference was not common knowledge in the USA.
Seriously, I do apologise for the misunderstanding.
It is a common part of the political discussion in the UK.
Here is one of many references I could point to as examples.
https://www.politics.co.uk/cartoon/2021/05/26/and-they-call-me-captain-hindsight/
🙂 Thank you. I should have known better.
BS! The incompetence and lies are obvious. Even Ray Charles could see it.
Closing up the Bagram airbase before they were setup for a proper evacuation is the most obvious idiotic thing they did. Anyone with two working brain cells should be able to see that!
There can be no covering this up. It’s too big! And here are a couple of the idiots below Biden lying their asses off to Congress about how they had a plan and how well it was all going not long ago. It is quite simply criminal.
https://youtu.be/9bpS8Zcic-U
Joe’s social distancing and telecommuting as Commander in Chief at the Camp David Command Center, as seen here:
As others online have pointed out, there are serious problems with this photo: 1) The Moscow time is incorrect – it shows a 3 hour variance with London, yet, currently, there is only a 2 hour variance. And 2) the little black squares (monitors) on each side of the main screen are dark/off. They would have to be lit up, with “Mic On” displayed in bold letters, for Black-Eyed Biden to actually be able to speak to anyone.
But, you know, the adults are back in charge! Or something.
Well, as you can clearly see, ALL of his supporters are present. Meaning that he didn’t NEED to have his mike turned on. It’s reminiscent of his pre-election ‘rally’s’!
“serious problems with this picture” are you serious? The cartoon image stretched bigger than the width of the monitor didn’t catch your eye? It’s just a gag, everybody knows Biden wouldn’t waste time watching cartoons – it would eat up too much of his nap time.
climate refugees no doubt
Sociopolitical climate change is a first-order forcing of catastrophic anthropogenic immigration reform.
Meanwhile Harvard professors proclaims that people who wave the flag are faux patriots and responsible for the fall of Kabul.
https://www.foxnews.com/politics/harvard-professor-says-flag-waving-kristi-noem-unserious-kabul-crisis-is-what-happens-when-us-not-serious
Alternate universe.
https://pbs.twimg.com/media/E820GeqXoAUupq_?format=jpg&name=medium
And it’s academics and democrat apparatchik with no real world experience and a military leadership more worried about being woke than fighting wars or even now protecting American citizens that are the culprits. Biden is no more than a sock puppet.
I mean you appoint a lawyer with zero military or strategic experience as your National Security Advisor, what do you expect?
Video unavailable. Prb’ly censored.
Definitely, as the truth seems to be an ever greater threat.
From the following article: “Normally we would never post videos of what appears to be two people either getting seriously injured or dying. But the situation in Afghanistan is so horrible that the repercussions of the Biden regime’s actions must be documented.”
https://conservativeplaylist.com/2021/08/16/disturbing-video-shows-desperate-afghanis-clinging-to-u-s-c-17-before-plummeting-hundreds-of-feet/
Deplorable & shameful repeat of US evacuation of Saigon in 1975.
Yes and you may recall that it was caused by the same Democrats who REFUSED to let the military handle the battle! Once it was clear that Congresses way wasn’t working, the evacuations began! Hmm. Sounds kind of familiar, doesn’t it?
“Yes and you may recall that it was caused by the same Democrats who REFUSED to let the military handle the battle!”
The loss of South Vietnam was definitely caused by the same Democrats, and Biden was one of them.
Biden has been on the wrong side of three foreign policy debacles: South Vietnam, the Rise of the Islamic Terror Army in the aftermath of the Iraq war, and now Afghanistan.
Like former Defense Secretary Gates said, Joe Biden has been wrong on just about every foreign policy and national security issue for the last 40 years.
Nothing has changed. Biden is still wrong. So how many lives will Biden ruin this time with his delusional thinking?
You actually think that old senile fool that walks off into the bushes and has great difficulty even reading notes and completing a full sentence is making the decisions?
I think he made this one. All indications are that he ignored all the advice he was given, and Joe Biden has a history of having no regard for Afghanistan. He once said “Fxxx That” back in 2010, when asked if the U.S. was obligated to protect the Afghan people.
This Afghanistan debacle is all on Joe.
The head towel-head of the Taliban has an active Twit account, while the account of 45th President of the US has been canceled.
Anything wrong with this picture?
You called him a towel head instead of an austere religious scholar? Just guessin
/me nods
YouTube removed the video for violating community guidelines
Community or communist?
Same thing.
Visit the Whote House Channel on Utube – no comments allowed and it gets thumbsdown 10 to 1.
ytube only to view from aus AND sign in required
no way do I have acct with that mob
Political science?
Nowadays, it is an oxymoron.
It’s the scientific method. Postulate, hypothesis, experiment, oops.
I like your version of the scientific method. When I was young it started with observe before hypothesise. Nowadays when most researchers never leave the computer screen the scientific method is : identify funding opportunities, apply for grant while making sure to include all key trigger words, develop model using other people’s data however unfit for purpose or how unfamiliar you are with the datasets weakness, generate model output misleadingly referred to as data, adjust parameters until model output meets funding agencies mandate, initiate promotional sequence with media alarmist partners, send manuscript to journal with highest media presence that your status allows, participate in sham pal review process, accept awards/accolades from people receiving funding from the same or similar agencies, repeat until early retirement.
True to form, the Caterwaulers will blame this on the Code Red Climate Catastrophe. Because Carbon Magic.
Yesterday in Nature-Climate Change: Increased CO2 increases passivity in common people but enhances aggressivity of terrorists, experts say.
Corruption in high places. They know they can get away with it.
We call it corruption.
They call it doing their jobs.
They are trying to frighten us by threatening the demise of our coffee.
They tried to do that to beer a few years ago. They claimed, using RCP8.5 fantasy of course, that hops and barely production were threatened. The beer crafters association set them straight and publicly called it out as nonsense showing hops and barely production would only increase under CC.
And yet barely production was barley affected.
Thanks zig
It does seem that barely anybody on this blog can spell barley
Quick! The YADAs are needed PDQ!
Nothing new, just more lies from NOAA.
We who are lucky enough to inhabit wealthy western democracies now live in a world where what is said has more value and power than what is true. This is done deliberately so that criminal politicians, fraudsters and undemocratic nations can steal what our parents and grand parents built with their bare hands and heroic effort. All of our rights and freedoms will be the first things we lose unless we fight back.
I live in west-central Argentina and I remember when the cold air went through on its way to SW Brazil, it was unusually cold for weeks. The track of the cold air can be traced by news of crop failures, which would be a Reality Check.
What can you say when supposed “scientific” bodies cannot be trusted? Pathetic.
But what we can expect, I guess, when temperatures are “divined” to be different from what the thermometer said based on what another said kilometers away, because that one gave an answer more suitable for pushing “climate change” propaganda.
Well the thing is, this wasn’t a period of extreme cold weather, but a one off ‘freak frost’
‘freak frosts reported on July 20, when temperatures dropped to freezing levels in minutes…’.
Frosts are not unusual in July in the Bazil coffee region… the sudden onset and drop to minus 1.2 was unusual.
so the average monthly temperatures for Brazil wouldn’t have been severely impacted by this one off event, would they? And what about Argentina: unusually warm in July in the North!
Give up the lies. See Ron Long’s comment above.
Thanks, Scissor. We might hear from John Tillman, who lives in central Chile, about the cold air going through?
Same amount of warmig wouldt be, for you only, a catastrophic climate overheating.
You are soooooo clueless.
Not clueless. Predictable, dishonest, disingenuous, dishonest, monotonous, dishonest, propagandistic, dishonest. Did I mention dishonest?
Amazing how one week of hot weather is proof of global warming, but one week of cold weather is just a freak frost that means nothing.
To Griff!
I laughed out loud when I saw Griff’s reply.
It’s all weather, Griff.
griff,
On another thread you said one-off rain events were an indication of global warming. Rain events are not unusual at any time of year almost all over the globe.
So which is it? Are one-off events climate indicators or are they not climate indicators?
Or does it just depend on whether it fits your agenda at the time?
One off events are truly Climate Indicators whenever Griffie-Poo says they are. The Griff has spoken
Nor is hot weather unusual in Greece and Turkey in July. You dismiss unusually cold weather in southern hemisphere Winter (27 years since last event), but rant about hot weather in northern hemisphere Summer. You lack objectivity. You see what you want to see to confirm your belief system.
The entire “climate change” narrative is founded on confirmation bias … not to mention equivocation, appeal to authority, appeal to credulity, appeal to pity, appeal to population, straw men, red herrings, shifting the goal post and cherry picking … with a shocking amount of hypocrisy.
OH, the hypocrisy of it all!
https://riotimesonline.com/brazil-news/nosubscription/expectation-of-intense-snowfall-and-record-cold-fills-hotels-in-the-mountains-of-brazils-southern-state-of-santa-catarina/
Must publish it, Griff, in a peer-reviewed journal!
You just stated thet there are “one off ‘freak frosts’ “, but you always classify any heat spell as a necessary result from “climate change”.
An asymmetry in nature: hotter, is climate change; colder, is “one off freak frost”.
The sky is the limit: next, you can claim a Nobel prize!
In the real world, Joao; if anything, the exact opposite would be true in a geologically cooling world. The recent warming is an anomaly and it’s cooling we should be preparing for.
Yes, I know. I “grew up” during the “climate cooling” psychosis, I was university student (finished course in 1973). I had very good professors of biology and geology. We often discussed the hype and reduced it to its real size, and understood the more important conclusion: we were in an interglacial and cooling to the next glaciation; but it would not happen tomorrow!
Also, already in high school we got penalties in our marks if we confused weather and climate. Unfortunately, there are nowadays full professors at the university that talk in their lessons and even when arguing PhD theses, of “the climate of the year when you made your observations…”. Sad…
You identified the sarcasm: actually, that asymmetry occurs, but griff is seeing it upside-down: climate change is the cooling tendency, warmer spells or “pauses” are the “one off freaks”…
Their language actually gets it right (talking about anomalies), but for the wrong reason. That’s why I say that “climate change” is equivocation (appeal to ambiguity), a logical fallacy. We’re led to believe that humans are causing this anomaly, whereas the periodic warm periods are the anomalies. This is why their 30 year climate reference is silly, in the face of temperature change in geological time.
I agree with that. Especially with your last statement, where you identify the time frame. The 30 year period is useful in historical time; for old geographers it was a kind of geographic measure: the earth was dividen by a kind of longitude and by “climates”, i.e., belts of latitude with similar conditions, and this “constancy” was ascertainable in the scope of (long) human life or the writen or otherwise transmitted knowledge from previous generations. When our time frame ranges to geological time, the 30 year period is ridiculous.
Climate science: the realm of “pauses” and “one off freaks”!
Griff makes a good point.
Climate change is irrelevant when compared with the weather.
The magnitude and speed of weather changes are far greater and the impact on crops is greater too.
Wise words!
Only one “one off freak day” with hail and a one year crop is lost!
Hail, late frost, heat,… a “one off freak day” is enough to anihilate one year’s work (and in certain cases, of two years).
The griffter gets all depressed this time of year…only weeks before the Arctic begins to start accumulating ice – the Big Freeze returns.
If anything there makes sense at all griff you hid it well.
Never mind! Please tell us, in which time period would you prefer to live your life?
[__] Benign low CO2 1675-1750
[__] “Dangerous” CO2 1950-2025
The first map shows temperature anomalies relative to the 20th Century July average; the second shows them relative to the warmer 1981-2010 July average. That’s why the colours on the maps don’t match up. Why NOAA do this I don’t know.
The author says the second map shows that Brazil had “a cold month” in July. However, you can see that large areas of north and east Brazil were warmer than the 1981-2020 average. Of the 33 or so grid squares I count in or touching on Brazil, 14 show warmer than average temperatures, 12 show cooler than average (including the coffee region mentioned) and 7 have insufficient coverage. Overall it is not surprising that this would make much of Brazil slightly warmer than average in July, based on a 20th century anomaly base.
UAH use a warmer-still 1990-2020 anomaly base and they determined that Brazil (or the lower troposphere above it at any rate) was pretty close to the 1990-2020 July average this year. The only exception is right over the coffee region. Again, that’s pretty consistent with the NOAA data. It’s confusing, but when the different base periods are taken into account the mystery kind of vanishes.
And why they use the outdated base periods ?
Using different measuring sticks is par for the course. If you confuse things enough with inconsistent units, you can say whatever you want and no one can show you are wrong.
I forgot the sarc tag… 😀
I am only arguing that climate science isn’t the only field this happens in. Your “sarc” was understood by me anyway.
The answer is literally always 42 all you have to do is invent new units for every result.
The first map shows land and sea, with no baseline
The second land only
#Obfuscation
Try going to the source ….
From:
https://www.ncdc.noaa.gov/monitoring-references/faq/anomalies.php
How is the average global temperature anomaly time-series calculated?
The global time series is produced from the Smith and Reynolds blended land and ocean data set (Smith et al., 2008). This data set consists of monthly average temperature anomalies on a 5° x 5° grid across land and ocean surfaces. These grid boxes are then averaged to provide an average global temperature anomaly. An area-weighted scheme is used to reflect the reality that the boxes are smaller near the poles and larger near the equator. Global-average anomalies are calculated on a monthly and annual time scale. Average temperature anomalies are also available for land and ocean surfaces separately, and the Northern and Southern Hemispheres separately. The global and hemispheric anomalies are provided with respect to the period 1901-2000, the 20th century average.
Why do some of the products use different reference periods?
The global maps show temperature anomalies relative to the 1981–2010 base period. This period is used in order to comply with a recommended World Meteorological Organization (WMO) Policy, which suggests using the latest decade for the 30-year average. For the global-scale averages (global land and ocean, land-only, ocean-only, and hemispheric time series), the reference period is adjusted to the 20th Century average for conceptual simplicity (the period is more familiar to more people, and establishes a longer-term average). The adjustment does not change the shape of the time series or affect the trends within it.
Justifing adjustments again, if I was a noaa or met office employee I would be doing the same ,considering there on board with the lie of global warming.
I asked you yesterday to prove your statement “I am a retired UKMO meteorologist who knows the science and is not motivated by ideology.”
If you use the above statement to qualify your posts then you need to prove it otherwise your posts are hollow , its also ( as stated yesterday) people like you only post when the manipulation of temperature data is brought to light , the top commandment in the climate church the lie of climate change its deep root
Temperature.
Averaging averages which have first been interpolated from artfully selected, already biased data is utterly meaningless. Averaging discrete information is already a fools game, like averaging phone numbers or street addresses. Then adjusting this concocted pseudo data down, in the past, whenever present temperatures don’t correspond with modeled projections is simply fraud and if not fraud, it’s delusional.
These so called “temperature anomalies are nothing of the sort. They’re 100% fantasy pseudo-data.
“Averaging discrete information is already a fools game, like averaging phone numbers or street addresses”
“We have had this argument before. Uncertainty *GROWS* when you combine unrelated measurements, it doesn’t disappear.”
“The uncertainty *grows* when you add numbers. Dividing by a constant doesn’t affect that uncertainty. ”
Yes we keep having this argument, because you are unable to accept you may be wrong yet are unable or unwilling to provide any type of evidence to show why I’m wrong. I’ve showen the very books you use to argue your point show the opposite, I’ve poited out the absurdities your claim would lead to, and I’ve given empirical evidence that demonstrates you are wrong. Did you see my example of estimating π using just 2 discrete values, and how the estimate becomes more certain as sample size increases?
Let’s try another example using your point about the area under a sine wave. Calculus says that the area under a sine wave between 0 and π is 2, and dividing by π gives us approximately 0.637, which is almost what you claimed. If I’m right it and averages means something then it should be possible to get an estimate for this value by taking random samples. I also claim that as sample size increases the uncertainty of the estimate will decrease. I also claim that adding uncertainty will not have much of an impact on the estimate especially as the sample size increases.
My understanding of your point is that the average will be no different than averaging telephone numbers, that the uncertainty will increase as sample size increases, and that the average will tell you “absolutly nothing”. Is that what you would expect?
Do you want to do the experiment?
I’ve given you the evidence. It’s right there in Taylor’s book. All you have to do is read it. A constant has no uncertainty. It doesn’t matter if it is a multiplier or divisor, it doesn’t contribute anything to uncertainty. It doesn’t increase it or decrease it.
You only have ONE sample – *PERIOD*. What you are doing is trying to say you can sample different things and combine them as if they are samples of the same thing. When you measure a temperature you get one try at it. What you measure then disappears into the past, never to be seen again. You can’t sample it multiple times in order to create a probability distribution.
So you don’t have an increasing sample size. You have a multiplicity of sample sizes of ONE.
It is obvious that you don’t understand integrals. You are measuring the area under the curve. That area is is *NOT* two between 0 and pi. Think about it. How can a sine wave of amplitude 10 have an area of two while a sine wave of amplitude 20 has the same area under the curve? The area under the curve is calculated by multiplying the height of the curve times the width of the curve being measured. With calculus this becomes the integral of Asin(x). You can’t just eliminate the amplitude “A”. The width becomes dx and the height at any point is Asin(x). That is why the area under the curve is .636(A).
“Did you see my example of estimating π using just 2 discrete values, and how the estimate becomes more certain as sample size increases?”
I don’t think that is what you said. You implied you could model a continuous function using just two values. That’s an impossiblity. It’s why you got called out about learning how digital signal processing works.
“My understanding of your point is that the average will be no different than averaging telephone numbers, that the uncertainty will increase”
Telephone numbers are CONSTANTS. They do not represent data points consisting of samples of a continuous or even discrete variable. In other words none of the samples have any uncertainty. They are constants. Averaging them would be like averaging integers over a specified interval on the number line. Those integers are not measurements of anything, they are constants with no uncertainty. Such an average really tells you nothing about the physical world.
Independent, random measurements of different things each time a measurement is made *WILL* see the uncertainty of their sum increase as the number of different things being measured grows. Again, consult Taylor on this.
“I’ve given you the evidence. It’s right there in Taylor’s book. All you have to do is read it.”
No you haven’t. You keep pointing me to Taylor and then ignoring what he says, including the parts where he directly points out why you can divide uncertainty. I want you to point me to where Taylor says – a) uncertainty grows as sample size grows, and b) dividing a measure by a constant does not reduce the uncertainty.
“What you are doing is trying to say you can sample different things and combine them as if they are samples of the same thing.”
Yes I am. That’s because they are samples of the same thing, that same thing being the population mean. You keep failing to undersatnd that when you calulate an average you are not trying to estimate one individual measurement,you are trying to estimate the mean of something. In the case of temperature it might be the mean temperature over an area, or the mean temperature over a period of time, or a combination of both. I don’t care what one specific measurement is, excpet that it is a sample of the mean. That doesn’t mean that if I am interested in a specific value at a specific time I cannot go back to the sampe, but if I want to now what the mean is that is what I am trying to estimate.
This is in principle no different to what Taylor does in the section where he shows how you can take multiple measurements of the length of a piece of metal to get a more accurate measurement. He specifically says to measure it using different instruments and to measure different parts. Why does he say that if you don’t expect different measurements to give different results? What is the final measurement of? It cannot be any one part of the metal because then you would only need to measure at that place. The final average measurement is trying to measure the average length of the sheet.
“It is obvious that you don’t understand integrals.You are measuring the area under the curve. That area is is *NOT* two between 0 and pi.”
Maybe I wasn’t clear, but when I said the area under a sine wave, I was talking about the standard sine wave, not a multiple of phase shifted one. The area under the curve from 0 to pi is 2. It’s a simple application of the definite integral. And of course if you multipley the sine by a constant the area under the curve will also be multipled by the same constant.
I’m ot sure why you are being rude here, when I’m actually agreeing with you. But t does abvoid you answering any of the questions about how you can estimate the average of the sine wave by sampling.
“You implied you could model a continuous function using just two values.”
I don’t think I’ve said that, but you do keep changing the discussison. What I’ve been talking about is the way uncertainty of a mean changes with sample size. You keep changing this to the mean of temperature over a day being aproximated by the mean of the max and min values. I don’t think you can model the daily temperature cycle from just two values, just that it’s the simplest way of estimating the daily mean if you only have those two values. There might be a lot more to be said about how to best estimate the daily mean given two values, but I think it’s a distraction from what we were discussing, how sample size changes the precision of a global or monthly mean.
Here are the results of my experiments to see how well a sampling of random points on the positive part of a sine wave approximate the average of the sine wave.
All I am doing here is generating N random numbers with a uniform probability distribution between 0 and pi, and then averaging the sine of each point. There is little uncertainty in each value. For each sample size I’ll show the first 10 sample means alongside the error compared with the known value of 2 / pi.
First for N = 10
With a small sample size the results are varied. A few are fairly close but others are way out.
Increase to N=100
All are within 0.1 of the expected value.
Let’s really ramp things
N = 10000
All are within 0.01, some ares pot on to three decimal places.
My main takeaways from this part are that averages of “different” things can still give meaningful estimates, and that averages become more precise the larger the sample size.
Part two.
So what if we add some uncertainty to the values, and what if the values are more discrete? Will the uncertainty in the mean increase as sample size increases?
I now repeat the exercise but this time round the samples to 1 dp, so each value is sine(x)±0.05. As the values only go from 0 to 1, that only leaves 11 possible values for each sample, so it is pretty discrete.
N = 10
N=100
N=10000
Even using discrete values, with an uncertainty of 0.05, using a large enough sample size gives results much better than the uncertainty of any individual measurement. And of course what does not happen is the uncertainty increases as sample size increases.
Note:
Although the rounded figures do give values that are close to the expected value, the rounding does introduce a systematic error. The average of all rounded values will give us the average of an approximation of the sine wave, but it happens to be a reasonable approximation. Using a much larger sample size (N=1000000) all the results come back as 0.638 to 3dp, out by 0.001. The mean is precise but not completely true.
Bwaahaaa! You tried to imply you could use two measurements to establish a sine wave, not multiple sampled points, a minimum and maximum temp – i.e. a mid-range value would emulate a sine wave!
The base uncertainty of almost every surface temperature measurement device in use today has an uncertainty of +/- 0.5C if not higher! That is *far* greater than the uncertainty you are attributing to your sample data!
Averages of different things can *NOT* tell you anything. It hides at least the maximums and minimums which are ABSOLUTELY NECESSARY to understand the climate at even one location let alone globally!
The *mean* of the data set can be calculated more and more accurately with more samples IF YOU ARE MEASURING THE SAME THING! Why is this so hard to understand? If you calculate the average of two boards found in a ditch on two different highways, i.e. totally different things, what does the average tell you? You still won’t know what length each board is by looking at the average!
“You tried to imply you could use two measurements to establish a sine wave”
No I haven’t. You’re the one who keeps wanting to talk about the daily mean values. All I’ve been trying to do is establish that the uncertainty in a mean decreases as sample size increases. Daily mean temperatures are a distraction from that you keep bringing up. You were the one who wants to treat the daily temperature cycle as a sign wave and derive the mean daytime average by multiplying the max by 0.63.
“…an uncertainty of +/- 0.5C if not higher! That is *far* greater than the uncertainty you are attributing to your sample data!”
The exact value doesn’t matter, the 1dp is with regard to a value that moves between 0 and 1.
“Averages of different things can *NOT* tell you anything.”
“The *mean* of the data set can be calculated more and more accurately with more samples IF YOU ARE MEASURING THE SAME THING!”
You really need to explain what you mean by “different things” verses the “same thing”. If the sine wave moves from 0 to 1 and back is it the same thing or different things? If the temperature changes from day to day or across the globe is it the same or different things? If I measure a sheet of metal at different points with different instruments am I measuring the same thing or different things? If I measure a stack of paper and use that to calculate the thickness of a single sheet of paper, am I measuring the same or different things? If I measure the number of days between babies being born in a hospital am I measuring the same or different things?
“You still won’t know what length each board is by looking at the average!”
No, of course you don’t. That is why an average is not a list of thousands of different values, it’s a summary of them. Not knowing what every value that makes up an average is, does not mean the average tells you nothing. Pointing to examples of averages that are not very useful does not mean that all averages are useless.
“If you want the “average* of the daytime temps then you integrate the temperature curve from 0 to 180deg. That average *is* 0.63 x Tmax. You do the same for nighttime, integrate nighttime temps from 180deg to 360deg. That average is 0.63 times the Tmin.”
And I’ll try to explain again why this is wrong, even assuming the daily temperature profile is a sine wave.
First your argumet about distinguishing day and night temperatures doesn’t make sense unless you think the mid points of the daily temperature cycle are at dawn and dusk. This would also mean the minimum is at midnight and the maximum at noon. This seems unlikely to me.
Secondly, your argument that you can derive the average of day and night time temps by multiplying the max and min by 0.64 is correct if, and only if, the mid point is zero. e.g. if the max is +5℃ and the minimum is -5℃. Obviously whether any particular day meets this requirement will depend on what temperature scale you are using, In the very likely event that the mid point is not zero, e.g. temperatures go from 5℃ to 15℃, multiplying ax and min by 0.64 will not give you any sort of average.
The correct formula for “daytime” average would be (max – mean) * 0.64 + mean. Where mean is (max + min) / 2 i.e the mid point.
But even if you correct the maths, I’ve still no idea what you are trying to achieve here. The mean for the whole day will still be the average of daytime temperatures plus the average of nighttime temperatures divided by 2, which will be equal to the mean obtained by (max + min) / 2.
I told you several times before about cooling degree-days and heating degree days. These are integrals of the temperature curve above and below specific set points (e.g. 65F). These values give a *much* better picture of the climate at a specific location than a mid-range value.
Dawn and dusk are arbitrary points on the daily time line. Adjust them as you want. It is still the integral of the temperature curve that defines climate, not the mid-range value.
The point is (that you seem to be actively trying to convince yourself that somehow, some way the uncertainty of measuring two different things can have the uncertainty of their additive/subtractive sum somehow divided by two so the uncertainty can be lessened instead of growing. Thus leading to the conclusion that if you just have enough samples from different things you can eliminate the uncertainty associated with adding/subtracting them by dividing by the number of samples. The law of large numbers *only* work to lessen uncertainty when you are measuring the same thing, not different things. Maximum temp and minimum temp are TWO DIFFERENT THINGS. Each has an uncertainty and when you add the two together the uncertainty grows by at least sqrt(2) if not a direct addition. You don’t divide that uncertainty by 2 because you have two samples!
Stop trying to convince yourself that mid-range values hold some magic meaning. They don’t. They aren’t even a good representation of the climate at even one location because you lose the data telling you the min and max temps which is a much better representation of the climate at a location.
*IF* day and night are equal in length then .63 * Tmax gives a much better representation of the daytime climate than a mid-range value. Same for night – .63 * Tmin gives you a much better representation of the nighttime climate. If day/night intervals are not the same then it just complicates the calculation but it doesn’t invalidate it. It remains a much better representation of climate at a location than a mid-range value. And it doesn’t lose data, you can still find Tmax and Tmin which you can *not* do with a mid-range value.
We have had the ability to collect 1-minute temperature data for at least two decades, if not longer. That would allow a much better representation of the actual temperature curve and would allow a numerical integration of the curve at least. There is no doubt that it would complicate the models and the modelers tasks but that should not be used as an excuse for not moving to a better representation of climate from the models. My guess is that the reason this isn’t being done is because it would also show just how badly the models are at actually predicting future temps and climate!
“I told you several times before about cooling degree-days and heating degree days.”
Yes, and this has nothing to do with multiply the max temperature by 0.637. In the case of a CDD the magic line isn’t the mid point of the sine wave. Consider what happens if the temperature never goes above the magic number, or stays above it all night. If you assume the day follows a sine wave you still need to know both the max and min to estimate the CDD.
But if you can assume the day follows the sine wave, then the mean derived by finding the mid-point between max and min will also be just as good an estimate of the true mean.
“The point is (that you seem to be actively trying to convince yourself that somehow, some way the uncertainty of measuring two different things can have the uncertainty of their additive/subtractive sum somehow divided by two so the uncertainty can be lessened instead of growing.”
You keep confusing these different means. I’m talking about the mean of global anomalies or the means of monthly or annual anomalies, not using two samples, but thousands. This has nothing to do with how accurate dividing max + min by 2 is to a true daily mean. A sample size of 2 is not much better than of 1, and these aren’t random samples, they are specifically the 2 extremes. Taking the mean of the two is not about reducing uncertainty, it’s about having a value that represents both of the extremes.
“The law of large numbers *only* work to lessen uncertainty when you are measuring the same thing, not different things.”
Rather than trying to convince me, you should try to convince the authors of every text book on statistics, who all say it does.
“*IF* day and night are equal in length then .63 * Tmax gives a much better representation of the daytime climate than a mid-range value.”
A mid-range daily mean is not meant to be representing the daytime temperatures, it’s representing the entire 24 hour period – day and night. If you only want a representation of the daytime, why not just use the max value, without this meaningless scaling?
.
“We have had the ability to collect 1-minute temperature data for at least two decades, if not longer.”
Which is great as long as you don’t want to compare them with temperatures from the last century. But I’m still not sure what you want done with these minute samples. You keep insisting that any sample is just a sample of one, that if you take an average of different things you increase the uncertainty. Each minute sample is measuring a different thing, and averages tell you absolutely nothing. So if you do average the 1440 samples, what does it give you except the daily mean temperature, which you insist is meaningless.
“Yes, and this has nothing to do with multiply the max temperature by 0.637.”
Do you understand what you are saying? The average of a sine wave *is* .637 * Amplitude. It is the area under the sine wave from 0deg-180deg. What do you think cooling degree-days and heating degree-days *are*?
Cooling and heating degree-days were developed for use by engineers trying to size HVAC systems. If the temperature never goes above the set point then that tells the engineer that air conditioning isn’t a real need at that location. I.e. the cooling degree-day value is ZERO. Same for heating degree-day values.
“But if you can assume the day follows the sine wave, then the mean derived by finding the mid-point between max and min will also be just as good an estimate of the true mean”
Not for evaluating climate! Two different locations can have the same mid-range value while having vastly different climates! It is the average, i.e. the cooling degree-day value, that tells you what the daytime climate is. Same for nighttime. The mid-range value is useless – as is the GAT!
“I’m talking about the mean of global anomalies or the means of monthly or annual anomalies, not using two samples, but thousands.”
Anomalies derived from mid-range values are just as useless as the mid-range values the anomalies are calculated from. And, once again, you have thousands of samples THAT AREN’T MEASURING THE SAME THING! The uncertainty grows with root-mean-square and is *NOT* divided by the number of samples! Why is that so hard to understand? Taylor explains it magnificiently!
“Rather than trying to convince me, you should try to convince the authors of every text book on statistics, who all say it does.”
Uncertainty is *NOT* a probability distribution and is, therefore, not subject to statistical analysis. If you read the statistics books they speak to a data set that is a random, *dependent” data set – i.e. measurements of the same thing. This is subject to statistical analysis. The uncertainty of random, independent measurements is simply not the same thing.
“A mid-range daily mean is not meant to be representing the daytime temperatures, it’s representing the entire 24 hour period – day and night.”
Then how does it tell you anything about climate? Two vastly different locations can have the same mid-range value. How do you differentiate the difference in the climate at each location? The mid-range value certainly won’t tell you!
“Which is great as long as you don’t want to compare them with temperatures from the last century.”
Why is that necessary? Why not just track the values over the past twenty years? The past is the past. You can’t change it. Knowing it won’t actually tell you what is happening *now*. I would much rather have a more accurate picture of what has happened over the past twenty years than an inaccurate picture of how the past compares to today!
“Do you understand what you are saying?”
I think so, I finding it increasingly difficult to understand what you are saying. There a multiple concepts here, and you seem to be obsessed by solving them all with this 0.637 multiplication.
Let’s start with concept 2. If you know the minimum temperature of the day was 5°C and the maximum was 15°C, what do you think it would mean to say that the average day time temperature was around 9.6°C and the average nighttime temperature was 3.2°C? What would be the difference if you measured the max and min in Fahrenheit or Kelvin?
“Two different locations can have the same mid-range value while having vastly different climates!”
Yes, as can two locations having the same CDD. But if I’m not interested in specific climates but just in the question is the world getting warmer then can be quite useful. And you know what’s especially useful? Just because you have a global average mean temperature, doesn’t mean you have to ignore all other data. You can still look at the data for specific areas, you can still look at changes to min and max temperatures, you can still look at rainfall and sunshine.
“And, once again, you have thousands of samples THAT AREN’T MEASURING THE SAME THING!”
Still waiting for a definition of “the same thing” verses “different things”. And still waiting for any evidence that the mathematics of averaging changes between the two.
“The uncertainty grows with root-mean-square and is *NOT* divided by the number of samples!”
I’ve shown empirical evidence that this is not true. I’m still waiting for your evidence that it is true.
“If you read the statistics books they speak to a data set that is a random, *dependent” data set – i.e. measurements of the same thing.”
Point me to one of these statistics books that says you can only average “the same thing”.
“The uncertainty of random, independent measurements is simply not the same thing.”
As I keep trying to tell you, the uncertainty in the mean of different things is mostly due to the sampling. The uncertainty in the measurements is usually of little importance, but the formula is the same, divide the standard deviation by the square root of the sample size.
“Then how does it tell you anything about climate?”
And you still don’t seem to grasp that just because something doesn’t tell you everything, it does not mean it tells you nothing. I still find it incredible that you cannot fathom how the mean temperature might tell you something about the climate, whether we are talking about the climate in a specific place or specific time or globally.
If I know the mean temperature of a place in December is -5°C, and the mean temperature in July is 20°C, can you not deduce something about the climate of the place during those two months?
Climate is determined by the daytime heating and the nighttime cooling. It is *NOT* determined by the mid-range temperature. It truly is that simple. Two different locations with vastly different climates can have the same mid-range value, the mid-range value tells you nothing about the climate at each location.
The daytime temp is pretty much a sine wave. So is the nighttime temp. Depending on things like wind, humidity, and clouds each may not be a *perfect* sine wave but they are pretty close. They are certainly not triangle waves or square waves or any other commonly understood types of waves. The daytime temps and nighttime temps are close enough to sine waves that .63 * Tmax or .63 * Tmin will get you pretty close to the *average* daytime or nighttime heating/cooling as measured using temperature as a proxy.
“ what do you think it would mean to say that the average day time temperature was around 9.6°C and the average nighttime temperature was 3.2°C? What would be the difference if you measured the max and min in Fahrenheit or Kelvin?”
What do you think the mid-range value would tell you? If the daytime/nighttime temps are close to a sine wave then I can tell you the Tmax and Tmin values. You can’t do that with a mid-range value or at least I know of no way to do so.
9.6C is about 50F. Divide by .63 and you get a Tmax value of about 79F. A nice daytime temp. 3.2C is about 40F, or a Tmin of about 65F. A nice nighttime min temp. About what we are seeing here in Kansas right now. It’s a nice climate to be in (except for the humidity).
Do that from a mid-range value.
“Yes, as can two locations having the same CDD”
You continue to demonstrate that you don’t understand what an integral is. How can two sine waves of different amplitudes have the same area under the curve? As you pointed out earlier the integral of sin(x) evaluated from 0 to pi equals 2. But the function we need to evaluate is Asin(x), not just sin(x). So the integral becomes 2A. So how can two locations have the same area under the curve unless A_1 and A_2 are the same? Since the average value is .63 * A how can the average value of two locations be the same unless they have the same value for A?
” But if I’m not interested in specific climates but just in the question is the world getting warmer then can be quite useful.”
What do you mean by “is the world getting warmer”? Every alarmist says it means that maximum temps are going up which is what causes the mid-range value to go up. But it can just as easily mean that the minimum temps are going up. Do you *really* care if minimum temps are going up? How many alarmists are going to say that droughts are increasing because minimum temps are going up? Who would listen to them? Higher minimum temps have all kinds of benefits such as longer growing seasons, higher plant growth at night, more food for humans and livestock, fewer homeless people in San Francisco and Seattle expiring on the street from hypothermia, etc. What *bad* impacts do *you* see from higher minimum temps?
How do you distinguish what is actually happening from the use of mid-range values? How do you tell exactly what is warming? Cooling/heating degree-days *will* tell you, mid-range values will not.
“I’ve shown empirical evidence that this is not true. I’m still waiting for your evidence that it is true.”
No, you haven’t given us any evidence. You would have us believe that you can take two independent, random boards whose length has been measured by two different device with possibly different uncertainties, lay them end to end and have the uncertainty of overall length go DOWN by a factor of two!
Such a belief flies in the face of rational thinking. Look at Taylor on page 57: “When measured quantities ae added or subtracted, the uncertainties add; when measured quantities are multiplied or divided, the frational uncertaies add. In this and the next section, I discuss how, uncer certain conditions, the uncertainties calculated by useing these rules may be unessarily large. Specifically, you will see that if the original uncertainties ae INDEPENDENT and RANDOM (caps are mine, tpg), a more realistic(and smaller) esitimate of the final uncertainty is given by similar rules i which the uncertainties (or fractional uncertainties) are DDED IN QUADRATURE (caps are mine, tpg) (a procedure defined shortly).
You want us to believe that you can take 1000 measurements of 1000 independent, random boards, each measurement with its own uncertainty (e.g. +/- 1″), lay them end to end and that the final length will have an uncertainty of 1/1000″. Simply unfreaking believable.
Remember., this is what you are doing when you calculate an average, you are laying boards end-to-end to get a final result and then dividing by the number of boards. That is no different than laying temperatures end-to-end to get a final result that is then divided by the number of temperatures you use. In both cases that average tells you nothing about the boards, you may have a bunch of short ones (e.g. nighttime minimum temps) and a bunch of long ones (e.g. daytime maximum temps). The average is meaningless and useless for trying to describe anything about the boards! Just as it is for trying to describe something like a “global average temperature).
“As I keep trying to tell you, the uncertainty in the mean of different things is mostly due to the sampling.”
Uncertainty of the calculation of the means is *NOT* the same thing as the uncertainty associated with the combination of the data. You *can* calculate the mean ever more accurately but it is only meaningful if you that data is associated with the SAME THING. Those measurements are then many times considered to be a probability distribution associated with the same thing. When you have DIFFERENT THINGS, no probability distribution is associated with the data, therefore calculating the mean more and more accurately is meaningless once you go past the uncertainty interval which is the root-sum-square of the uncertainties of the independent, random multiplicity of the things you have stuck into the data set. You can *NOT* decrease that uncertainty by adding more data, that just increases the uncertainty of the final result! Just like laying random, independent boards end-to-end. The more boards you add the more uncertain the final length becomes!
“And you still don’t seem to grasp that just because something doesn’t tell you everything, it does not mean it tells you nothing”
Mid-range temperatures tell you nothing about the climate. You *still* haven’t show how you can determine minimum and maximum temps from a mid-range value. If you can’t do that then you know nothing of the climate associated with that mid-range value! In other words, it means nothing. And if the data set you are using is composed of values that mean nothing then the end result means nothing either!
“The uncertainty in the measurements is usually of little importance”
Have you *ever* framed a house? Have you *ever* had to order I-beams for a bridge construction? Have you *ever* designed an audio amplifier for commercial use using passive parts? Have you *ever* turned the crankshaft journals in a racing engine on a lathe? I have.
The uncertainties in the measurements of all of these is of HIGH IMPORTANCE if you are going to do a professional job. These are just a sample, the number of situations in the real world where the uncertainty of measurements is of high importance is legion!
You are the typical mathematician or statistician who’s work product has never actually carried some real world liability for you if it isn’t done properly. You would *never* make it as a professional engineer!
“If I know the mean temperature of a place in December is -5°C, and the mean temperature in July is 20°C, can you not deduce something about the climate of the place during those two months?”
You can deduce a seasonal influence, that’s about all. If the mean temperature in July is 20C what is the maximum temp associated with that? What is the *mean* maximum temperature? If you don’t know those then how do you judge what is happening to the July climate? If next year the mean temperature in July is 21C how do you know what caused the increase? Did max temps go up? Did min temps go up? Was it a combination of both? If you can’t answer these then how do you judge anything about the local climate?
“The daytime temps and nighttime temps are close enough to sine waves that .63 * Tmax or .63 * Tmin will get you pretty close to the *average* daytime or nighttime heating/cooling as measured using temperature as a proxy.”
You keep saying I don’t understand calculus, but when you first made this claim, I showed you the integral, explained why you were wrong, and suggested what you might be grasping at. Yet you still keep repeating this meaningless claim that 0.63*TMax is close to the daytime average, etc. Explain why I’m wrong, or show your workings.
For a start consider a day that has minimum of 10°C and maximum 30°C. You say that the average daytime temperature is 0.637 * 30 ≈ 19.1°C, and the average nighttime temperature is 0.637 * 10 ≈ 6.4°C.
So how do you define “average” so that the average daytime temperature is less than the coolest part of the daytime (assuming daytime starts and ends at 20°C) and even more impressively how the average nighttime temperature is less than the minimum temperature for the whole day.
And if you don’t mean average day or night time temperatures but CDD and HDD then explain how the colder the minimum temperature gets the lower the HDD, or how you can have a negative CDD or HDD.
“9.6C is about 50F. Divide by .63 and you get a Tmax value of about 79F. A nice daytime temp. 3.2C is about 40F, or a Tmin of about 65F. A nice nighttime min temp.”
Now go and have a good think about what you’ve just said. In my example max was 15°C, which according to you meant average daytime was 9.6°C. You then convert that to 50°F and reverse engineer the daytime average of 50°F to get a maximum temperature of 79°F. But 79°F ≈ 26°C, quite different to the actual maximum of 15°C ≈ 59°F.
Similarly switching the scale has managed to change a minimum of 5°C, in to a minimum of 65°F ≈ 18°C, warmer than the original maximum.
Does nay of this make you consider that there might just possibly be a flaw in your multiply max and min values by 0.637 to get the average?
“You keep saying I don’t understand calculus, but when you first made this claim, I showed you the integral, explained why you were wrong, and suggested what you might be grasping at. Yet you still keep repeating this meaningless claim that 0.63*TMax is close to the daytime average, etc. Explain why I’m wrong, or show your workings.”
You didn’t do *any* of that. You just showed that you don’t know what an integral actually is. You can’t come up with the same area under two sine curve unless the amplitude of each curve is the same!
“Explain why I’m wrong, or show your workings.”
I’ve explained it over and over and over and over and over till I’m blue in the face. CLIMATE IS THE ENTIREITY OF THE TEMPERATURE CURVE. Climate is not defined by a mid-range value. Two different locations can have the same mid-range value while having different temperature curves and different climates. Trying to define climate using mid-range values is just a joke on the uninformed.
The average value of the daytime sine wave defines the entire daytime sine wave. From it I can calculate the maximum temp. Same for the nighttime sine wave. I can tell you if maximum temps are going up/down, I can tell you if nighttime temps are going up/down, or if it is a combination. I can tell you immediately what is happening to the climate at a location. *YOU* can’t do that with your mid-range values therefore you can’t tell what is happening to the climate. Since mid-range values contain no information on the climate then combining a bunch of mid-range values to form another average won’t tell you anything about the climate either!
“So how do you define “average” so that the average daytime temperature is less than the coolest part of the daytime (assuming daytime starts and ends at 20°C) and even more impressively how the average nighttime temperature is less than the minimum temperature for the whole day.”
You *really* don’t understand integrals at all, do you? The integral of sin(x) from pi to 0 is a -2. Divide by pi to get the average value and you get a -.63. So the average nighttime value is (-.63) * Nmax. Since you are multiplying by a decimal then how does the average nighttime temp wind up being lower than Nmax?
And how did you come up with the daytime start and end points are 20C when you said that the minimum daytime temp was 10C? An average of 19C is certainly between 10C and 30C! Slow down and check your work!
“And if you don’t mean average day or night time temperatures but CDD and HDD then explain how the colder the minimum temperature gets the lower the HDD, or how you can have a negative CDD or HDD.”
Wow! You haven’t studied up on anything I’ve given you, have you? CDD and HDD ARE NOT AVERAGE VALUES. They are the area under the curve defined by the set points you pick! You don’t divide by anything to get an average. You just get the integral value – the area under the curve.
A sine wave with an average of 9.6 will have a maximum of 15C. That’s about 60F. You are right. I shouldn’t have changed scales. But it doesn’t alter my point at all! I can calculate the max temp from the average value. *YOU* can’t do that with a mid-range value. Same for the nighttime temps.
And that is *still* the whole point. Mid-range values are useless for describing climate. They contain no information about climate.
“You *really* don’t understand integrals at all, do you? The integral of sin(x) from pi to 0 is a -2.”
You still don’t get that you are integrating a sine centered on zero and that therefore results will be different for a temperature profile that is not centered on zero, that is nearly all of them.
“So the average nighttime value is (-.63) * Nmax.”
What, now you want to multiply by a negative number? What is Nmax?
“And how did you come up with the daytime start and end points are 20C when you said that the minimum daytime temp was 10C? ”
10°C is the minimum for the day, not for daytime. You know, like the TMin.
“But it doesn’t alter my point at all! I can calculate the max temp from the average value.”
But you get completely different values if you do this with Fahrenheit, Celsius or Kelvin.
“And that is *still* the whole point. Mid-range values are useless for describing climate.”
You keep doing this, changing the subject. In this comment I’m not interested in whether an average daytime value would be better than a mean. I’m simply trying to help you understand why you cannot multiply Tmax by 0.637 to get a daytime average.
“You still don’t get that you are integrating a sine centered on zero and that therefore results will be different for a temperature profile that is not centered on zero, that is nearly all of them.”
You’ve just hit on one of the major problems with climate models today even though you probably don’t understand it.
What does (Tmax-Tmin)/2 trend toward in the limit? It tends toward ZERO. As the daytime and nighttime temperature excursions get closer together the mid-range tends toward zero instead of the absolute temperature. And that is true no matter what scale you use, celsius, fahrenheit, or kelvin. The mid-range temperature value has an in-built bias that can’t be eliminated.
So why do so many climate scientists, mathematicians, and statisticians remain so adamant that it properly represents the climate anywhere, let alone the global climate?
“What, now you want to multiply by a negative number? What is Nmax?”
What is the integral of sin(x) from pi to zero? Do I need to work it out for you? Nmax is my shorthand for the maximum nighttime temperature excursion. Same as Tmin.
The integral of sin(x) = -cos(x). Evaluated from pi to 0 you get -cos(0) – (-cos(pi)). -cos(0) = -1. Cos(pi) = -1. So you get -(-(-1)) for the second term or -1. -1-1 = -2.
Did you *really* take calculus in school?
“But you get completely different values if you do this with Fahrenheit, Celsius or Kelvin.”
I also get different measurements when I use the different scales. You won’t get the same error that you see when converting between scales. And nothing will change the fact that mid-range values trend toward zero as temperature excursions trend toward zero – an in-built bias from using mid-range values. Think a 24 hour blizzard in Siberia where the temperature might only change 1C from daytime to nighttime. The absolute temp might be -20C to -21C. You wind up with about a 20C bias in the mid-range value. How do you overcome that?
“You keep doing this, changing the subject. In this comment I’m not interested in whether an average daytime value would be better than a mean. I’m simply trying to help you understand why you cannot multiply Tmax by 0.637 to get a daytime average.”
Of course you can! The only reason you can’t would be if the temperature curve does not approach a sine wave. Daytime temps are mostly controlled by the sun. The angle of incidence from the sun to the earth is a sine wave so the temperature naturally tends to follow that same sine wave. You get the largest contribution to temperature when the sun is overhead and the sin(90) = 1. At sunrise and sunset the angle of incidence approaches 0 and the contribution of the sun to surface heat is sin(0) = 0. Of course the surface temp lags the actual sun position because it takes time for the heat input to actually result in a temperature rise.
I’ve attached a graph of our past weeks temperatures (or at least I’ve tried. I don’t know why it isn’t showing up. I’ll do it again in a separate message) If that temperature envelope doesn’t look like a sine wave (distorted perhaps but still some kind of a sine wave) then I don’t know what it looks like. If you want to quibble about the actual value of the integral then have at it. It might be 0.5 or 0.7 or something else. But it is *still* better than the mid-range value for representing the actual climate!
“What does (Tmax-Tmin)/2 trend toward in the limit? It tends toward ZERO. As the daytime and nighttime temperature excursions get closer together the mid-range tends toward zero instead of the absolute temperature.”
It’s rather pointless going over your comments error by error again, but here you introduce a completely new one.
The (Tmax-Tmin)/2 tends to zero as Tmin tends to Tmax, correct. Only problem is the equation for Tmean is (Tmax + Tmin) / 2. That equation tends to Tmax (or Tmin) as Tmin tends towards Tmax.
You’re right, my bad. The mid-range value is *still* useless in describing anything to do with climate. It *loses* data. You cannot reproduce the temperature curve from the mid-range data. If you can’t do that, then it is of no use.
BTW, you never addressed the fact that my graph shows that the temperature curve approaches a sine wave. Which begs the question of why climate scientists refuse to move to a metric that actually describes the climate.
Is it just for the funding and the ability to use it to scare people?
“BTW, you never addressed the fact that my graph shows that the temperature curve approaches a sine wave.”
I’m not denying that a sine wave might be a reasonable model for a daily cycle. The point is irregardless of the shape of the wave you cannot ignore the displacement from zero, so you cannot simply multiply the max by 0.637 to get an average.
But if a sine wave is a good fit for a daily cycle, it also means that the mean derived from the average of max and min is a reasonable approximation of the actual daily mean.
“I’m not denying that a sine wave might be a reasonable model for a daily cycle.”
Then why did you say:
“Says the person who wants to model every day by a perfect sine wave.”
“The point is irregardless of the shape of the wave you cannot ignore the displacement from zero, so you cannot simply multiply the max by 0.637 to get an average.”
As I told you before, if there is a DC component then subtract it out, calculate the average, and add the DC component back in.
Again, the mid-range value is *NOT* the average value of a sine wave.
“But if a sine wave is a good fit for a daily cycle, it also means that the mean derived from the average of max and min is a reasonable approximation of the actual daily mean.”
No, it isn’t! The amount of daytime heating is the integral of the temperature profile during the day. It is *NOT* the mid-range value between Tmax and Tmin. The mid-range value is *NOT* an average value. It is not a mean. It is a mid-range value. You keep mixing up terms. Is that on purpose?
“As I told you before, if there is a DC component then subtract it out, calculate the average, and add the DC component back in. ”
I’m not sure what you mean by DC component, these are temperatures not electricity. But assuming you mean the mean daily temperature, what you’re describing is exactly what I’ve been trying to tell you for ages. You cannot just multiply the max temperature by 0.637 to get the “daytime” average, you have to subtract the mean multiply by 0.637 and add the mean back, hence 0.637(max – mean) + mean.
“Again, the mid-range value is *NOT* the average value of a sine wave.”
Again, maybe you need to define what you mean by the average value of a sine wave. I’m talking about the sine wave over a whole cycle or series of cycles. Isn’t the DC component the average value of a sine wave?
“No, it isn’t! The amount of daytime heating is the integral of the temperature profile during the day. It is *NOT* the mid-range value between Tmax and Tmin.”
Yes, the amount of day time heating is not the mid-range value between Tmax and Tmin. That’s because it’s not the average daily temperature.
“The mid-range value is *NOT* an average value. It is not a mean. It is a mid-range value. You keep mixing up terms. Is that on purpose?”
Yes, it’s on purpose. I’m purposely trying to stick to accepted meanings and you keep changing definitions. By “average value” or mean temperature I mean the average of all temperatures during the day, and by day I mean a 24 hour period. If temperatures follow a sine wave during the day, the average value will be mid-range value between min and max, because sine waves are symmetrical about their mid point.
If you don’t think the mid-range value is equal to the average value, explain what is? If you mean it isn’t the average value during the daytime, however you define that, you are correct. But that doesn’t mean it isn’t the average value over the whole day.
“The only reason you can’t would be if the temperature curve does not approach a sine wave.”
Yet again, it’s not the shape of the sine wave that’s the problem, it’s the translation.
“If you want to quibble about the actual value of the integral then have at it.”
I’ve said before, and maybe you didn’t notice, that as far as I can tell, what your integral should be is 0.637*(TMAX – TMEAN) + TMEAN. That’s rather more than a quibble.
here is the graph.
Where’s 0°F on your graph? What does an average daytime temperature of 85*0.637 ≈ 54°F look like on your graph?
If you think about these questions you might begin to see your problem.
“Where’s 0°F on your graph? What does an average daytime temperature of 85*0.637 ≈ 54°F look like on your graph?”
It doesn’t matter where zero is. The graph shows that the daily temperature curve. It *is* close to a sine wave albeit with some distortion.
If it has a DC component you don’t like then subtract it out!
*I* don’t have a problem at all. I’ve analyzed waveforms my entire life, pure and distorted.
You are looking for any excuse you can find to show that a mid-range temperature (an average!) has some meaning. And that an average of mid-range temperatures has some actual meaning in the real world. And none of your excuses have any bearing on the issue at all. You can’t even tell the difference between dependent and independent measurements, i.e. multiple measurements of the same thing and a set of measurements of different things!
*That* is where the problem lies. You have a hammer and see everything as a nail, refusing to admit that screws exist. They are just another nail to hammer in!
“It doesn’t matter where zero is.”
It does if you are trying to find the area under the curve.
“If it has a DC component you don’t like then subtract it out! .”
Careful, you might be on the brink of figuring it out.
“You are looking for any excuse you can find to show that a mid-range temperature (an average!) has some meaning”
Yet again, this particular discussion has nothing to do with the virtues or otherwise of the standard daily temperature mean. It’s entirely about trying to get you to understand that you cannot get the “daytime average temperature” by multiplying the max by 0.637. Accepting this doesn’t in anyway effect the usefulness or otherwise of TMean. If anything it would make your argument stronger to derive the correct daytime average.
Part 2
“So how can two locations have the same area under the curve unless A_1 and A_2 are the same?”
You are talking about CDDs here, they are not the area under the sine wave, they are the area under the positive part of the sine wave minus the magic number. And of course, the daily temperature cycle is not Asin(x), its Asin(x) + m, where m is the mean temperature.
The most obvious way two different maximums can both have the same CDDs is if neither reach the magic number, then the CDDs are both zero. But for days when there is cooling, being able to play with both the amplitude and the displacement can easily result in similar CDD values for different max and min values.
“You are talking about CDDs here, they are not the area under the sine wave, they are the area under the positive part of the sine wave minus the magic number.”
Minus what magic number? And they *are* the area under the curve – that *IS* the definition of an integral.
Actually the CDD is the Asin(x) – Asin(0). Zero is the baseline, not the mid-range value. A temp of +10C is based on a baseline of 0C, not some mid-range value. The area of the curve to be evaluated is based on the set points. That’s no different than evaluating sin(x) from 20deg to 100deg. You still get the area under the part of the curve that is between 20deg and 100deg.
This is why Kelvin should be the scale used for all climate related stuff, not celsius or fahrenheit. You get rid of the arbitrary 0 baseline.
“The most obvious way two different maximums can both have the same CDDs is if neither reach the magic number, then the CDDs are both zero.”
Oh, I get it. The magic number is the set point! Remember what degree-days are used for. If the set point is 65F and the daytime temps never reach that value then what use is air conditioning? Remember, degree-days are *not* an average. They are a direct value obtained from an integral. They are not divided by time interval to get an average. I only used degree-days as an example of a better way to evaluate climate. That’s what HVAC engineers use to evaluate climate. They don’t use “average” temperature. I trust actual engineers whose personal liability depends on evaluating climate in the real world far more than a climate scientist, mathematician, or statistician whose connection to the real world is tenuous at best and has no personal liability at stake.
“But for days when there is cooling, being able to play with both the amplitude and the displacement can easily result in similar CDD values for different max and min values.”
Really? And exactly how would this happen if the temperature curves are not the same? What displacement are you talking about? The only way I can think of for this to happen with different temperature curves is if the curves are not approaching a sine wave. Where does this happen and how often does it happen?
“Minus what magic number?”
By Magic number simply meant whatever value you are using as the base line.
“And they *are* the area under the curve – that *IS* the definition of an integral.”
I take it you didn’t read the rest of my sentence where I said “they are the area under the positive part of the sine wave minus the magic number.”.
“Actually the CDD is the Asin(x) – Asin(0).”
What fresh nonsense is this? sin(0) = 0, for all values of 0.
“Zero is the baseline, not the mid-range value”
Come again? You’re using 0°C as a baseline for CDDs? How cold do you want your buildings?
“Remember, degree-days are *not* an average.”
They’re an average of temperatures, over the baseline, minus the baseline per day.
“They are not divided by time interval to get an average.”
I’m assuming that they would actually be calculated from readings taking at set times, every hour, half hour or minute. The shorter the interval the closer the average will get to the integral (that’s the definition of an integral), but I can’t see how you could do an actual integral as you have no way of knowing the true function, and any sampling method will be more accurate than simply assuming it is a sine wave.
“They are not divided by time interval to get an average.”
Oh yes they are. If you have 24 hourly readings you have to divide the total degrees above the baseline by 24 to get the value in degree days. If not you would have Cooling Degree Hours. Even if you take the integral you are still dividing the sum by the number of time intervals, it’s just that the number tends to infinity. (You also have to divide it by whatever scale you are using, so if for example you are modelling a sine wave from 0 to 2pi to represent the day, you have to divide the area under the curve by 2pi.)
“ I trust actual engineers whose personal liability depends on evaluating climate in the real world far more than a climate scientist, mathematician, or statistician whose connection to the real world is tenuous at best and has no personal liability at stake.”
Says the person who wants to model every day by a perfect sine wave.
“They’re an average of temperatures, over the baseline, minus the baseline per day.”
An integral is not an average.Do your dimensional analysis.
\int_{a}^{b} \! sin(x)\,\mathrm{d}x.Where a=0 and b=pi.
sin(x)dx is an area. sin(x) is a height and dx the width of a rectangle. The integral from 0 to pi sums all the areas under the curve sin(x).
To get an average you would have to divide by pi, the total interval over which the integral is done.
If this isn’t clear enough then consider the integral of a velocity curve. The integral doesn’t give you an average velocity. Velocity is distance/time. When you multiply by dt you wind up with distance, not average velocity.
Perhaps the sin(x) is confusing you. x is not time, it is radians or an angle, e.g. theta.
The integral is actually Asin(theta)dtheta. There isn’t any time involved. A is the amplitude of the sine wave.
“Says the person who wants to model every day by a perfect sine wave.”
This is the best you got? If it isn’t close to a sine wave then what *is* the function that describes the temperature profile? Show some courage – tell me what you think the function is.
From degreeday.net:
“The third is the Met Office Method – a set of equations that aim to approximate the Integration Method using daily max/min temperatures only. They work on the assumption that temperatures follow a partial sine-curve pattern between their daily maximum and minimum values.”
degreeday.net is a commercial enterprise selling their degree-day calculations to all kinds of professional engineers sizing HVAC systems – engineers subject to personal liability if their output is wrong. Pardon me if I put my trust in them instead of you.
“To get an average you would have to divide by pi, the total interval over which the integral is done.”
You do have a habit of repeating what I said earlier as if I don’t understand it.
All this stems from you saying CDDs are not an average. I say they are. If you calculate them using any sampling technique you have to divide the total through by the number of samples. this is true even if you use an integral, it’s just you are dividing through by an infinite number of samples. Of course, if you estimate the CDD using a sine wave function you also need to divide by 2pi, because a day is 1 day, not 2pi days.
“Perhaps the sin(x) is confusing you. x is not time, it is radians or an angle, e.g. theta.”
If you are saying the sine wave represents the daily temperature cycle, then x is representing time, it’s just measuring time in unusual units, where there are 2pi radians in a day.
I’m still interested in what point you are trying to make throughout the CDD discussions. First you were saying that we have instruments that can measure at 1 minute intervals, and we should use these to calculate CDDs and throw out any data that isn’t based on high frequency measurement, but now you are happy to estimate all CDDs based on max and min and on the assumption that daily temperature is close to a sine wave. I don’t have a problem with either, but you now seem to be suggesting the estimate is more accurate than the minute samples.
“The third is the Met Office Method”
After all this time insisting that mean temperatures are useless you now advocate methods that are based around the mean temperature.
What makes you think the met office method is using a mean temperature? Did you not read what I quoted?
““The third is the Met Office Method – a set of equations that aim to approximate the Integration Method using daily max/min temperatures only.”
The method uses MIN AND MAX temperatures as input to a set of equations meant to account for the distorted sine wave shape in calculating degree-day values! Min and Max are not means!
So you don’t know what the Met Office Method is. Of course you can do it using only min and max, but that’s because you calculate the mean from min max.
There’s also the Extended Met Office Method which replaces the (min + max) / 2 mean, with an actual mean.
Here’s the Met Office Method in full
tim: ““To get an average you would have to divide by pi, the total interval over which the integral is done.”
bell: “You do have a habit of repeating what I said earlier as if I don’t understand it.””
Really? I repeated what you said? Here it is –
tim: “Remember, degree-days are *not* an average.”
bell: “They’re an average of temperatures, over the baseline, minus the baseline per day.”
The integral, i.e. the degree-day value, is *NOT* an average. Are you now changing your story?
“All this stems from you saying CDDs are not an average. I say they are.”
They are *NOT* an average. I showed you that using dimensional analysis of the integral. The integral determines the area under a curve. That is *NOT* an average. It is a total. To get the average you have to divide by the interval on the horizontal axis. Degree-days values are not divided by the interval.
“If you calculate them using any sampling technique you have to divide the total through by the number of samples.”
When you calculate the area of a tabletop, length times width, do you DIVIDE by the length of the table? Do you divide by the width of the table? Why would you *have to* divide the area under a curve by the interval being integrated?
” this is true even if you use an integral, it’s just you are dividing through by an infinite number of samples”
I truly despair of teaching you calculus. My teaching skills just aren’t great enough.
Asin(x) * dx
/\ /\
height width
This is an area. When you move dx incrementally along the horizontal axis you create an infinite number of area totals. The integral SUMS these into an overall area. THERE IS NO AVERAGING.
“If you are saying the sine wave represents the daily temperature cycle, then x is representing time, it’s just measuring time in unusual units, where there are 2pi radians in a day.”
You are not measuring in unusual units. Go look up steinmetz and phasor representations of a sine wave. Nor does it matter that time is the independent variable. You *still* aren’t dividing by the total time when you integrate the temperature curve. Nor is it correct to try and calculate an integral of a sine wave from 0 to 2pi. You always wind up with zero area yet it is obvious that the result can’t be correct since there is obviously area under the positive half of the sine wave and the same for the negative half of the sine wave. You lose that information when you try to integrate from 0 to 2pi. You integrate from 0 to pi for the positive half of the wave and from pi-0 for the negative half of the wave.
“calculate CDDs and throw out any data that isn’t based on high frequency measurement, but now you are happy to estimate” (bolding mine, tpg)
The two bolded words are the operative ones to consider. If you don’t have a perfect sine wave you can still calculate a pretty close estimate through successive approximation. If you don’t have a perfect sine wave then estimating from Tmax or Tmin usually winds up being less accurate. But either method will still tell you more about the temperature curve than a mid-range temperature which tells you exactly nothing.
If the curve is a perfect sine wave then either method will give the exact same answer for both the total area under the curve and for the average value of the curve – which is *NOT* the mid-range value.
“Degree-days values are not divided by the interval. ”
Maybe we are confusing each other here. When I talk about calculating the degree-days I’m talking about doing that for each day. You take the integral over a day and divide by whatever units you are using for time. If you are integrating a complete sine wave the interval is 2pi, and you have to divide the area under the curve by that to get the degree-days for that day.
Maybe you are thinking in terms of a longer period when you sum the degree days for each day. But in any event you still have to scale the value by whatever value you are using to represent an individual day.
This is all getting rather silly in any case, as the integration method as described in http://www.degreedays.net is to take samples at specific intervals which inevitably means you have to divide the total obtained by the number of samples, or if you prefer multiply each sample by the fraction of a day it represents.
“This is an area. When you move dx incrementally along the horizontal axis you create an infinite number of area totals. The integral SUMS these into an overall area. THERE IS NO AVERAGING.”
It amounts to the same thing. As the width of the rectangle gets smaller the area decreases, that’s the same as dividing the sum of the heights by the number of rectangles. When I say an integral can be thought of as an average, that’s what I mean. It isn’t the specific average, for that you have to divide by the interval.
“Nor is it correct to try and calculate an integral of a sine wave from 0 to 2pi. You always wind up with zero area yet it is obvious that the result can’t be correct since there is obviously area under the positive half of the sine wave and the same for the negative half of the sine wave.”
Firstly we are not integrating a sine wave, we are integrating the positive area over the base value. That answer is not necessarily zero.
Secondly, when talk about the area of a function under the curve, it is always the area with respect to zero. If the function falls below zero the integral will count that as negative area. Whether that’s useful to you depends on whether you are just interested in the literal area, or want to use it to derive an average. The average of a sine wave is zero.
“If the curve is a perfect sine wave then either method will give the exact same answer for both the total area under the curve and for the average value of the curve – which is *NOT* the mid-range value.”
I still not sure what you mean by the “average value of the curve” is it isn’t the average of all values of the curve.
Part 3
“You want us to believe that you can take 1000 measurements of 1000 independent, random boards, each measurement with its own uncertainty (e.g. +/- 1″), lay them end to end and that the final length will have an uncertainty of 1/1000″. ”
No, no no. Summing 1000 measurements, measured with independent uncertainty of ±1″, will increase the uncertainty by the square-root of the sample size. In this case the uncertainty is around ±32″.
What I, and everyone else including Taylor, say is that when you divide the sum by 1000 to get the mean length, you also divide the uncertainty by 1000 – hence the uncertainty of the mean is the original uncertainty divided by the square-root of 1000, or about ±0.032″.
Now, I know, you don’t believe you should divide the uncertainty of the sum by 1000 to find the uncertainty of the mean. Which if true would mean that say, if every board was 1 yard long, the average length of the boards would be 1 yard ±32″, meaning the actual average could be just 4″ or almost 2 yards, despite all boards being measured as between 35 and 37″.
You don;t think this is a contradiction and insist Taylor supports you. But you quote refutes that – he says “when measured quantities are multiplied or divided, the fractional uncertainties add”. I’ve already explained in detailed algebra why that means that if you divide a measureand by a constant you can also divide the uncertainty by the same constant.
You’ve already provided part of the answer by pointing out that a constant has no uncertainty, hence if you have two measures A and B, and multiply them (or divide, it’s the same argument) to get a measure AB, than the fractional uncertainty is derived by adding the uncertainties of A and B. But if B is a constant it’s uncertainty is 0, so this is just the uncertainty of A. The fractional uncertainty of A remains unchanged when scaled by B, but as it’s a fractional uncertainty, the absolute uncertainty must scale in order to keep the same fraction.
But as I say, Taylor explains this himself on page 54, section 3.4.
“will increase the uncertainty by the square-root of the sample size. In this case the uncertainty is around ±32″.”
The square root of the samle size times the uncertainty interval. sqrt(u1^2 + …. + u1000^2). If you have the same uncertainty for all measurements then you can factor out u and are left with u[sqrt(1 + …. + 1) ] or the sqrt (1000).
“What I, and everyone else including Taylor, say is that when you divide the sum by 1000 to get the mean length, you also divide the uncertainty by 1000 – hence the uncertainty of the mean is the original uncertainty divided by the square-root of 1000, or about ±0.032″.”
Taylor doesn’t say that. Neither does Bevington or the GUM.
Again, as usual, you are confusing the uncertainty of the calculation of the mean with the uncertainty of the mean itself. They are *NOT* the same. You can calculate the mean of 1000 independent, random samples to however many digits you want but you won’t change the uncertainty interval associated with that mean. If the uncertainty interval is +/- 32″ then you can’t normalize that away. It will remain that no matter what you do. The accuracy with which you calculate the mean has no bearing on the uncertainty of the final, overall length.
“the uncertainty of the mean”
As I just said, the uncertainty of the mean is *NOT* the uncertainty of the final result. Why do you continue to make this obvious mistake?
The mean of random, independent samples is *meaningless*. You can’t point to any board and say it’s length is the mean. You *can” do that if you have random, dependent samples, e.g. multiple measurements of the SAME THING.
You left off the most important thing Taylor said:
“According to rule (3.8) the fractional uncertainty in q = Bx is the sum of the fractional uncertainties in B and x. Because delta-B=0, this implies delta-q/q = delta-x/x.”
He multiplies by the absolute value of B in order to get the FRACTIONAL uncertainty, which is dependent on the value Bx.
Taylor is *NOT* scaling the uncertainty itself by the constant.
“You left off the most important thing Taylor said:
“According to rule (3.8) the fractional uncertainty in q = Bx is the sum of the fractional uncertainties in B and x. Because delta-B=0, this implies delta-q/q = delta-x/x.”
”
I don’t know why you think that makes your point. It’s describing exactly what I’m saying.
“He multiplies by the absolute value of B in order to get the FRACTIONAL uncertainty, which is dependent on the value Bx.”
No he doesn’t. The fractional uncertainty remains unchanged between q and x. Therefore the absolute uncertainty has to be scaled by B. If the FRACTIONAL uncertainty scaled with B it would mean that if say the uncertainty of something was 1%, and you divided it by a 1000, the fractional uncertainty would decrease to 0.001%, which would make the actual uncertainty much less.
“Taylor is *NOT* scaling the uncertainty itself by the constant.”
Yes he is.
He spells it out in the following examples. Measure a stack of 200 sheets of paper with an uncertainty of ±0.1″, divide by 200 to get a measure of a single sheet of paper with an uncertainty of ±0.0005″. How do you thin he gets 0.0005, excpet by dividing 0.1 by 200?
“I don’t know why you think that makes your point. It’s describing exactly what I’m saying.”
Then you should understand that you do *NOT* divide the uncertainty by the number of samples or the sqrt of the number of samples. The uncertainty in q is the uncertainty in x, not x/N or x/sqrt(N).
“No he doesn’t. The fractional uncertainty remains unchanged between q and x.”
q = Bx. In order to get q in order to determine the fractional uncertainty you need to know Bx! B is a slope of a linear equation, it is not a scaling factor!
“it would mean that if say the uncertainty of something was 1%, and you divided it by a 1000, the fractional uncertainty would decrease to 0.001%, which would make the actual uncertainty much less.”
NO! NO! You use B to get q! q is used to determine the fractional uncertainty. It does *NOT* lower the uncertainty!
Again delta-q/q = delta-x/x
There is *NO* dividing by N in order to make delta-q/q smaller than delta-x/x.
The uncertainty of 200 sheets of paper is the sum of the uncertainties of each individual sheet! You are looking at this backwards. When you have 200 samples, each with an uncertainty of +/- .0005, you wind up with a total uncertainty of +/- (.0005)(200) = +/- 0.1! The uncertainties ADD! You do *NOT* divide the uncertainty of the individual samples by N or you would get something less than .0005!
“Again delta-q/q = delta-x/x”
Yes. That’s the whole point. The fractional uncertainties are equal. That means that if q > x, then it must be that δq > δx. If q = 100x, then δ = 100δx, if q = x / N, then δq = δx / N.
“The uncertainty of 200 sheets of paper is the sum of the uncertainties of each individual sheet!”
No it isn’t. Have you read Taylor’s example? He’s making a single measurement of all the papers stacked together. The uncertainty of that one measurement is 0.1″. It would be difficult to measure the width of a single sheet of paper to an accuracy of 0.0005″, and even if you could the uncertainty of adding together 200 sheets would follow the adding by quadrature rule, it would be 0.0005 * sqrt(200).
“Taylor doesn’t say that. Neither does Bevington or the GUM.”
See 4.4.3 in the GUM. 20 temperature measurement measurements taken, standard deviation is 1.489°C. The standard uncertainty of the mean is give as 1.489 / sqrt(20), or 0.333°C.
Read it closer. Take a look at Annex F.
“Components evaluated from repeated observations: Type A evaluation of standard uncertainty”
Repeated measurements of the same thing! This creates a probability distribution whose true value is the mean.
This doesn’t apply to single measurements of different things!
go to: https://www.cdc.gov/niosh/docs/2014-151/pdfs/chapters/chapter-ua.pdf
“Within the field of industrial hygiene, the quantities uj are often standard deviation component estimates obtained from a single measurement-method evaluation, rather than from replicates. When the estimates are independent, a combined uncertainty uc may be computed (through the propagation of uncertainty approximation) as:
𝑢𝑢𝑐𝑐 = �𝑢𝑢1 2 + 𝑢𝑢2 2 + ⋯”
u_c = sqrt(u_1^2 + u_2^2 …..)
The manual even speaks to expanding this value by a coverage factor to get what is called the “expanded uncertainty interval”. They do *not* say you should divide the root-sum-square by the number of measurements!
“Take a look at Annex F.”
Annex F starts
“Uncertainties determined from repeated observations are often contrasted with those evaluated by other means as being “objective”, “statistically rigorous”, etc. That incorrectly implies that they can be evaluated merely by the application of statistical formulae to the observations and that their evaluation does not require the application of some judgement.”
I wouldn’t disagree with that at all. You need to use judgement in evaluating statistical uncertainty. In particular, you need to be sure that all observations are random and independent. It goes on
“ If all of the observations are on a single sample, and if sampling is part of the measurement procedure because the measurand is the property of a material (as opposed to the property of a given specimen of the material), then the observations have not been independently repeated;
an evaluation of a component of variance arising from possible differences among samples must be added to
the observed variance of the repeated observations made on the single sample.”
Not the use of the word “if” at the start. If you are making observations of a single sample there’s a possibility that the observations will not be independent.
Am I missing something? They seem to be saying the opposite of what you are claiming.
Is the CDC document talking about averages? The bit you quote is only talking about combining uncertainties, it makes no mention of dividing anything. Note it says “…estimates obtained from a single measurement-method evaluation, rather than from replicates”.
Elsewhere they talk about taking 16 samples and dividing the uncertainty by sqrt(16), but the language is specialized and confusing so I’m not entirely sure what they mean.
AFAICT, when they talk about expanding the uncertainty interval, they just mean multiplying the standard deviation to get a 95% confidence interval.
Why do you insist on ignoring the title of the Annex?
“Components evaluated from repeated observations”
Yes, you *are* missing something. You are reading what you want to see and not what is being said.
“ When the estimates are independent, a combined uncertainty uc may be computed (through the propagation of uncertainty approximation) as:
𝑢𝑢𝑐𝑐 = �𝑢𝑢1 2 + 𝑢𝑢2 2 + ⋯”
u_c = sqrt(u_1^2 + u_2^2 …..)”
I don’t see any division by N or sqrt(N) in this. Where do you see it?
What do I keep trying to differentiate for you? Independent, random measurements vs random, dependent measurements.
Taylor says direct addition of the uncertainties associated with random, independent measurements may yield a value that is too high so you should use root-sum-square. This document implies that root-sum-square may yield a value that is too low so you use an expansion factor to correct it. Take your pick but do so using sound engineering judgement.
I don’t know why I continue trying to educate you on uncertainty in physical science. You are just going to continue saying that the central limit theory applies to *all* cases and you can minimize uncertainty by increasing N. It’s sad, truly sad. You think adding more independent random boards to a data set will *decrease* the uncertainty of the final length of all the boards laid end-to-end. No amount of examples seems to deter you from that view.
“Why do you insist on ignoring the title of the Annex?”
Sorry, I though I had to read what the Annex said, not guess at some cryptic message in the title. For a document that is so legalistic I ‘m surprised they couldn’t have just put in a clause saying you must never average different things, or never divide uncertainties. So what does the title say? “Components evaluated from repeated observations”, and what is that meant to tell me, beyond the fact that they are referring here to components evaluated from repeated observations.
“I don’t see any division by N or sqrt(N) in this. Where do you see it?”
Pages 9 and 10, Section 4: “Uncertainty and analytical lab procedures”.
“This document implies that root-sum-square may yield a value that is too low so you use an expansion factor to correct it. Take your pick but do so using sound engineering judgement.”
Yes, to account for the fact that there may be over factors beyond the known uncertainties.This isn’t because RSS is wrong, just that there may be unknown sources of error in addition.
“You are just going to continue saying that the central limit theory applies to *all* cases and you can minimize uncertainty by increasing N.”
Yes I will unless you can provide solid evidence that it doesn’t. And as long as in all cases, you mean all cases of independent random samples.
“It’s sad, truly sad. You think adding more independent random boards to a data set will *decrease* the uncertainty of the final length of all the boards laid end-to-end.”
What’s truly sad is that you keep repeating that lie. I do not think that adding boards will decrease the sum of their lengths (assuming you mean absolute uncertainty). It’s truly sad that you still haven’t figured out the difference between a sum and an average.
“No amount of examples seems to deter you from that view.”
Maybe because all you examples fail to demonstrate what you claim, and just rely on you asserting that they mean nothing. Try doing your example in the real world, find a large set of wooden boards of mixed length. Take a random sample, measure them with as much uncertainty as you want, work out the average length, and compare it to the actual average length of your boards. Then repeat the experiment with large samples.
Part 4
“Mid-range temperatures tell you nothing about the climate. You *still* haven’t show how you can determine minimum and maximum temps from a mid-range value. If you can’t do that then you know nothing of the climate associated with that mid-range value!”
You cannot determine the max and min from the mean. That’s not the purpose of the mean. The mean is a summary statistic. That does not mean it tells you nothing.
And as I keep saying, having an average does not stop you from looking at other statistics.
“You cannot determine the max and min from the mean. That’s not the purpose of the mean. The mean is a summary statistic. That does not mean it tells you nothing.”
It tells you NOTHING. Period. Exclamation point. It is not even a summary statistic. As I’ve pointed out, the mid-range tends toward zero as temperature excursions decrease – meaning it tells you NOTHING about the climate. NOTHING!
Averaging something that tells you NOTHING leaves you with KNOWING NOTHING!
Part 5
““The uncertainty in the measurements is usually of little importance”
Have you *ever* framed a house? Have you *ever* had to order I-beams for a bridge construction?…
The uncertainties in the measurements of all of these is of HIGH IMPORTANCE if you are going to do a professional job.”
Way to take my comment out of context. When I said uncertainty in the measurements is of little importance I meant when determining the uncertainty of a sampled mean.
Of course, uncertainty is important for all those things, but not if you are deriving an average from a random sample. What determines the error of the mean is the randomness of the sample, the more variance in the population the greater the uncertainty of the mean, the more samples you take the less uncertainty. If the things you are averaging vary by meters, and the measurements are uncertain ±1cm, any errors from the measurements will have little effect on the error of the mean compared to the effect from the randomness of the sample.
“Way to take my comment out of context.”
I quoted you fully and in context. If you didn’t say what you meant then blame yourself, not me.
Uncertainly applies to *all* things measured. The difference lies in whether you are creating a data set of values surrounding a true value with a Gaussian distribution or whether you are not. If you are measuring the same thing multiple times then you are creating a probability distribution around a true value and the uncertainty can be minimized by more precisely calculating the mean. If that probability distribution is, however, not Gaussian (e.g. the surface of the measurement device wears away with each measurement) then you can’t even use the central limit theory to minimize uncertainty.
This does *NOT* apply to multiple measurements of different things. In this case there is *NO* true value around which you are creating a probability distribution. Taylor explains this well. Yet you are apparently too stubborn to read his treatise for meaning. With no probability distribution around a true value then the average takes on the uncertainty calculated by root-sum-square of the uncertainties of the individual uncertainties.
You can only random sample the same thing! The samples must be dependent – i.e. depend on the same thing. In sucha case you get a probability distribution. Random samples of different things are *independent*, the average of the values do not get you closer to a true value.
If your sample consists of two boards, one 1 foot long with an uncertainty u1 and the other 2 feet long with an uncertainty of u2, then averaging their length will *NOT* give you a true value. There IS NO TRUE VALUE. You get an average of 1.5 feet with an uncertainty of sqrt( u1 + u2). And that value tells you absolutely nothing about either of the boards. You can do it with 1000 random, independent boards and you will find the same thing. There IS NO TRUE VALUE. It doesn’t matter how precisely you calculate the average, it represents *NOTHING* in reality. And the uncertainty in their total length placed end-to-end will be the sqrt(u1^2 + …. un^2). And the average wil have that same uncertainty.
I don’t know why this is so hard for supposedly educated scientists, mathematicians, and statisticians to grasp. It just tells me that none of them has ever done anything where the uncertainty must be considered and personal liability attaches if it is not properly considered.
“I quoted you fully and in context. If you didn’t say what you meant then blame yourself, not me.”
You didn’t even quote a full sentence. My paragraph in full with the bit you quoted in italics
“As I keep trying to tell you, the uncertainty in the mean of different things is mostly due to the sampling. The uncertainty in the measurements is usually of little importance, but the formula is the same, divide the standard deviation by the square root of the sample size.”
“This does *NOT* apply to multiple measurements of different things. In this case there is *NO* true value around which you are creating a probability distribution.”
There certainly is a true value – it’s the population mean.
“Taylor explains this well. Yet you are apparently too stubborn to read his treatise for meaning.”
Why should I have to scour over a 300+ page book to see if he actually says what you claim. You are making the claim, you give me the quote and page number.
“You can only random sample the same thing!”
You still haven’t explained what you mean by “the same thing”.
“The samples must be dependent”
No. Most statistical analysis assumes samples are independent.
“Random samples of different things are *independent*, the average of the values do not get you closer to a true value.”
Search Taylor for the word independent. You’ll see he frequently says how much better it is if errors are assumed to be independent. If you errors are independent you can reduce the uncertainty compared to dependent errors. He says it on page 57 in the bit you quoted above.
“If your sample consists of two boards, one 1 foot long with an uncertainty u1 and the other 2 feet long with an uncertainty of u2, then averaging their length will *NOT* give you a true value. There IS NO TRUE VALUE.”
You haven’t defined the population in this two board sampling. Are we talking about all boards in existence, all boards of a particular type, boards from the same factory, or are we only interested in these two boards. Whatever the case, the TRUE VALUE is the mean of all those boards. Why you would want a sample of just 2 I don’t know.
“And that value tells you absolutely nothing about either of the boards.”
The point of taking a sample to derive an average is to estimate the true average of the population. It is not to tell me something directly about the specific samples. It might tell me something about the two boards in general, as part of the population. For example if I was comparing boards from one source with ones from another source, and wanted to test the hypothesis that one source was providing longer boards than the other. (This isn’t a serious suggestion, but that’s the problem. You keep bringing up silly examples where there’s little point taking the average, then claim that proves that averages can never be useful.)
“It doesn’t matter how precisely you calculate the average, it represents *NOTHING* in reality.”
And so on, ad nauseam. I don;t know how many times I can say this, but just because you think the population average is nothing in reality, doesn’t make it so.
“And the average wil have that same uncertainty.”
And I say it won’t.
“I don’t know why this is so hard for supposedly educated scientists, mathematicians, and statisticians to grasp”
Have you considered it’s because you’re wrong? I’m not any of those things you list, but even I can see that what you say is demonstrably false.
I also take it you don’t consider yourself to be an educated statistician, yet despite that you still feel you know that all of them are wrong.
“There certainly is a true value – it’s the population mean.”
Nope. There is no true value for a data set consisting of random, independent measurements. As with boards you can’t point to any board and say the *TRUE VALUE” for that board is the mean of the samples. You *can* do that with random, dependent measurements such as multiple measurements of the same thing.
“Why should I have to scour over a 300+ page book to see if he actually says what you claim. You are making the claim, you give me the quote and page number.”
I AM NOT YOUR TEACHER! I expect you to enter a discussion with proper basic knowledge. But to humor you, go to Taylor, Page 57:
“Specifically, you will see that if the original uncertainties are INDPENDENT and RANDOM (caps are mine, tpg), a more realistic (and smaller) estimate of the final uncertainty is given by similar rules in which the uncertainties (or fractional uncertainties) are ADDED IN QUADRATURE (caps mine, tpg) (a procedure defined shortly).
Page 93: “We have seen that one of the best ways to assess the reliability of a measurement is to repeat it several times and examine the different values obtained.”
In other words, multiple measurements OF THE SAME THING.
When you make multiple measurements of the same thing you are creating a probability distribution of uncertainty which can be analyzed using statistical tools.
When you are combining multiple measurements of different things you are *NOT* creating a probability distribution of uncertainty which can be analyzed statistically.
I am talking about the universe of the sampled values. It doesn’t matter if you have a universe of size two or size one thousand.
“Whatever the case, the TRUE VALUE is the mean of all those boards. “
You obviously have no understanding of the term TRUE VALUE. You can’t point to any random board and say it’s length is the mean!
“The point of taking a sample to derive an average is to estimate the true average of the population”
You have just jumped from using the term “true value” to using “true average”. Of what use is the true average of random, independent boards?
“ It is not to tell me something directly about the specific samples.”
Then what is the exercise for? If the average doesn’t represent the universe then of what use is it? You can’t use it to build the framing for a room and expect to not get a wavy ceiling. You can’t use it for determining the number and sizing of fish plates to connect bridge supports and not expect to have gaps somewhere. You can’t use it to grind crankshaft journals to the same size. AND YOU CAN’T USE IT TO DETERMINE CLIMATE!
“For example if I was comparing boards from one source with ones from another source, and wanted to test the hypothesis that one source was providing longer boards than the other. (This isn’t a serious suggestion, but that’s the problem. You keep bringing up silly examples where there’s little point taking the average, then claim that proves that averages can never be useful.)”
What is silly about this example? If you don’t know if some boards are longer than others then how do you build a room frame and not get a wavy ceiling? Do you even understand what causes the wavy ceiling?
“And so on, ad nauseam. I don;t know how many times I can say this, but just because you think the population average is nothing in reality, doesn’t make it so.”
You can’t order t-shirts for a population of humans based on their average height. So what use does the average height provide you? You can’t even tell if the average height increases because short people are getting taller or because taller people are getting taller! All you know is the average changed! So what? It provides you no data that is useful in the real world!
“Have you considered it’s because you’re wrong?”
I’m not wrong. I have backed up everything I’ve asserted.
“I also take it you don’t consider yourself to be an educated statistician, yet despite that you still feel you know that all of them are wrong.”
I am an engineer. I was trained in handling uncertainty. I know the difference between measuring the output a circuit multiple times using analog equipment in order to get a “true value” and measuring multiple different circuits to try and find a “true value”. The second situation is a loser. We would get an F on any experiment where we tried to use an average of every students test circuit as the “true value” for all of them. That’s because all components in the circuits have uncertainty and those uncertainties would add. So a circuit measuring x1 and a circuit measuring x2 could both be within the uncertainty range. And no amount of averaging would tell you a “true value” representative of both (or even of multiple circuits). If you measured each circuit multiple times you would generate a random, dependent probability distribution that would allow you to develop a “true value” for that specific circuit but it would probably be a totally different true value for a different circuit. And what would averaging those true values tell you? NOTHING. You couldn’t build another, brand new circuit, and expect to be able to predict what its true value would be!
Apparently uncertainty analysis is no longer taught at university, either to engineers or to mathematicians/statisticians. Everything is just assumed to be subject to the central limit theory – even random, independent measurements!
“In other words, multiple measurements OF THE SAME THING.”
Yes, there’s he describing how you can use statistics to improve the accuracy of a measurement by repeatedly measuring the same thing and taking the average. What he is not saying, is that the laws of statistics change just because you are measuring different things.
I do think this is the root of your and other’s problems. The method of sampling to get an average of independent values, the method of determining the standard error of that mean, etc. have been around for a lot longer than Taylor’s book. All Taylor et al are doing is showing one application of these methods, applying it to improving the accuracy of measurements of “single things”. But that does not mean, that suddenly they can only be used for measuring single things.
By the way, I still don’t think you’ve given me your definition of a single verses different things.
“You can’t order t-shirts for a population of humans based on their average height.”
You wouldn’t want just the average, it would help to know the standard deviation of the population, or better still have an estimate of the density function. But if you don’t even know the average height of a person, how do you propose to start your t-shirt ordering business. You can’t use your engineering knowledge to measure every customer before making them a bespoke t-shirt.
“You can’t even tell if the average height increases because short people are getting taller or because taller people are getting taller! ”
But you can tell that the average height has increased. That’s one of the uses of statistics, comparing some average of two distinct populations and seeing if they are statistically different. If you cannot analyze the means it’s much more difficult to know if there has been any statistical change.
“What he is not saying, is that the laws of statistics change just because you are measuring different things.”
Of course he is! Exactly what do you think he is describing when he says to use root-sum-square with random, independent measurements to propagate uncertainty?
“ do think this is the root of your and other’s problems. The method of sampling to get an average of independent values, the method of determining the standard error of that mean, etc. have been around for a lot longer than Taylor’s book. “
You *still* can’t figure out that standard error of the mean is not the uncertainty of the mean! Standard error of the mean is how precisely you can calculate the mean. Uncertainty of the mean is what interval in which the true value lies.
Why do you have such a hard time with admitting that random, dependent data is *NOT* the same as random, independent data?
“All Taylor et al are doing is showing one application of these methods, applying it to improving the accuracy of measurements of “single things”. But that does not mean, that suddenly they can only be used for measuring single things.”
Taylor’s not the only one saying this. Bevington’s textbook says the same thing. So does the GUM.
Single vs many?
Single: you have 20 students come over and read the analog voltmeter connected to an amplifier. You get 20 samples that are random and dependent. They develop a probability distribution you can use to get an average reading that is considered to be the true value. But you have to be careful even in this case you might not get a Gaussian distribution. The circuit may not be stable thermally. The air temperature may change if a thermostat kicks in the HVAC system. As students step up to do the reading they may create air currents that causes a temperature instability.
Multiple: You have 20 students build 20 amplifiers. They use 20 different voltmeters to measure the output of their amplifiers. You get 20 random, independent measurements. Those 20 random, independent measurements each have an uncertainty. If you use 10% or 20% tolerance passive parts the amplifiers can vary more than that because of using multiple passive parts. And of course environmental impacts can affect each of the 20 amplifiers differently. Those 20 random, independent measurements don’t represent a probability distribution that can be analyzed using the central limit theory to develop an average representing a true value. The true value of each amplifier is a totally separate thing from all the other amplifiers. You *can* calculate a mean but the uncertainty of that mean will be the root-sum-square of the uncertainty of each separate, independent amplifier. You are only fooling yourself if you think you can reduce the uncertainty of that mean value by dividing by 20 or by sqrt(20).
“ou can’t use your engineering knowledge to measure every customer before making them a bespoke t-shirt.”
What do you think a carpenter does when he builds a frame for a room? As for the t-shirts have you ever been to an outlet mall? They are full of unsold clothing items – unsold because they don’t fit anyone. Ever been to a t-shirt shop where they print up t-shirts for each and every customer? They actually *do* measure each customer!
“But you can tell that the average height has increased.”
So how does that help you in any way? You still can’t order t-shirts based on the average size! Just like you can’t tell what is happening to the climate based on mid-range values changing!
“Of course he is! Exactly what do you think he is describing when he says to use root-sum-square with random, independent measurements to propagate uncertainty?”
He’s saying that if you don’t know if your measurements are random independent measurements, you can only assume that that uncertainties add when you add measurements – e.g. if you measure something with an uncertainty of 1cm 100 times, the uncertainty of the sum could be 100cm, which means if you take the mean value of the 100 measurements the uncertainty is still 1cm.
But if you can assume that all your measurement errors are independent you can use root-sum-square, which means adding the squares of your uncertainties and taking the square root. In this case taking the sum of a hundred independent measures, each with an uncertainty of 1cm gives an uncertainty on the sum of just 10cm, and when you take the average reduces the uncertainty of the mean to 0.1cm.
I’m not sure how you think the statement means “The laws of statistics change just because you are measuring different things.”
“He’s saying that if you don’t know if your measurements are random independent measurements, you can only assume that that uncertainties add when you add measurements – e.g. if you measure something with an uncertainty of 1cm 100 times, the uncertainty of the sum could be 100cm, which means if you take the mean value of the 100 measurements the uncertainty is still 1cm.”
You are getting further and further afield trying to rationalize your world view concerning uncertainty.
You keep saying random, independent measurements and then go on to describe random, dependent measurements!
“If you measure something ….100 times” (bolding mine) This implies you are measuring the same thing 100 times, thus generating a probability distribution around the true value. This probability distribution is amenable to statistical analysis.
That is *NOT* the same thing as taking measurements of 100 different things with uncertainties associated with each thing. In that case the uncertainties add, just like they add when you lay two boards end-to-end!
You get so close and then you go crazy! When you *add* values to create the average you *add* the uncertainties as well.
As we’ve already discussed, you do *NOT* divide the sum of the uncertainties by N. delta-q/q = delta-x/x. The formula is *NOT*
delta-q/q = (delta-x/x)/N
“I’m not sure how you think the statement means “The laws of statistics change just because you are measuring different things.””
I don’t think the laws of statistics change. I think they don’t apply when you are combining random, independent measurements.
Is an uncertainty interval a probability distribution? If so, then tell me what kind of a distribution it is.
“You keep saying random, independent measurements and then go on to describe random, dependent measurements!”
No I’m not. You don;t seem to understand what “independent measurements” means. If you measure the same thing multiple times and get a random error each time, that’s an independent measurement (that is the errors are random samples from the probability distribution of the uncertainty. Similarly if I take random samples from a population the errors, deviation from the average will be randomly distributed along the distribution of the population.
Measurements are not independent if for example they were caused by an error in the instrument, or if your random sample was taking from specific locations. Say for instance you were doing a timing test, but the person using the stopwatch had slow reaction times which always added a second to the time. These errors would not be independent if you used the same person to make each measurement.
What independent does not mean, is independent from the thing being measured, whether it’s the length of a piece of wood or the average of many pieces of wood.
“That is *NOT* the same thing as taking measurements of 100 different things…”
I was describing what Taylor was saying. He’s talking about using averaging to improve the uncertainty in measuring a single thing. But that “something” could just as easily be the mean value of a population, with uncertainties that are caused by the distribution of elements within that population.
“As we’ve already discussed, you do *NOT* divide the sum of the uncertainties by N”
That’s not a discussion, that’s you endlessly shouting it.
“delta-q/q = delta-x/x. The formula is *NOT*
delta-q/q = (delta-x/x)/N”
Finally you same something correct. Why you’d think the formula would be that I’ve no idea. delta-q/q = delta-x/x is the relevant part it means that the ratio of the uncertainty of q to q is equal to the ratio of the uncertainty of x to x. Why you cannot understand what that implies about the size of the uncertainty of q when it is scaled from x is beyond me. But why try to figure it out when you could just look in that big handy box Taylor gives you where he says
“Is an uncertainty interval a probability distribution? If so, then tell me what kind of a distribution it is.”
An interval is not a probability distribution, but the errors that make up the uncertainty does.
“You *still* can’t figure out that standard error of the mean is not the uncertainty of the mean! Standard error of the mean is how precisely you can calculate the mean. Uncertainty of the mean is what interval in which the true value lies.”
I can’t figure it out because it’s gibberish. Standard error of the mean is the uncertainty. A standard error means that if we knew the true mean there would be a 68% chance that any sampled mean would lie within the 1 sigma interval, about a 98% chance that it would lie within the 2sigma interval.
“Why do you have such a hard time with admitting that random, dependent data is *NOT* the same as random, independent data?”
I don’t have any problem “admitting” that. It’s an assumption of all the statistics I’m talking about that the data is random, independent data. The complications arise if the data is dependent.
“I can’t figure it out because it’s gibberish.”
It’s not gibberish. It’s at the root of uncertainty propagation.
Why do you think all the uncertainty texts I’ve given you say that for indpendent, random measurements the uncertainty is calculated by root-sum-square and not (root-sum-square)/sqrt(N)?
You keep saying I am wrong but you are really saying that all those people stating you use root-sum-square are wrong!
“Standard error of the mean is the uncertainty.”
NO! It is not! Not for random, independent measurements! I keep giving you the example of boards laid end-to-end. You can calculate the mean for the total length as precisely as you want but you will *not* decrease the total uncertainty of the final length in any manner whatsoever. It doesn’t matter if you lay 20 boards end-to-end or 2000 boards end-to-end. The preciseness which with you calculate the mean has nothing to with the uncertainty of the final length. And since the final length is used to calculate the mean the uncertainty of the final length propagates directly to the uncertainty associated with the mean. Laying more and more random, independent boards end-to-end makes the final length *MORE* uncertain which makes the uncertainty of the mean more uncertain as well!
“Why do you think all the uncertainty texts I’ve given you say that for indpendent, random measurements the uncertainty is calculated by root-sum-square and not (root-sum-square)/sqrt(N)?”
Because they are talking about adding uncertainties and not about taking the average. But they then go on to point out how if you are taking an average you have to divide by N (not sqrt(N) in your example).
“You keep saying I am wrong but you are really saying that all those people stating you use root-sum-square are wrong!”
No, I’m saying they are correct. I’m also saying you don;t seem to understand the implication, and ignore all the countless examples where they demonstrate what happens to the uncertainty when you divide by the sample size.
“I keep giving you the example of boards laid end-to-end.”
Maybe you should try given an example that involves an average.
“And since the final length is used to calculate the mean the uncertainty of the final length propagates directly to the uncertainty associated with the mean.”
Yes. Using the propagation rule q = B ⇒ δq = Bδx
“Laying more and more random, independent boards end-to-end makes the final length *MORE* uncertain which makes the uncertainty of the mean more uncertain as well!”
Yes to the first part, no to the second.
“Single vs many?”
I asked for a definition, all you gave me was an example. What I’m really trying to get at is, do you consider measuring the same thing means measuring exactly the same physical entity, or can it mean measuring different entities to establish a common value.
For example, if you measure a stack of 200 sheets of paper to determine the thickness of a single sheet, is that measuring many things (i.e. the individual sheets of paper) or one thing (i.e.the thickness of a single sheet)?
Or, if I count how many babies on average are born per day in a hospital, am I measuring multiple things (i.e. individual babies), or a single thing (the birth rate)?
“Ever been to a t-shirt shop where they print up t-shirts for each and every customer? They actually *do* measure each customer!”
But your question was about ordering t-shirts. Either the t-shirt shop is making each t-shirt from scratch to the specific dimensions of the customer, or it has a stock of ordered t-shirts based around the most common sizes.
Part the Last
“You can deduce a seasonal influence, that’s about all.”
So finally, you admit you can tell something from a mean temperature. It’s a start.
“If next year the mean temperature in July is 21C how do you know what caused the increase? Did max temps go up? Did min temps go up? Was it a combination of both?”
You can tell by looking at the maximum and minimum values. If you don;t have them, be thankful that at least you have the mean value as otherwise you’d have no idea it had gone up at all.
“So finally, you admit you can tell something from a mean temperature. It’s a start.”
You don’t need to know a mid-range temperature to know that the seasons change! Get out of the basement once in a while!
Do you see any max and min temperatures being output by the climate models? Do you see any max and min temperatures included with the GAT? I don’t.
“You can tell by looking at the maximum and minimum values. If you don;t have them, be thankful that at least you have the mean value as otherwise you’d have no idea it had gone up at all.”
But I *would* know if the climate scientists actually gave us data that is meaningful! Something I can use to make actual decisions in the real world we live in. Do I buy a heaver coat? Do I buy more shorts and sandals? Do I plant before Memorial Day or afterwards? Do I plant more corn or more soybeans?
You are in dire need of a course in digital signal processing.
Possibly, but does it have any relevance to averaging telephone numbers?
It doesn’t matter which you use. Averaging telephone numbers or averaging temperatures from multiple locations using multiple devices (each with an inherent uncertainty) – neither tell you anything useful.
DSP question, how do you re-create a continuous function using just two values?
Averaging west coast temperatures, e.g. Los Angeles, that are highly dependent on Pacific Ocean temps with east coast temps, e.g. NYC, which are highly dependent on Atlantic Ocean temps tells you exactly what? Using anomalies only hides the real physical differences between various geographical locations and provide no real data useful in judging anything. An anomaly from the average temp in Port Barrow, AK averaged with an anomaly from the average temp in Miami, FL tells you absolutely nothing.
The Global Average Temperature is a myth. It tells you nothing, let alone a “global climate”.
A myth the climastrologers cling to as if stuck with Velcro.
The first map’s baseline uses the 20th century average global surface temperature as its anomaly base. Unfortunately you have to read the text at the NOAA site to know that.
Rubbish!
I thought we should be focusing on climate, not weather around here /s
Indeed, Pauleta. Weather refers to short term atmospheric conditions while climate is what is predicted by the GIGO computer models and solemnly declared by the IPCC to be true, who are the all mighty appointed judges of the such matters to have the final word.
They just assume that all the data they don’t have is following what the models have predicted, then average that in with the tiny amount of real data they do have, and miracle of miracles, the data now shows what they wanted it to show all along.
” ….. Adjusted Away! “I know the feeling; my wife and I use to have joint bank account and every month statement would show that account was ‘adjusted away’, well above my expectations. Now having separate accounts I’m pleased to report there are no unexpected adjustments.
South America is going to get colder due to the pseudo magnetic pole that has formed over South America.
The Geomagnetic, north and south poles create a space charge differential in the ionosphere which in turn creates a circular movement of the jet stream about the pole.
The geomagnetic field shields the earth from high speed galactic cosmic radiation… mostly high velocity protons.
Normally geomagnetic poles are at high latitude. When a geomagnetic pole forms at low latitude it cause increased cloud cover and cooling,
When the geomagnetic field suddenly weakens there are multiple geomagnetic pole formed.
A geomagnetic pseudo pole is a region of the earth…. Just like the South Atlantic geomagnetic anomaly which is incorrectly named as the South Atlantic geomagnetic anomaly is now centered on South America… Also creates a circular motion of the jet stream about the pseudo pole.
A geomagnetic pole reversal is region of the earth that suddenly changes polarity which creates a pseudo magnetic pole in that region.
https://www.pnas.org/content/pnas/115/52/13198.full.pdf
The speleothem analysis has the geomagnetic field has changed cyclically. i.e. What we are observing now has happened below.
Speleothem record of geomagnetic South Atlantic Anomaly recurrence
https://www.frontiersin.org/articles/10.3389/feart.2016.00040/full
The South Atlantic Anomaly: The Key for a Possible Geomagnetic Reversal
In the last 15 years it has been found that the regions of the earth in the recent past suddenly changed ‘polarity’.
The dipole moment of Earth’s magnetic field has decreased by nearly 9% over the past 150 years and by about 30% over the past 2,000 years according to archeomagnetic measurements. 2006 paper.
Recent satellite data indicates the geomagnetic field is now weakening 10 times faster.
https://news.yahoo.com/earths-magnetic-field-weakening-10-times-faster-now-121247349.html
“Previously, researchers estimated the field was weakening about 5 percent per century, but the new data revealed the field is actually weakening at 5 percent per decade, or 10 times faster than thought. ….
You make your assertions as though you actually know what you are talking about.
What you don’t realize is that the South Atlantic magnetic anomaly is the result of a huge alien space ship that crashed into the sea. It landed on the west side of the mid-Atlantic spreading center is has been carried into and under South America.
Clyde, Your comment is not rational/logical. It is not scientific. Scientific discussion is based on observations/facts/logic.
The dirty secret ‘Climatologists’ are hiding is specific regions of the earth warm and cool cyclically, correlating with Solar cycle changes and for some unexplained reason the geomagnetic field strength also changes regionally abruptly. Just like it is doing now.
The Greenland Ice core data graph is very interesting as it shows short term cyclic warming on the Greenland ice sheet which is exactly same as is occurring now. This warming is called Dansgaard-Oeschger warming. The D-O warming events are short: Either 20 years or 30 years. The D-O events are followed by sudden cooling.
The recent ‘Global warming’ is not global, it is regional. If CO2 was causing the warming the warming would be global not region.
The Greenland ice core data/analysis was initially suppressed not believed (and a second Greenland ice core was drilled to confirm the data has correct) because of the unexplained cyclic warming, D-O events.
The snowfall rate is much higher on the Greenland ice sheet, than the Antarctic ice sheet, so the smoothing/fast change hiding, is not as sever as the Antarctic ice core data. (i.e. The finding of fast cyclic warming was not expected as the fast warming is smoothed away in the Antarctic ice core data.
This is the proxy temperature data from the analysis of the Greenland Ice Sheet Two project for the last 11,000 years, from Richard Alley’s paper.
The Antarctic Peninsula juts out of the Antarctic polar vortex and has a high snowfall rate so it captures changes to the South sea temperature. The south hemisphere has warmed cyclically in the past, exactly like it is warming now.
The first paper about this data was suppressed by firing the Nature ‘Science’ editor who has working with authors to publish a science paper written by highly qualified, unbiased proxy specialists.
Does the Current Global Warming Signal Reflect a Recurrent Natural Cycle.
http://wattsupwiththat.files.wordpress.com/2012/09/davis-and-taylor-wuwt-submission.pdf
“Public media in the U.S., including National Public Radio (NPR), were quick to recognize the significance of this discovery. The past natural warming events reported by Mulvaney et al. are similar in amplitude and duration to the present global warming signal, and yet the past warmings occurred before the industrial revolution and therefore were not caused by anthropogenic greenhouse gases.”
. The paper, entitled “Recent Antarctic Peninsula warming relative to Holocene climate and ice-shelf history” and authored by Robert Mulvaney and colleagues of the British Antarctic Survey (Nature, 2012, doi:10.1038/nature11391), reports two recent natural warming cycles, one around 1500 AD and another around 400 AD, measured from isotope (deuterium) concentrations in ice cores bored adjacent to recent breaks in the ice shelf in northeast Antarctica.
It looks like you missed the sarcasm in my remark. I do agree that scientific discussion is based on observations/facts/logic. I think that your remarks are short on logic and supporting facts.
So NOAA show parts of Brazil as being below the 1981-2010 average and other parts above. UAH shows almost the entire country as within 0.5°C of the 1991-2020. Guess which data set is described as fraudulent here.
UAH shows that the Southern Hemisphere in July was 0.24 degrees colder than the same month in 2020. It is currently abnormally cold in the SH. The above NOAA figure is largely fiction.
The post isn’t talking about the southern hemisphere, but Brazil. UAH shows the SH as slightly, 0.07°C, above the 1991-2020 average. The post is claiming it should be unusually cold in Brazil and if you’re data shows July is average, it must be because of fraud. Question remains, is UAH fraudulent?
The weather station at Sao Paulo, Congonhas airport, for July 2021.
Both Tmax and Tmin show negative anomalies against the 81-10 averages.
Anomaly of -0.7°C for the year so far.
Also, how does being above the average of the last 30 years make the southern hemisphere “abnormally cold”?
So bellman you only arrive on temperature related threads which I accused you of yesterday ,you of course ignored that part of my post , yet here you are again.
Do I have to contribute to every post on this site?
I tend to avoid the political arguments and concentrate on posts were I feel I can make a reasonable concentration, usually involving correcting an obvious error or trying to explain how statistics work. This usually means the ones about temperature because I’ve spent some time looking at temperature series. Given that this used to be a blog about global warming temperature obviously cones up quite a lot.
No you don’t and neither do I, its just noticeable you 1 only comment on temperature related topics , and 2 only in a negative sense . But you do tend to keep your cool which is a +
Hahahahahahahahahah, thanks, this was quite amusing.
Antarctica seems to be like Schrödinger’s cat 🐱 – simultaneously warming and cooling. Self-appointed talking heads of climate science announce endlessly that it’s all melting away while at the same time the actual observations show the opposite – cooling temperatures and extending sea ice:
https://notrickszone.com/2021/07/12/new-study-a-profound-1c-cooling-trend-across-east-antarctica-since-1979-is-likely-to-accelerate/
Recent retreat if Antarctic sea ice might have given alarmists hope but this is now proving to have been a short term anomaly and normal service is being restored with sea ice:
https://notrickszone.com/2021/08/15/antarctic-sea-ice-recovery-surprises-scientists-classic-disinformation-technique-of-not-reporting/
Will you stop it with that data? We have models to rely upon!
Now we know where Al Gore is.
Don’t worry: The coffee here in Colombia is just fine. Just finished a cup…
I’ll drink to that. The Colombian coffee here is just fine too.
Not drinking aguardiente like the locals?!
This is the second post of this nature. But no link to the source of the main map and nothing on the legend or title of the map about what averages.
It says percentiles, however that is defined. This leads me to think that it may over the whole record.
France, like Brazil was surprising comfortable temperatures in July. Coolest I’ve seen in a decades.
If this is the whole record since 1850 or so it may well be “warmer than average”.
A link to the original source is required.
If you follow the link given in the article, you will find the links to the original source
Pretty easy really
There is no source for first map.
If it’s so easy, maybe you could post link of a link that you found.
original article contains all the links: https://notalotofpeopleknowthat.wordpress.com/2021/08/14/hottest-month-poppycock/
NO it does not !
I already looked at that and checking again it does NOT have a link for the original map.
Under first map his article has a link to the BBC not NOAA.
Maybe that’s why you reply with a link to Paul Homewood’s article rather than the link to the source which you falsely claimed is there but failed to be able to produce.
This site used to be hive of useful information. It’s going down hill rapidly.
Oh, I’m sorry, could you not be arsed to read the whole article on Paul’s site?
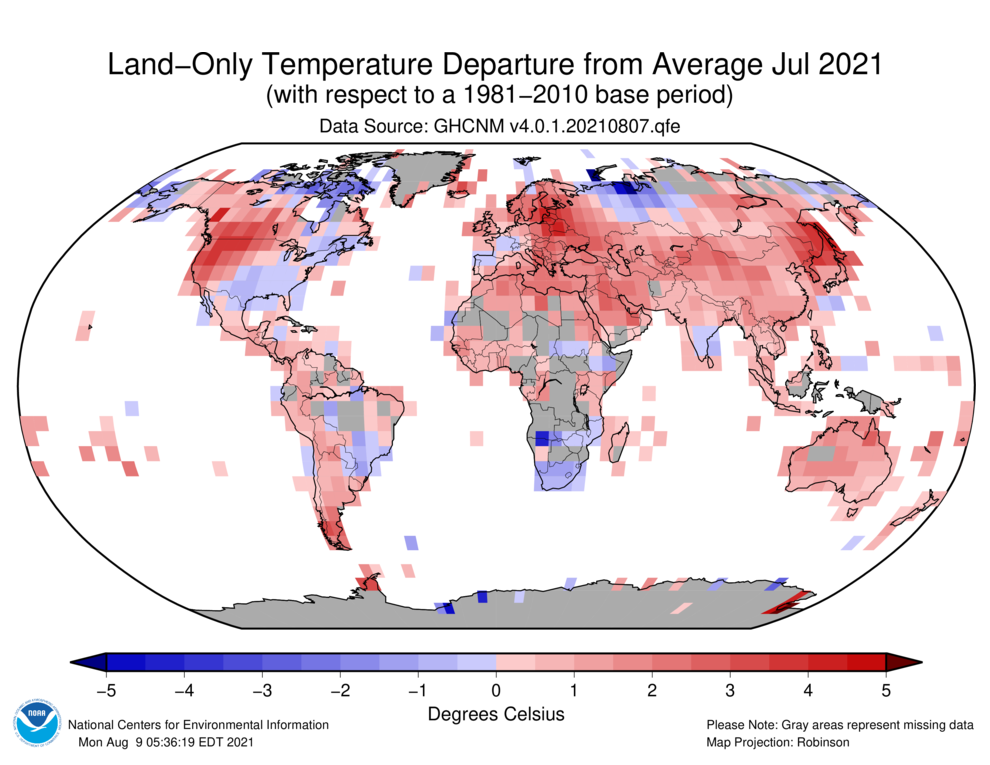
Can we make Adjustocene an official tag?
Frost is just part of the problem for Brazil, a ongoing drought affected the reproduction side of coffee plants because of a drought which is also effecting grain production ,they had rare snow as well.
https://youtu.be/7a66V8w_S5E
Profound cooling in Antarctica is well established and gathering pace:
https://notrickszone.com/2021/07/12/new-study-a-profound-1c-cooling-trend-across-east-antarctica-since-1979-is-likely-to-accelerate/
This will increasingly leak out in cold excursions in South America, South Africa and Australia.