Guest Post by Willis Eschenbach
The new UN IPCC Assessment Report 6 (AR6) is out, available here. They make it quite clear that a good chunk of what is in the report is not science. Instead, it is the opinions of scientists. They describe what they are using, for example, as:
… structured expert judgement (i.e., a formal, calibrated method of combining quantified expert
assessments that incorporate all potential processes)
First off, there’s no way to know if they’ve included “all potential processes”. We don’t know that much about the climate, and new discoveries are made monthly. Next, what is a “quantified expert assessment” when it’s at home? A numerical guess that they’ve thought a lot about?
And what is the “formal, calibrated method” for combining a bunch of numerical guesses made by “experts”?
Here’s the description of how they assess the likelihood of something, as well as how much confidence they have in that assessment of the likelihood (emphasis mine).
Throughout this Technical Summary, key assessment findings are reported using the IPCC calibrated uncertainty language (Chapter 1, Box 1.1). Two calibrated approaches are used to communicate the degree of certainty in key findings, which are based on author teams’ evaluations of underlying scientific understanding:
(1) Confidence is a qualitative measure of the validity of a finding, based on the type, amount, quality and consistency of evidence (e.g., data, mechanistic understanding, theory, models, expert judgment) and the degree of agreement; and
(2) Likelihood provides a quantified measure of confidence in a finding expressed probabilistically (e.g., based on statistical analysis of observations or model results, or both, and expert judgement by the author team or from a formal quantitative survey of expert views, or both.
A few notes on this quote. First, “evidence” in their world is not just data, observations, and mechanistic and theoretical understanding. “Evidence”, for them, also includes models and expert judgment. As a man who has programmed computer models of a host of systems, I can assure you that model output is “evidence” only in the very simplest of systems. That’s why Boeing and Airbus use wind tunnels to test physical scale models of proposed airplanes whose design is based on computer model outputs … because model outputs aren’t evidence.
And “expert judgment”, whether it is from one expert or “expert judgment by the author team or from a formal quantitative survey of expert views”, is not evidence in any sense. It’s valuable, to be sure, but a hundred years ago “expert judgment” said malaria was caused by lack of hygiene and fresh air, said ulcers were caused by stress, and said that continental plates couldn’t move … was that “evidence”?
It is hubris of the highest order to think that is not happening now in a variety of fields.
In any case, I thought I’d take a look to see just how good their “expert judgment” might be. I noted that they have a new “Sea Level Projection Tool” to give us their expert judgment on what sea-level rise might be in various areas around the planet.

Figure 1. Screenshot of the UN IPCC Sea Level Projection Tool. For a number of locations (blue dots), it gives both future levels and future rates of rise by decade, starting in the 2020s.
Now, I’ve written about sea level before, including discussing one of the best and longest records in the world. This is the San Francisco record, measured about an hour and a half south of where I write this. Here is that record.

Figure 2. San Francisco sea-level record.
In common with about 80% of the long-term sea-level records, there’s no sign of any acceleration in the rate of sea-level rise in San Francisco, either overall or during the last half-century. The sea-level rise has been stable for a century and a half at 2 mm per year, which is just under 8 inches per century.
So with that as prologue, what would the simplest prognostication be for the future San Francisco sea level rise? Me, I’d say given that there’s been a steady 2 mm rise for 170 years, the first guess would be not much different from 2 mm per year … particularly in the current decade, the 2020s.
And what do the UN IPCC models and the “expert judgment” tell us about the future sea-level rise in San Francisco? It depends on the “Scenario”. The UN IPCC uses five different scenarios. In order of increasing CO2 and other greenhouse gas emissions, and thus in order of increasing theoretical temperature rise, they are called the “1.9”, “2.6”, “4.5”, “7.0”, and “8.5” scenarios. In addition, for sea-level rise there are two “low confidence” scenarios. They say:
Two low-confidence scenarios, indicating the potential effect of low-likelihood, high-impact ice sheet processes that cannot be ruled out, are also provided. … Global mean sea level rise above the likely range – approaching 2 m by 2100 and 5 m by 2150 under a very high GHG emissions scenario (SSP5-8.5) (low confidence) – cannot be ruled out due to deep uncertainty in ice sheet processes.
With that as prologue, here are their median (50% quantile) projections of the rate of rise of future San Francisco sea levels, by decade, for those seven different scenarios.

Figure 3. UN IPCC projected rates of sea-level rise by decade. These are the median values.
(Let me note that this reveals one of the huge benefits of this kind of analysis for their “experts”—almost regardless of what the sea level does in the future, they can truthfully say “See, we projected that!”. But I digress …)
However, there’s a deeper and much more serious problem. To highlight it, here are the four least extreme scenarios, 1.9 through 7.0.

Figure 4. Same as in Figure 3, but for the four least extreme scenarios. Again, these are the median values.
I’m sure that you can see the problem. In their “expert judgment” of the model results, the median result (50% quantile) of the models for San Francisco sea-level rise for the current decade is 4 mm per year … say what? It’s been half of that for 170 years, and it’s suddenly gonna double this decade?
Now, at present we’re 2 years into the decade of the 2020s … so for the entire decade to average 4 mm per year, the rate would have to start accelerating today and continue accelerating to the point where it would hit about 7.5 mm per year by 2029. Only then would the decade average 4 mm per year.
It gets worse. The high estimates of sea-level rise (the 95% quantile) give San Francisco rates of rise ranging from 6.4 to 11.6 mm per year … for the current decade.
Sorry, but this is not science in any form. This is a joke. There’s no way on this earth that during the 2020s the average San Francisco sea level rise will average either 4 mm per year or 8 mm per year.
Bear in mind that this is the result of “a formal, calibrated method of combining quantified expert assessments that incorporate all potential processes”. Doesn’t that make you feel all warm and fuzzy about the rest of the UN IPCC AR6 claims?
So remember this monumental sea-level rise madness whenever someone points out that “the IPCC says” something about the future … their “expert judgement by the author team or from a formal quantitative survey of expert views” may not be worth a bucket of warm spit.
My very best to everyone—even in these parlous, fractious times, life is good.
w.
My Invariable Request: When you comment, please quote the exact words you are referring to. It avoids endless misunderstandings.
Discover more from Watts Up With That?
Subscribe to get the latest posts sent to your email.
Exactly. What someone thinks is not evidence of anything. Most especially when getting paid (or at a minimum, getting re-hired for the AR7 junket) is dependent on having the “correct” opinions.
Corruption of science by money, career-advancement considerations and/or fear of exclusion from a favoured group is rampant in climate science. And the pharmaceutical industry is not that different.
“What someone thinks is not evidence of anything.”
That’s right. Opinions are not good enough.
Yea I’ve seen this term “structured expert judgement” and it’s insidious, it threatens to undermine 500 years of the enlightenment (the real one) and the scientific method of Galileo, Vesalius and Newton.
Extravagant words? The whole point of the scientific method was to move to observation and deduction as a way of learning about nature. As an alternative to what? To structured expert judgement. Influential thinkers would sit and think about stuff, with minimal anecdotal observations and pronounce how the world was, that it was flat and fire came from phlogiston and that dirty blankets created mice, etc.
Observation based science had to fight hard to overcome “structured expert judgement”. Now it looks like it will have to fight the same fight again.
Figure 2 shows that “there is no statistically significant acceleration” of sea-level rise over the past 170 years, but the IPCC believes there will be a huge acceleration over the next decade.
Isaac Newton told us that an acceleration must be due to an unbalanced force. What is the “force” that will cause the IPCC’s predicted acceleration in sea level rise? If they believe it to be the rise in CO2 levels in the atmosphere, why didn’t it cause an acceleration during previous decades?
You have to take into account their forecast of dramatic temperature increase. That makes the air above the water expand, and therefore grow lighter in weight. With less weight pressing down of the water it rises up. (Their logic, not mine!)
The acceleration of sea level rise is supposed to occur because CO2 will supposedly raise atmospheric temperatures, which will warm the oceans, and will cause the oceans to expand, and increased amounts of ice will melt from the warmer weather, which will add to the increased sea level.
Unfortunately, for the alarmists, we have a 170 year record of no sea level acceleration even though CO2 has been rising all during that time. So it would seem CO2 is having no effect on sea level rise acceleration since there is no sea level acceleration.
LMAO. But “MAY” not be worth a bucket of warm spit?! Way too generous there! 😀
Reminds me, once again, of that transmission shop commercial on tv where the man behind the counter assures the customer “Our mechanics are experts!” while a bunch of chimpanzees beat on transmissions with sticks behind him.
I think of the IPCC as the chimps and the Eco-Fascist types in government as the guy behind the counter telling us to place our faith in the “expertise” of the chimps.
AGW, I’m always cautious in my claims. If I say that everything the IPCC says isn’t worth a bucket of warm spit, someone will undoubtedly come up with an IPCC statement that is true … and I’ll have to retract my statement.
Hard lesson learned from a lot of online posts …
w.
But surely from the sample we have to analyze we can safely say that at least 50% of what the IPCC says is not worth a bucket of warm yellow liquid?
I think it’s safe to say anything the IPCC says that is true is buried in the full “report” that will never be read by the “media” or the target politicians.
As for the “Summary for Policymakers,” I’d say the figure is damn near 100%, and anything “true” will be parsed in such a way as to substantially degrade its significance.
Understood.
But you didn’t actually say “everything the IPCC says” is not worth the “bucket,” you referred specifically to the “expert judgement by the author team or from a formal quantitative survey of expert views,” which is worse than worthless. All that does is provide some air of “authority” to baseless propaganda masquerading as “science.”
So in that respect, I think you’re still being too generous. 😀
… structured expert judgement (i.e., a formal, calibrated method of combining quantified expert assessments that incorporate all potential processes)
Structured “judgment” of experts who have an obvious interest in a particular outcome
Read Donna Laframboise.
Thanks for this post Willis. How might the IPCC respond?
Very likely, the IPCC would claim that global sea-level rise is already close to 4 mm per year. From A.17. of the Summary for Policymakers (SPM):
“Global mean sea level increased by 0.20 [0.15 to 0.25] m between 1901 and 2018. The average rate of sea level rise was 1.3 [0.6 to 2.1] mm yr–1 between 1901 and 1971, increasing to 1.9 [0.8 to 2.9] mm yr–1 between 1971 and 2006, and further increasing to 3.7 [3.2 to 4.2] mm yr–1 between 2006 and 2018 (high confidence). Human influence was very likely the main driver of these increases since at least 1971. {2.3, 3.5, 9.6, Cross-Chapter Box 9.1, Box TS.4}”
The SPM does not say but very likely the IPCC’s estimate that sea levels rose 3.7 mm/yr during 2006-2018 is based on satellite measurements, which began in 1993. Tide gauges show a constant rate of increase, satellites show a faster rate ever since the satellite record started. That is typically treated as evidence of an acceleration.
However, it may be because tide gauges are accurate than satellite measurements or vice versa.
I think we would need a definitive resolution of the divergence between tide gauge- and satellite-based measurements before we can definitively reject the IPCC’s 4 mm/year projection of sea-level rise in the 2020s.
Part of my comment on the AR6 review thread may need repeating here. It quotes the relevant part of the report.
Cross Chapter box 9.1 (9-100, page 2250 on my PDF).
IPCC also allows for isostatic rebound, wherein the land is rebounding from its being weighed down by ice sheets 20000 years ago. I think this is how they manage to turn Willis’s 2mm into 4mm p.a.
I seem to recall another new “adjustment” for the alleged “sinking” of the sea floor due to the weight of the water increasing due to whatever “additions.”
Which has %$#& all to do with relative sea level rise, so what difference does it make, even if is real?! If the sea level isn’t threatening shoreline houses (which it won’t be to the extent it isn’t “seen at the beach” because the sea floor is sinking instead of the water level rising), not seeing the “problem.”
But hey, anything that feeds the “It’s worse than we thought” bullshit.
I’ve always had trouble understanding something about sea level rise.
Given that water can flow unimpeded, why isn’t it the case that the sea level rise at every location, adjusted for the subsistence rise of the earth at that location, should be a identical at all locations (obviously subject to measuring error)?
Are there factors i am missing?
Good question. You’re missing:
1) Wind stress, which builds up water at some continental coasts.
2) Slow-scale (up to 50 years) “sloshing” of the water in the oceanic basins.
3) Currents, which like the wind cause the sea level to rise at obstacles.
4) Variations in gravity due to differences in mantle thickness
5) Differences due to the fact that the earth is not a sphere, it is an oblate spheroid.
6) Differences between the centripetal force at the poles and the equator.
7) Differences in barometric pressure which either depress or increase the sea level.
8) Differences in density due to temperature and salinity.
9) Geostrophic gyres
Regards,
w.
Just nitpicking .. #4,5, and 6 should not change the sea level rise.
#4 can change slowly over time as fluids in the mantle slosh about.
As long as they are steady and the fluids are not moving about, true.
However, that’s not 100% true all the time
w.
Factors that affect Mean sea level between locations:
* Gravity pull by sun, moon (daily tide cycle, waves can continue or reflect like trailing echoes in an old cathedral);
* Gravity pull by land (large land mass rising up from the average attracts more water);
* air pressure above the water;
* wind pushing the water from an area, to another coast (shape of sea floor and other land forms impeding flow affect this);
* small amount as water flows from flooded land ie. river flow, or pushed by volcanic activity;
* tiny amount from temperature change & evaporation because the movement of water is not instantaneous on the global scale.
MSL measured by tide gauges can change independent of true water level because:
* not built on solid rock ie. sand & mud are highly compressible and can be pushed out to neighbouring areas so land level sinks over time;
* geological process like the movememt of tectonic plates, rebound from previous ice loss (land is pushed down by ice but bounces back);
* additional weight of buildings & pumping out of water from below accelerates sinking;
* previous voids from mining, natural process or construction then allows ground to sink.
Satelites are measuring mm with instruments, position & methods which are about +/- 10cm per sample (they assume sub mm accuracy from 1000’s of samples). They seem to drift and increase the measurements overtime compared to geological stable tide gauges on the coast.
Thanks to both Willis and Typrus for comprehensive responses
First a couple general comments:
More specific comments:
I was not unaware that there are a lot of good reasons why one would not expect the distance from the center of the earth to the ocean surface to be a constant. The fact that the earth is not a sphere, and variations in gravity contribute to that expectation. The interactions of the sun and the moon and differential centripetal forces on tides affect the readings at any particular point in time, but should generally average out over modest lengths of time. Each of these can affect the absolute sea level but I don’t think any of them contribute to a differential trend.
The movement of tectonic plates and glacial rebound are both part of subsistence (I think). Mining excavation, building construction and fluid extraction can lead to surface sinking. Tygrus also pointed out the implications of gauges located on solid rock versus compressible foundations I knew all that but have a deeper appreciation that modeling subsistence has more independent variables than I had previously considered. I was well aware that gravity is not constant over X and Y (surface coordinates), but hadn’t fully considered that it also varies over T (time), due to the fact the tectonic shifts as well as glacial movement will affect the local gravity. I am very aware that temperature and salinity affect the sea level trend. ( I once did a back of the envelope calculation was surprised to conclude that temperature was a bigger contributor to sea level rise than glacial and non-floating ice sheet melting). While I understand both tribute to sea level trend I’ll be surprised if they are material contributions to differential sea level trend expectations.
That said, while the list of contributing factors is longer than I might’ve listed on my own, I remain convinced that if I were in charge of science I would approach it differently:
I don’t think the present approach makes a lot of sense.
“quantified expert assessment”
A guesstimate at best
Too kind, once again.
Let’s be more blunt – “Unsubstantiated bullshit.”
It’s hilarious that they use the word “confidence”, since they are all essentially playing a confidence game, and thus are “con men”.
Excellent point!
It’s a “confidence” game at the IPCC.
“The sea-level rise has been stable for a century and a half at 2 mm per year, which is just under 8 inches per century.”
I read many many years ago that California’s Central Valley has sunk 20-30 feet compared to Gold Rush days of 1850, attributed to pumping out so much underground water.
How far would this sinking effect the coast 100 miles away? Have there been any discussions of the cost sinking even a few inches? If there were a sudden 20-30 foot discontinuity in the Coastal Range, say, it would have been noticed.
By keeping a high scenario option in-play they guarantee hysterical media headlines. That’s all the 8.5 nonsense is there for.
The obvious reality goes unreported by MSM and unquestioned by politicians; a 2 meter rise by 2100 requires an 800% increase of current 3mm per annum rates for 79 straight years!
There’s an F-word to describe this nonsense and it’s not science.
Are this summer’s high temperatures caused by ‘global warming’ ?
Apparently NOT !
The highest temperature ever recorded on the European continent is 48C (118.4F), recorded in Athens on 10 July 1977
IPCC reports are written by….. volunteers (!)
“Hundreds of experts in different fields volunteer their time and expertise to produce IPCC reports. Thousands more contribute to the review process and to the literature and other knowledge that are assessed in IPCC reports. These scientists are not paid by the IPCC. Here are different ways to get involved.”
Source: https://www.ipcc.ch/about/engage_with_the_ipcc/
WR: Volunteers often want ‘to do good’ (from their viewpoint / according to their belief). This could result in a big bias in the IPCC reports, amplified by the fact that the IPCC does not work following the scientific method.
From the same source: “Becoming a chapter scientist is an opportunity for Early Career Researchers to gain important insights into what it means to work at the science-policy interface, work first-hand with leading international experts and build a global network of research contacts.”
Wow. That’s a loaded statement. Sounds like codespeak for “creating sciency bullshit that pushes political agendas for beginners.”
Are the Maldives under water yet? And Manhattan?
TIme to dig out their previous “predictions”.
Land surface of the Maldives is at risk of being pushed down below the waves by the accumulated weight of cash-filled briefcases 💼.
California Tumbles Into the Sea:
There is a video on the internet that explains how the level is not uniform but dependent on mass nearby attracting the water ( gravity) and the fact that the earth Is not spherical. Therefore it’s anybody’s guess what the real numbers are.
Let’s face it, all they’re doing is publishing a formally constructed series of outright lies, pretending to be ‘science’, to mislead people and steal public money, via a global fear-campaign, using the totally corrupt corporate and loony left public mass-media to try and scare involuntary money ‘donations’ out of people’s wallets via gutless and totally corrupt ‘democratic’ governments, in predominantly white Euro-majority countries and formerly white Euro-dominated colonial populations.
As no one else takes this UN IPCC climate-clown circus seriously, or will pay these crooks anything, or will put-up with the global con-jobs and continual lies and fraud they are pulling on us all.
And the only other countries that give a stuff about this are the devious slimy ones who are also trying to get some climate-cash scraps from the UN’s climate-heist banquet table.
Mean while China has zero intention of doing anything about CO2 emissions, and the UN has zero intention of making that any sort of issue or contention.
This is about as prejudiced, racist, one-eyed, hypocritical and insidious an agenda, of flagrant open crookedness, as you could possibly get, at a global level.
So much for a “Uniting” of the Sovereign Nations of the World in a common cause to deal with real global issues confronting humanity.
On top of this, CO2 is a minor gas that feeds plants via respiration, and thus feeds all life on earth, and greens the world in the process, and H2O, the other extraordinary global-greener, is also by far the greatest Greenhouse gas. So when are human H2O emissions going to be reduced too then?
No more pee-pees for you! … UN said so … think about the climate … safety first!
I see you’ve done the Spencer/Christy thing of jettisoning uncertainties, which are rather wide – so for the projections we see just the median values rather than the more usual 5-95 percentiles. For example the 2020 San Francisco values under the medium confidence ssp119 scenario are 3.8 (1.8,6.8) mm/yr-1 which embraces the values from the NOAA of 1.98 +/- 0.18 mm/yr. In fact the uncertainties for that scenario would seem to overlap all the way out to 2100AD.
The IPCC estimate for the contribution of vertical land movement at SF subtracts just 20mm after a century. I suspect this is too small and may be a contributory factor to the mismatch.
Also the Virginia Institute of Marine Science did find acceleration at the SF station, which if it continued would be enough to add an additional 15cm by 2050.
https://www.ktvu.com/news/report-sea-level-rise-accelerating-along-u-s-coasts-including-in-the-bay-area
Given the history, and presuming your aim is to persuade, could you provide a reason anyone should find your analysis more credible?
I don’t trust “scientists” who predict a noisy signal from a very short (one year) sample. You could get fantastic predictions by extrapolating measurements from a 6 hour interval between a low tide and a high tide.
John Phillips August 11, 2021 3:50 pm
Thanks for raising interesting issues, John.
In addition to linking to the actual data, I mentioned the 95% quantile, which was quite different from the 50% quantile (6.8 vs 4). If you can’t figure out from those values or the linked data that their prediction is all over the map, you’re not taller than the sign that allows you to go on this ride.
And since the trend for the last 100 years has been 2 mm/yr., on what planet can it possibly become a 6.8 mm decadal average? That’s 68 mm decadal total rise, and so far we’ve had … four mm.
So the IPCC is a valid and strong reference when it agrees with you … and otherwise, it’s wrong?
Got it.
In any case, 20 mm per century is a linear drop of 0.2 mm per year. To see if this is “too small” as you say, I went to SONEL to see what the GPS’s say. Here’s the nearest GPS, in downtown SF.
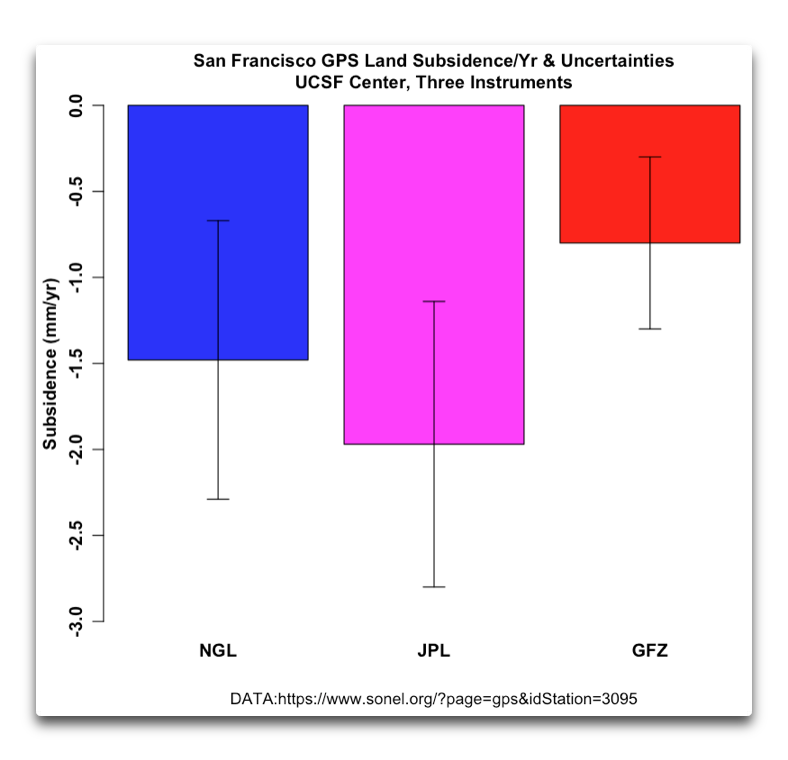
Given that, the IPCC estimate looks pretty reasonable … and consider.
If this is correct, the average absolute rate of rise is actually 1.8 mm/yr, not 2 mm … which makes the UN IPCC AR6 estimate even MORE unlikely.
That would imply an annual acceleration of 0.038 mm/year^2.
Your own VIMS link shows the following acceleration.
Please point out the horrendous current acceleration. Because as I read it, 14 of the 17 years show a negative 36-year acceleration, and the current acceleration is only 0.021 mm/yr^2.
It also shows that best-fit quadratic acceleration since 1969 gives a 2050 difference of 3.4 cm in 2050, not 15 cm.
I’ve discussed some of these issues in my post “Accelerating the Acceleration“.
Finally, your link does NOT state the statistical significance of the acceleration, and in fact their claimed acceleration isn’t statistically significant in the slightest.
You then say:
The link you laughably call “the history says:
The reviewer completely missed my point: we cannot simply say that there is or is not acceleration in a dataset simply because of the admittedly good statistical methods. This is because there are long slow acceleration and deceleration cycles in sea levels. As a result, the mathematical methods are subject to “end effects”—if the sea level data just happens to extend from one peak in the slow cycles to another, then using the “good statistical methods” will say that there definitely IS acceleration.
On the other hand, if the extent of the dataset just happens to correspond to trough to trough in the same record, the good statistical method will say there is negative acceleration …
My point was NOT that the mathematical statistical method is wrong. It’s not. My point was, we ALSO have to look at the underlying slow cycles, particularly in shorter records of 50 years and under …
In any case, regarding the current post, I’ve simply used the standard statistical methods for the full SF dataset, so the reviewer’s comments wouldn’t apply even if they were true … which they aren’t because he didn’t understand what he’d read.
In closing, is my analysis more credible than one that says that somehow the decadal rate of sea level rise will jump to as much as 6.8 mm/year, or even 4 mm/year? Using constant acceleration, to average 6.8 mm/year this decade, the 2029 rate of rise would have to be 17 mm/year … and that is totally and completely incredible.
Regards,
w.
Well, quite. You rudely say the IPCC projection is ‘all over the map’, most would say it has a large uncertainty range – a range which means if you were to draw the plots with the uncertainties in observations and projections – old fashioned things called error bars – you would see they actually overlap. Will you publish such a plot?
California experiences slow subsidence due to glacial isostatic adjustment with rates up to ~2 mm/year at latitudes >37°N and up to ~1.5 mm/year at lower latitudes
– from the paper I linked to.
Indeed the approach to uncertainties and significance around here seems a little shall we say, ‘fluid’. For example a recent post on an alleged but as it turned out, insignificant US cooling trend, also published without error bars..
“John, you are 100% correct that I did not publish the uncertainties of the answer. In fact, it is NOT statistically significant. However, that wasn’t my point. My point was that millions of folks are convinced that the US has been warming rapidly in the 21st Century, and we don’t know that at all. Not only do we not know that, but the Berkeley Earth and CERES data both show cooling, and although it is not statistically significant cooling … it’s still cooling.”
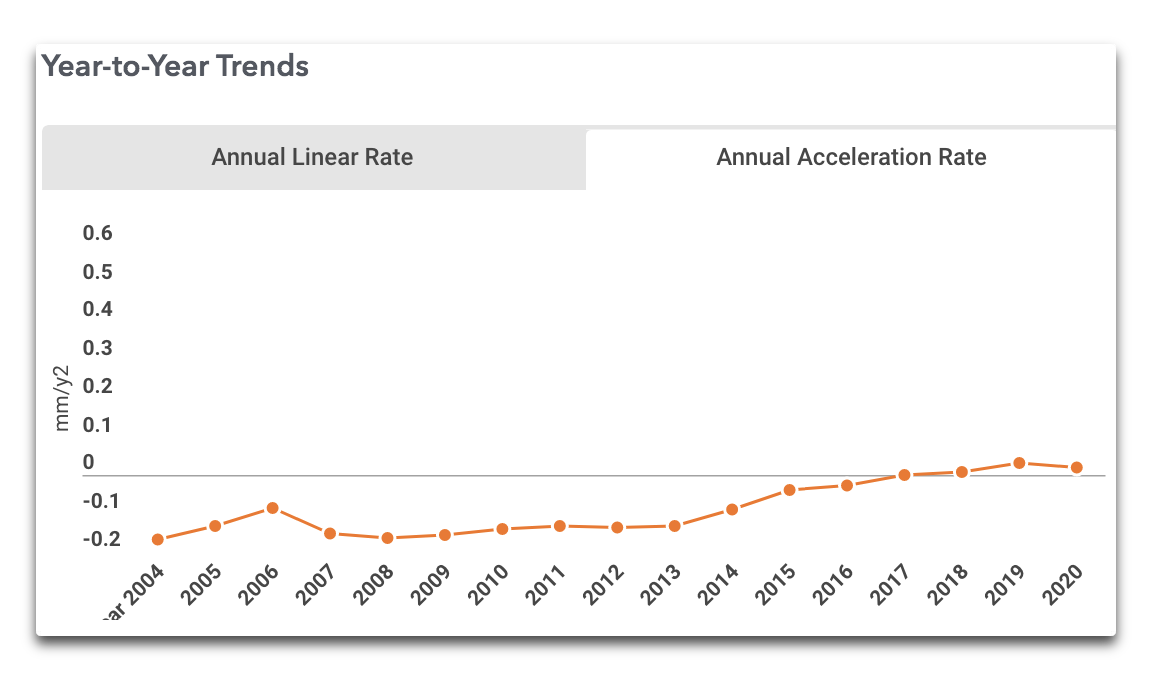
I leave folks to guess the author. So the data show acceleration at SF. It may not be statistically significant acceleration – but it is still acceleration 😉
Thanks for the chart showing the acceleration at SF is itself accelerating!
All the best.
PS I found this NAS document from 2012,
Sea-Level Rise for the Coasts of California, Oregon, and
Washington: Past, Present, and Future (2012)
They have projections consistent with the ones in AR6
San Francisco, CA, baseline 2000. Rise in cm (low scenario, high scenario.)
2030 7.8 (6.1–9.6) Rate:2.6mm/yr
2050 17.6 (12.7–22.3) Rate:3.5
2100 57.6 (37.3–76.1) Rate:5.7
Just maybe the IPCC are on to something? LOL.
Since the IPCC projections for the 2030 rates are (2.2 – 7.3 mm/yr), and the projections for 2100 are (0.6 – 24.2 mm/yr), you could pick just about any number and claim it is “consistent with the ones in AR6”.
Perhaps that impresses you …
w.
“you could pick just about any number and claim it is “consistent with the ones in AR6”.”
But you wrongly claim the historical rate is inconsistent 😉
If we accept that the San Francisco tide gauge is sinking at 2 mm/year as the GPS data indicates, the total trend is zero, which is indeed inconsistent.
And if you look at their median projection for 2020-2029, it will require that by the end of this decade the tide gauges will show an annual rise of 7.5 mm/year … so it is physically inconsistent.
However, you’re right, almost everything is consistent … seems like I mentioned that … oh, wait, I did:
And gosh, here you are saying exactly that … saw you coming, my friend.
w.
Nope. Each projection has an attached scenario. If the projection comes to pass we can examine the relevant scenario, if that did not also instantiate we can claim an error, otherwise, well not so much.
You genuinely are the gift that keeps on giving.
There isn’t a single scenario where the 2020-2029 San Francisco median projection is even remotely possible. You keep refusing to deal with that.
And the lowest scenario 95% projection requires the annual rise to be 17 mm/year in 2029 … and if you believe that’s possible in the next 8 years, you’re not tall enough for this ride.
They are putting out PHYSICALLY IMPOSSIBLE scenarios as if they were possible, and you are defending it. Madness.
Seems you don’t understand the rate of acceleration required for their scenarios to happen, many of which are far beyond anything ever observed or occurred on the earth.
w.
John Phillips August 12, 2021 1:45 am
John, when their top-end claim is that SFO sea-level rise will be 17 mm/year by 2029, that is absolutely “all over the map”. And I’ve given you the data. How about YOU publish such a plot, rather than asking me to do what you think is important and I think is meaningless give the impossible range of the error bars.
Ah, I see. You’re 100% correct and I was wrong. I was out by a decimal point. But consider:
If the SONEL data and your data are correct, and SF is subsiding at 2 mm/year, then the actual rate of SF sea-level rise is 0 mm/year … which makes the UN estimates far less likely, if less likely is actually possible..
The cherry-picked data starting in 1969 and throwing away 100+ years of data shows that … and since it is NOT statistically significant, you cannot claim that it is anything more than random fluctuations in the data. So no, it is NOT “still acceleration” as you falsely claim. You bust me for not including error bars? Where are their error bars?
That was a chart of acceleration of overlapping 36-year periods of SF data from YOUR link, not from me. It’s FAR too short a length to claim to find acceleration in, and every one of those is NOT statistically significant. Sorry, not impressed.
All the best.
Due diligence
https://www.researchgate.net/publication/260104531_Estimating_Rates_of_Acceleration_Based_on_the_157-Year_Record_of_Sea_Level_from_San_Francisco_California_USA
That’s hilarious. FIrst you post a link to what you call my “history”, which busts me for using empirical mode decomposition to explore sea level acceleration.
Now, you post a link to someone who, just like me, uses empirical mode decomposition to explore sea level acceleration.
And what’s more, they make EXACTLY the same point that your “history ” busted me for pointing out:
That is the exact point that your so-called “expert” dissed me for making … go figure. However, congratulations are in order, because you’ve proved that both you and your “history” are 100% wrong.
However, they have used an entirely different method to remove the datum shift noted by NOAA. As a result, they find acceleration. Me, following NOAA, I adjusted for the baseline shift and found no significant acceleration.
The main problem with their analysis is that they have not given the statistical significance of their findings. Almost no natural dataset is a perfectly straight line. So if you look for acceleration you’ll find it … but is it significant? They’ve ignored this question entirely.
In addition, they’ve entirely ignored the effect of autocorrelation on calculations of significance … but then, since they didn’t calculate significance, that doesn’t matter.
Finally, they’ve used Ensemble Empirical Mode Decomposition (EEMD). This was a good method back in the day. However, this analysis method had a problem: the sum of the parts of the decomposition does NOT equal the original signal. As a result, in modern work this has been replaced by Complete Ensemble Empirical Mode Decomposition (CEEMD), where the sum of the parts always equals the whole.
As a result of not calculating significance and using EEMD, their analysis is fatally flawed.
“Due diligence” indeed …
Regards,
w.
As a result of not calculating significance and using EEMD, their analysis is fatally flawed.
Utterly predictable.
John Phillips August 12, 2021 12:21 pm
100% true. If you don’t calculate significance and you use EEMD instead of CEEMD, it is totally predictable that your analysis will be fatally flawed.
Thanks,
w.
Did you forget? They were also concerned about the examination of just a handful of stations, the base criticism being one of cherry-picking :
Only European and US tide-gauge records are shown. Because these tide gauges are relatively close to the places where most of the ice melt that has driven sea-level changes since ~1900, they will see much less sea-level rise from ice melt than the global mean due to gravity and solid-Earth effects. Therefore, without explicitly taking this into account, we cannot say anything about global sea levels based on records in Europe and North America alone. When all available tide-gauge records are combined to compute global sea levels, a clear acceleration in sea level since 1900 is visible
I am not aware that this charge has been rebutted.
Don’t like EEMD? They got a comparable value using the conventional (coefficient of the quadratic term in a polynomial regression of the second degree) method.
For the entire record, a value of +0.011 +/- 0.003 mm/y2 was obtained for the acceleration and its uncertainty, compared with +/-0.013 mm/y2, using the conventional approach
So mode decomposition is useless when it shows no acceleration but absolutely fine when it does, the IPCC projections for San Francisco are so broad they are consistent with any trend but they are not consistent with the historical trend.
Keep ’em coming 😉
John, in NO case did they discuss whether the acceleration is SIGNIFICANT. Yes, they find acceleration … so what? In one out of the three cases they examined the acceleration was negaive … so what? As I mentioned, ANY natural dataset will have either positive or negative acceleration of some size … the question is, is it significant?
In no case is the acceleration in the SF dataset significant.
w.
Your link whines that “Only European and US tide-gauge records are shown.” In fact, as my post shows, I actually examined ALL the PSMSL records with more than 70 years of data. Yes, most (but not all as they falsely claim) are European and US records, but that’s what we have. I did NOT “cherry pick” anything. I needed long records to demonstrate the problems, and I analyzed every one of them with 70 years of data.
They also say “we cannot say anything about global sea levels based on records in Europe and North America”. Well duh … but then I DIDN’T SAY ANYTHING ABOUT GLOBAL SEA LEVELS. Here’s what I actually said, your reviewer needs to learn how to read.
Note that I was talking about the long-term (over 70 years) datasets. Not “global sea levels”.
You say:
As I mentioned, they have not established the statistical significance of the acceleration. To do that, you have to show that including the acceleration term improves the results in a statistically significant way.
They also have used a curious method to account for the 1897 datum shift noted by NOAA. Since this is at the start of the record, it has a huge effect on the purported acceleration. This is confirmed by the fact that that post-1897 acceleration is not statistically significant.
w.
IPCC projections are so broad that they embrace any trend you care to include.
IPCC projections are inconsistent with the historical trend.
I decline to reproduce my plots with appropriate error bars.
Mode decomposition is fine when it shows no acceleration but absolutely useless when it does.
Nothing I have posted is relevant on a global scale. (I DIDN’T SAY ANYTHING ABOUT GLOBAL SEA LEVELS.)
Genuinely the gift that keeps on giving. Please never stop.
John, I’m going to let this interchange go, for several reasons.
The first is evident in your comment above. Despite my clear request to quote my words if you want to discuss them, you are making up things out of thin air that you pretend I said, and then dismissing them in a most condescending manner. Easy to do when I didn’t say them.
The second is that you have yet to admit that the San Francisco median projections for the 2020s are totally insane and will never come true. And the 83% and 95% quartiles are nothing but fantasy.
This represents a HUGE misrepresentation of reality by the IPCC, one that you keep doing your best to excuse.
The third is that you don’t seem to understand that EVERY natural dataset shows acceleration, either positive or negative, so showing acceleration is meaningless. What counts is whether that acceleration is statistically significant, which is not true of the San Francisco data. I can and I have explained this to you, over and over, but I can’t understand it for you.
The fourth is that you are an arrogant prick. Sorry to be so blunt, but you take joy in finding things that you believe I’ve done wrong, and when you can’t find them you manufacture them out of your sick fantasies.
I’m done with you. You started with interesting issues. I answered them, and since then you’ve done nothing but go downhill.
Talk to someone else. I’m not interested.
w.
Surprised you put up with the fact free chump as long as you did.
Longer than I would have.
Brian, I don’t write for the person I’m writing to. I write for the lurkers. He’s made his mind up. Many of the lurkers haven’t.
But I can only do it for so long, and when it’s no longer fun, that’s when I cash in my chips.
w.
I appreciate that.
I looked at where the “experts” buy their fancy houses with their grant money. Waterfront property, the experts obviously do not believe there is a risk from sea level rise. So I bought an old beach shack scarcely 1meter above the high water.
Willis, I like what you did there with UN Eye PC Sea Level. Creative.
Thanks, Wayne. I’d begun to wonder if anyone noticed.
w.
I did, but figured everyone else did too, so I didn’t say anything.
Thanks.
w.
Barack Obama flew in a bunch of friends on their private jets to Martha’s Vineyard to celebrate his birthday.
He put his multi-million dollar, oceanside mansion in further peril with the release of all that added CO2 into the atmosphere.
The stuff horror films are made of.
From the article: “Bear in mind that this is the result of “a formal, calibrated method of combining quantified expert assessments that incorporate all potential processes”. Doesn’t that make you feel all warm and fuzzy about the rest of the UN IPCC AR6 claims?”
The IPCC report is such a joke!
All they had before was pure speculation. No evidence. Now, the only difference is their pure speculation is being presented as established fact.
That’s not going to work on the skeptics. We know the difference between speculation and evidence. Any logical person can tell the difference.
Tom Abott: “Any logical person can tell the difference”.
WR: An important difference between speculation and evidence is the search for ‘quantity’ instead of the search for ‘quality’. Quantity does not say anything about the quality of the content. Let alone about evidence.
There are several viable ways they could end up being right…
1) They already are experts at modifying data – all they have to do is combine the sea level rise data with something that will make it look larger, so possibly a river or lake level rise (taken in the Spring).
2) They can still adjust the length of a millimeter that is only used when describing sea level rise.
3) They can claim mm means something different, so just like option 2 but completely different.
4) They can just keep spewing nonsense until everyone forgets about their sea level increase prediction and then in 10 years they can claim they were right (but not using any specifics so no one knows what it was they were “right” about).
I’m reminded about the “story” somebody tells in the movie “Tin Men,” where one aluminum siding salesman employed a yardstick with six inches cut out from the middle of it, and would hold his hand over the break when taking the measurements used to “price” the siding job.
The really sad thing is, I wouldn’t put something like that past the alarmists – they will truly go to any lengths to push their mass lunacy.
Great movie! Particularly liked the $10 drop to test the honesty of the mark.
Is there a direct link to the IPCC AR6 Sea Level Projection Tool? I love contrasting the WAG of predictions by the alarmist cabal with measurements of the real world to my friends who have inadvertently drunk the Kool-aid and let them see for themselves the fantasies concocted by the cabal to deceive the gullible. There is no more convincing proof that, as former President Trump said, global warming is the biggest hoax ever perpetrated.
NOAA Sea Level Tends
https://tidesandcurrents.noaa.gov/sltrends/
My bad, thought I’d put one in. I’ve edited the head post to include it, thanks for the heads-up.
It’s here.
w.