By Christopher Monckton of Brenchley
The New Pause has lengthened by another two months. Even though the brief la Niña that began in late 2020 has now ended, on the UAH dataset there has been no global warming for 6 years 6 months till July 2021. As always, the Pause is calculated as the longest period ending in the present that shows no warming trend, taken as the least-squares linear-regression trend on the UAH satellite monthly global mean surface temperature anomalies for the lower troposphere:

On the HadCRUT4 dataset, the New Pause is ten months longer, at 7 years 4 months:

As Table 1 shows, the mild la Niña that has now ended has lengthened the Pause with remarkable rapidity since I first reported it for the period to the end of December 2020. It has lengthened by an average of two months each month:
The New Pause may shorten from now on until the end of this year, when it may lengthen again if the la Niña conditions predicted for this winter indeed manifest themselves.
In last month’s column, I showed Chris Schoeneveld’s graph of the succession of Pauses which, taken together, drove the global warming of the past century or so. The graph shows that each Pause commenced with a larger-than-usual el Niño Southern Oscillation. The y axis was incorrectly represented (which was my fault). Here is the corrected version.

I hypothesized that there might be some causal connection between subsea volcanic activity in the tropical eastern Pacific (where three limbs of the mid-ocean tectonic divergence ridges meet and diverge at a rate an order of magnitude greater than anywhere else in the world) and the el Niño pattern.
John Tillman, WUWT’s resident el Niño expert, disagrees with this hypothesis. On my own, I should hesitate to question that formidable expert. However, Professor Arthur Viterito has been in touch. He has been investigating the subsea-volcanic hypothesis for some years. Here is his map of the mid-ocean divergence ridges, showing the exceptionally rapid rate of divergence in the tropical eastern Pacific, the seat of the el Niño southern oscillation:

Sure enough, Professor Viterito finds a correlation between seismic frequencies in areas of high geothermal flux and global mean surface temperatures:

It is above my pay-grade to determine the extent to which the correlation is causative. However, the sub-ocean seismicity that showed a pronounced increase from 1995 onward is now showing a decline again. If, therefore, the correlation is causative, it may contribute to less rapid warming in the coming decades. What is more, the spikes in sub-ocean seismicity in 1996-7 and 2013-4 were both followed by unusually large el Niño events:

As Ballarotta et al. (2015) point out:
“Although the ocean is largely heated and thermally driven at the surface, several recent studies suggest that ocean geothermal heating can also affect the ocean dynamic and heat budget… By applying spatially constant or variable heat flux in ocean general-circulation models forced with the present-day climate, it is shown that ocean geothermal heating is a significant forcing that can weaken the stability of the water column, warm the bottom water and strengthen the thermohaline circulation…”
As Willis Eschenbach has said in a characteristically brilliant recent column, one of the greatest falsehoods perpetrated by the Thermageddonites is that we can’t account for recent warming except by blaming it on the hated capitalist West and its sins of emission. He put it much more gently than that, for, unlike me, he is never rude, even intentionally. As Willis points out, there are many small perturbations of the climate, each of which could have a large enough influence on temperature to account for most or even all of the ~1 K observed warming in the industrial era.
For instance, the tiny reduction in albedo from 1984-2001 drove a positive forcing greater than the entire anthropogenic forcing over the period (Pinker et al. 2005; Monckton of Brenchley 2011). It was this fact that led the Chinese leadership to realize that global warming is not, after all, a problem, though they are content to exploit it as though it were.
The Stefan-Boltzmann equation (below) shows that emission temperature R0 is a function of total solar irradiance S = 1363.5 W m–2, albedo α2 = 0.294, emissivity ε = 0.94 and the Stefan-Boltzmann constant σ = 5.6704 x 10⁻⁸ K W–1 m2, so that the emission temperature R0 is equal to 259.2 K. Reducing albedo by just 0.01 to 0.284 would raise surface temperature by 1 K, after allowing for the increase in emission temperature and in its feedback response.

But has temperature risen by as much as 1 K since 1850, as HadCRUT5 would have us believe? Connolly et al. (2021), in a comprehensive and fascinating review of the temperature and solar-irradiance datasets, have concluded that the surface-temperature datasets continue to be contaminated by the urban heat-island effect. Using standard weighting, they find that rural northern-hemisphere stations show a warming of only 0.41 K/century from 1841-2018, a period northern-hemisphere trend of 0.7 K, equivalent to about 0.6 K globally, compared with 0.91 K (HadCRUT4) and 1.04 K (HadCRUT5) from 1850-2018.
What is more, by studying 16 solar irradiance datasets and identifying the best fits to northern-hemisphere temperature datasets, Connolly et al. conclude that between none (Svalgaard) and almost all (Hoyt & Schatten) of the global warming from 1850-2020 might have been caused by solar variability alone, depending on which irradiance dataset one uses:
“IPCC AR5 appears to have tried to overcome this problem by ignoring those datasets that give conflicting results. Worryingly, from Matthes et al. (2017), it appears that the CMIP6 modeling groups have been actively encouraged to consider only one estimate of TSI for the period 1850-present: i.e., the Mathes dataset. In terms of scientific objectivity, this seems to us to have been an approach that is not compatible with the results already published in the scientific literature and even unwise relative to the results highlighted by this paper and other recently-published works …
“We urge researchers … to consider a wide range of TSI estimates and not just ones that agree with the researchers’ prior beliefs or expectations; … to pay more attention to the scientific debate between the rival TSI satellite composites and to consider the competing datasets when assessing solar trends during the satellite era; … to look more carefully at the differences between the various estimates of Northern Hemisphere temperature trends … in particular, we caution that despite many claims to the contrary … the urbanization bias problem does not appear to have been satisfactorily resolved yet; … we also encourage further research into the potential Sun/climate relationships; … we encourage further research into the role of other possible natural factors which do not necessarily have a solar component on recent climate change …
“In the title of this paper, we asked How much has the Sun influenced Northern Hemisphere temperature trends? However, it should now be apparent that, despite the confidence with which many studies claim to have answered this question, it has not yet been satisfactorily answered. Given the many valid dissenting scientific opinions that remain on these issues, we argue that recent attempts to force an apparent scientific consensus (including the IPCC reports) on these scientific debates are premature and ultimately unhelpful for scientific progress. We hope that the analysis in this paper will encourage and stimulate further analysis and discussion. In the meantime, the debate continues.”
And all that is before considering the many other natural influences that may well have contributed to global warming.
One of the many commendable features of Connolly et al. is that solar physicists on both sides of the climate question co-authored it. It is a fair-minded and balanced presentation of the evidence. IPeCaC, whose latest gaseous halation is due to be published early next week, has consistently failed to achieve that.
Meanwhile, the Fagradalshraun shield volcano, the first in Iceland in about 8000 years, has emitted about a million tons of CO2 in the past four months. Tut tut!

Finally, since the ever-more-ludicrous government of Boris Johnson has abandoned every Conservative and conservative principle and has swallowed the global-warming nonsense hook, line and sinker, it is limbering up for a mighty grandstanding at the October UN gabfest in Glasgow. Here, then, is the temperature record for Glasgow over the past couple of decades: hat-tip to my distinguished co-author Alex Henney. You can be quite sure that the unspeakable BBC and the now-unreliable Economist will somehow fail to report the surely not uninteresting fact that there has been no warming in Glasgow for 22 years.

Mr. Monckton, can you please provide the uncertainty of the calculated trend?
This is rich…
Yes, tor Weekly_rise to ask for the uncertainty of the calculated trend is apparently hypocritical. However, it may indicate that he has learned something.
It is a worthwhile hope…
The uncertainty of the temperature trend is the uncertainty of the temperature measurements. I am sure you can get that yourself for UAH and HadCRUT4.
The one for HadCRUT4 is here:
https://www.metoffice.gov.uk/hadobs/hadcrut4/data/current/download.html
“The uncertainty of the temperature trend is the uncertainty of the temperature measurements.”
AGAIN? This is NEVER true. In practice, for any statistically/physically significant trends w.r.t. climate evaluations, it is a tiny part of trend uncertainty. Trend uncertainty is dominated by standard deviation of the expected values of the data points, from the trend, but the standard error of the trend is calculated separately.
This is a special case, I think. Lord Monckton is arguing that there is no trend not that there is a trend. And he is arguing the lack of trend in the data exclusively for the past 6 years. For him to be wrong there would have to be a trend in the data for the past 6 years.
A trend with the expected value of zero, is as much a trend as any. All of the statistical methods built up for the last 200 years apply. And of course monthly data for the last 6 years is neither physically or statistically significant w.r.t. climate evaluations, so, as another poster put it, So what?.
The “trend” of a time-series is the slope (m) of the regression line and is used as a predictor of the dependent variable, temperature, using time as the independent variable. That is how the predictions of year 2100 temperatures are derived, from extrapolation of the regression-line equation.
When the slope (m) is zero, there is no predictive value to time. All cats become black in the dark! More formally, the equation:
y = mx + b reduces to y = b for all measurement times. One cannot algebraically invert the equation and obtain a date from the constant temperature. There is no “trend,” temperature becomes a constant.
As a Rule of Thumb, samples of 20 or 30 are usually statistically significant. Six years times 12 months gives 72 samples. Thus, the samples can give reliable means and standard deviations, etc. even though there is no trend. Indeed, when dealing with a non-stationary time-series, the only way to keep the mean and standard deviation constant is to de-trend the data. That will provide a better estimate of the inherent uncertainty of the measurements than with data that adds the trend to the SD.
“When the slope is zero, there is no predictive value in time”.
True. And? The data used to find a slope of zero can be statistically evaluated as easily and usefully as any other.
Your ROT might be often correct, but it is useless w.r.t. climate data. Anything less than 30 years is pretty much FOS. Too much going on in the real world to draw any non biased conclusions from.
For Mr. Monckton to be wrong in his claim that there has been no trend, or a negligible trend, or a cooling trend, he needs to demonstrate that the uncertainty in the calculated trend precludes any substantial warming trend.
I’ve done this exercise in the past to calculate the uncertainty of the annual trends for the UAH dataset:
The uncertainty in the trends doesn’t allow you to rule out the trend of ~1.3 degrees per century since 1979 for any interval, so it would seem to be impossible for Mr. Monckton to substantiate the claim that there is a pause. And while the calculated trend since 2015 is indeed negative, the uncertainty for this time period allows for a trend as high as 6 degrees per century.
Correction: “For Mr. Monckton to be wrong” should be “for Mr. Monckton to be right.”
The assertion that there is a Pause is derived straightforwardly from the data in the manner described in the head posting. On the HadCRUT4 data, there has been no global warming for more than seven years.
Unfortunately, simple and straightforward conclusions based on complicated data can often be misleading. I do not see anywhere in the head posting where you have provided uncertainty estimates for the calculated trends. At least for UAH, the uncertainty for such a tiny time period is far too large to draw a meaningful conclusion.
Just to be pedantic…there has been no global warming over seven years per HadCRUT4 and via the methodology defined in the head post only.
But…had oceanic heat content been used instead there would be a very different result. And since OHC represents 90% of the heat uptake of the climate system it is by far a better metric for assessing global warming than HadCRUT4 which represents less than 1% of the heat uptake.
This dead dog still won’t hunt…
When has a dead dog ever hunted? And I believe the paraphrase “You can’t teach a dead dog new tricks” should apply…
In any event, I am glad people have rediscovered the meaning of uncertainty given the entire global warming argument is based on seriously flawed computer models using hundreds of constants and variables where many have no useful error-of-margin and are used in a repetitive algorithms to make untestable predictions.
(Getting more popcorn)
It is my recollection that the “that dog don’t hunt” phrase is Clintonian.
The uncertainty of the temperature measurements includes both the error in reading, and the internal variability of global temperatures. However, if there is also a trend, which is typical, then one has to calculate the probable values of the slope to find an uncertainty range of the slope. Slope isn’t just a single number! Below is a link to a way to calculate the slope uncertainty with Excel:
I do this quite often. And you almost as often deflect from my evals to wind away on fact free homilies about how the data shouldn’t be evaluated this way.
Since you brought up excel, you should evaluate some actual distributed climate data to see how very little the distribution of monthly values matters to the standard error of trends – that number right below the expected value of the trend in the matrix solution – over physically significant time periods. You can do this by either using statistical laws to change the standard error of the trend according to the data variances, or by brute forcing thousands of evaluations using random samples of distributed values, and then checking out how the standard error of the trend has increased. Hint: Hardly at all,,,
One thing to keep in mind is that the standard error of the trend is most analogous to precision error. It does not include accuracy error that may arise from systematic biases that might skew the trend. For example, the standard error of the trend from the UAH dataset is only ±0.0065 C/decade, but Christy 2000 documents the final uncertainty as ±0.06 C/decade using a more rigorous analysis. Assuming this uncertainty is still valid through 2020 that means the 95% CI of the +0.14 C/decade trend is actually +0.08 to +0.20 C/decade.
Yes: just read the head posting, where the published uncertainties for HadCRUT4 are shown on the graph.
I may be going blind, but I cannot see any uncertainties indicated on any of the graphs.
There was cooling between 1940 and 1980 but the graph of succession between El Ninos does not clearly show it….CO2 went up and the temp went down slightly.
Well done, CMoB!
[send in the watermelons…]
So, I would have to say that I expect CO2 to cause warming. HOWEVER, unlike people who freak out over it I believe it has been overly hyped based off of the data I have been looking at over the course of the last 30+ years I have been paying attention.
That said, I think that it hurts the cause of being skeptical to ignore that SOME warming is occurring due to increased CO2, especially at night time temperatures, nor that it may be responsible for ‘changes’ in climate, albeit not the kind that the IPCC and others are saying.
This is the fine line of a skeptic. I am skeptical of the extreme assertions of those that are fear mongering.
That said, this would agree with at least some of the science suggesting there is both an energy imbalance and potentially a rising sea temperature is outheating ( yes I made up a word ) during la nina.
<shrug> of course this is pure conjecture. There are additional issues, namely I disagree with the messing up of temperature data, I disagree in some parts with BEST, though I do not have the time nor funding to prove that they got it wrong.
Mosher claims that the Urban Heat Island effect is negligible and doesn’t influence weather station networks.
However, these Landsat 8 OLI themographs tell a different story:
https://scitechdaily.com/heating-up-in-tokyo-challenging-temperatures-confront-athletes-competing-in-the-olympic-games/
Compare the ground temperatures in Tokyo to the vegetated areas to the east.
I am willing to believe that CO2 *can* cause some warming…but now explain how do we tell how much came from CO2 and how much from something else? How much is land use and how much is entirely natural? So until someone explains how to measure it, it remains just a hypothesis. And it is evident that the magnitude the alarmists use is completely unrealistic.
Desperately waiting for an El Nino.
https://rclutz.com/2021/05/08/adios-global-warming/
Is there an easy relationship between UAH and lengthening of the pause ie will a 0.1 C drop equal 3 months at the moment?
The Intergovernmental Panel on Climate Change (IPCC) is scheduled to release its next report, the Working Group I contribution to the Sixth Assessment Report (AR6), on 9 August 2021.
One can’t help but wonder if this report will:
(a) totally ignore the 6.5 year “New Pause” in global warming discussed above that is based on UAHv6 data and confirmed by HadCRUT4 data,
(b) acknowledge the data, but argue that it must be wrong because it does not agree with their composite comparisons of climate models (CMIPxx) that have been “refined” over the last 25 years or so, or
(c) assert that “yes, this is clear evidence that our calls for reductions in human-originated CO2 emissions are starting to take effect”.
How very inconvenient for this data to appear now . . . the IPCC Working Group I has less than a week to come up with a plan. Meanwhile, I’ll be ROTFLMAO.
Whatever the situation the report offers, it will be WORSE THAN WE THOUGHT!
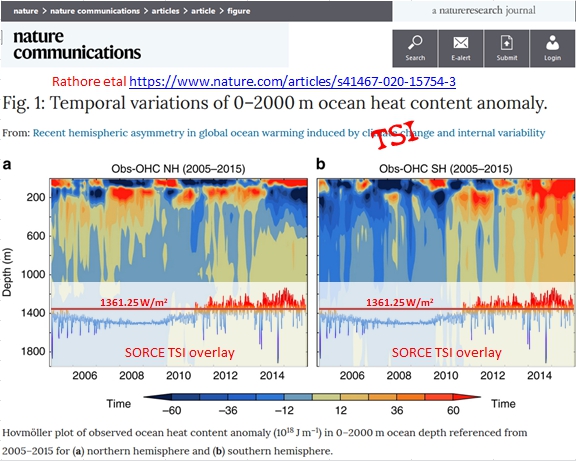
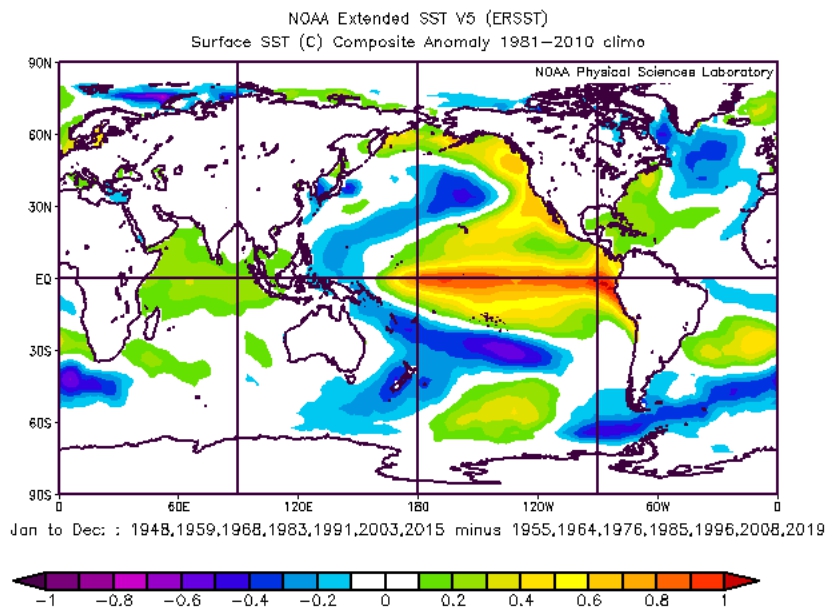
Christopher Monkton the El Niños you speak of originated in the western to central Pacific and were TSI driven. I predicted the solar influence for 2014-16 back on June 23 2014.
Secondly the tropics exhibits solar supersensitivity to TSI variations. Direct TSI forcing of the tropical ocean during the last solar maximum:
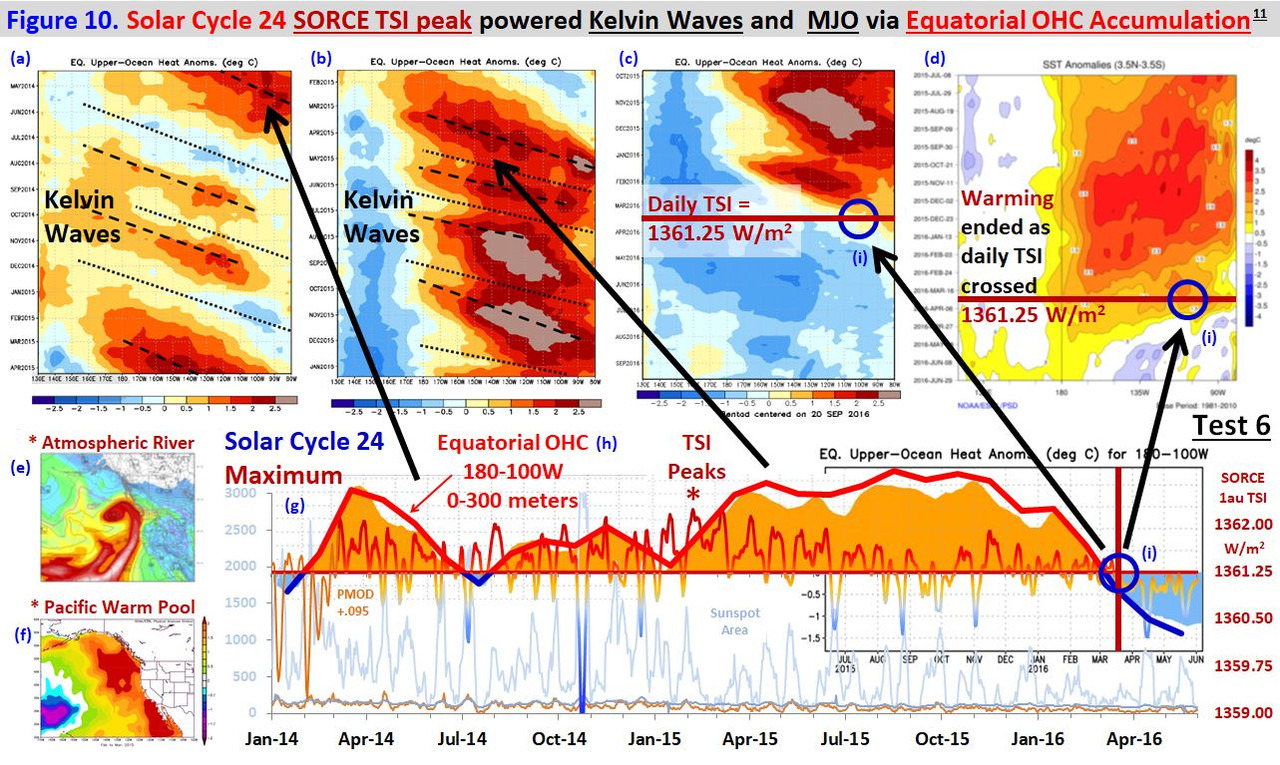
Full ocean TSI forcing during the last solar cycle:
The effect of solar maximum TSI vs solar minimum TSI:
Furthermore you rely on the Connolly paper with the obsolete Hoyt/Schatten TSI model.
I think the Svalgaard solar model is going to be the future of TSI models, ie solar cycles with a fairly invariant solar minimum TSI floor; it’s just going to take time to be accepted. I use a similar TSI model for my work and can show an overwhelming solar influence on the climate just from changes in solar activity alone.
Without disputing your work, I think it is worthwhile to always keep in mind that numbers such as 1361 W/m2 are in fact an annual average because solar radiation is modulated by the Earth-Sun distance variation by 2-3%, or 30 – 40 W/m2.
Is that the reason why global temperature clearly has an uptick in NH summer?
Cause the seasons are due to the axial tilt.
The NH has more land than the SH. That is why global temperatures reach their annual peak in the NH summer.
Mr Weber has not perhaps read Connolly et al. (2021). It is a very fair summation of some 16 total-solar-irradiance datasets, of which the Hoyt & Schatten and Svalgaard datasets are at opposing extremes.
Mr Weber is entitled to place all his faith in just one of those 16 datasets, just as IPCC does. But grown-up scientists, such as Connolly et al., reasonably point out, as cited in the head posting, that it is better to bear in mind all the datasets and, therefore, the possibility of a significant solar contribution to the temperature change of recent decades.
The question merits asking once again: “Who turned off the CO2?”
CO2: “Zzzzzzzzzz….”
El Nino: “I’m here!”
CO2: “Huh!? Oh, time to get to work and catch some photons.”
[set greenhouse_effect = true]
CO2: “Ay, caramba it’s getting hot! Time for a siesta”
[set greenhouse_effect = false]
CO2: “Zzzzzzzzzz….”
That is why it is important to rigorously account for uncertainty ranges and the number of significant figures used in the factor in a calculation.
Three significant digits for albedo is a pipe dream, two is typical.
The thing is, the albedo (which term I dislike as being inaccurate) is not a single physical constant. Rather, it varies from moment to moment and the only way to properly deal with it is to show a 2-sigma range of variability and to have that reflected (if you’ll pardon the pun) in subsequent calculations as an uncertainty.
Agreed. It also varies over wavelength quite a lot, especially for ground reflectances.
If one is pointing out the impact of a small change in albedo, one need not worry so much about uncertainty in the starting value.
Well, I use the data as they are reported, and the source for albedo said it was 0.294. Since albedo is an input datum, I deploy it to the maximum published precision, as any scientist does.
The low solar wind magnetic activity does not favor a strong La Niña because the latitudinal wind is weaker. However, a weak La Niña and low solar activity will result in less heat accumulation in the equatorial Pacific.
http://www.bom.gov.au/archive/oceanography/ocean_anals/IDYOC007/IDYOC007.202108.gif
For 30 years, the Sun has maintained high activity, which has encouraged the accumulation of energy by the oceans. The trend was clear, now reversing in the other direction. Those models that relied on data from the previous 30-plus years are now out of date.
That’s the actual state of Niña 3.4
Current temperature anomalies in South America and Australia.

It’s simple enough. We have just popped our heads up from beneath a 10-month long period of naturally cooling La NIna conditions and already the global temperature anomaly for July is approaching record warm levels. 5th warmest in the UAH record. And that’s in the early stages of ENSO neutral conditions.
It’s a pretty good bet that by the time even a moderate El Nino swings around we’ll be seeing new record high global temperatures.
Look at that
El Niño or La Niña ? 😀
TheFinalNail may well be right that the next el Nino will give us another temperature that is above anything since 1850. However, the succession of long Pauses is an effective and simple visual demonstration of the fact that the rate at which the planet is warming is between a third and a quarter of what IPCC had originally “confidently predicted” in 1990.
Obsession with “new temperature records” mere hundreds or thousandths of a degree above the previous record is very silly, and is leading to bad policymaking. A maturer approach would look at the data, realize that the world is warming far more slowly than originally predicted, and ask what it was that the models had gotten wrong.
You get an El Nino, there is a sudden temperature rise (after the event) and then temperatures stay approximately stable until some other random El Nino raises the baseline again.
Someone please explain this to me? How can CO2 gas act so selectively? Why does the El Nino raise temperatures after the event is past? Why would temperatures be stable for years and then suddenly jump after the El Nino?
It seems to suggest that the Sun cannot be behind the rise in temperatures as it has no way of being coupled with the El Nino event and aftermath. As far as I know, a gas doesn’t act this way either…it would raise the temperature gradually as concentration is increased – *IF* it hasn’t already saturated any effect it has. It would seem to suggest something is going on in the oceans, but what? I do not believe volcanoes would behave this way either so I can forget that angle.
It reminds me of a bucket that is collecting dripping water (slowly), and once reaching a certain point the buckets pivots around an axle to dumps it’s contents and then starts collecting again.
None of this El Nino permanent warming makes sense to me.
It doesn’t make sense to climate scientists either, which is why they don’t accept the hypothesis. It’s an idea based on the premise that the ENSO system only adds heat to global surface and lower troposphere temperatures. As the name suggests, it’s an ‘oscillation’. ENSO causes both temporary increases and temporary decreases in surface and LT temperature. These are above and beyond the influences on temperature of increasing CO2 or solar variability.
The reason ENSO raises or lowers temperatures after the events have passed (or after they have started, at least) is due to various lags in atmospheric circulation. Basically, it takes a while for the effects to filter out globally. Longer in the satellite data than in the surface, by the way. Usually it’s 5-6 months before ENSO changes show up in TLT data; more like 3-4 months in surface. Just like peak summer temperatures in the northern hemisphere are usually felt in July or August, even though most sunlight is striking the region in mid-June.
TheFinalNail is perhaps unfamiliar with the vast heat capacity of the ocean. There is a correlation, which is possibly but not necessarily causative, between subocean seismicity and temperature, as shown by Professor Viterito. The hypothesis could be quite readily tested by monitoring of ocean-floor temperature along the divergence ridges that meet right at the center of the Nino 1-2 region. What is sad about the current state of climate science is that the childish insistence on only one factor in global warming prevents proper testing of hypotheses such as that of Professor Viterito.
If the el Ninos are substantially caused by subocean volcanism – and I stress if, for this is a hypothesis and not a fact – then it is perfectly possible that as the ratio of el Nino to la Nina increases the ocean will slowly accumulate heat, releasing it to the atmosphere and causing a rising trend in global temperature overlain upon the oscillation.
The nervous defensiveness with which the Thermageddonite trolls here have reacted to Professor Viterito’s theory suggests that they are very much hoping he is wrong, because if he were right then some fraction of recent warming might not, after all be attributable to sins of emission by the hated capitalist West.
A true scientist, on learning of that theory and on seeing the outline of the evidence for it that is given in the head posting, would be intrigued enough to hope that the hypothesis will be tested, which would not be a particularly complex or expensive task.
Instead, there are shrieks of terrified fury from the climate extremists. And the shrieking is most revealing.
“… However, the sub-ocean seismicity that showed a pronounced increase from 1995 onward is now showing a decline again. …”
—
I’m very suspicious of this and do wonder if it’s more related to the advent of “Windows95” in Aug 1995, and that people and science organizations the world over, suddenly invested in modems and internet connections, and commonplace global data-sharing from about mid-1995 forwards. Yes there was academic internet connection long before this, but it was very much a niche and isolated capability, and the exception.
After 1995 internet connection and open data-sharing became routine.
Surely you aren’t suggesting it is a spurious correlation! 🙂
Can someone show the full citation for “Connolly et al. (2021)”. Thanks…
http://www.raa-journal.org/raa/index.php/raa/article/view/4906/6081
Thanks…
A statistically significant structural break must be detectable to claim a Pause. You won’t find one.
All that is necessary to demonstrate a Pause is to show the absence of any trend in the monthly temperature anomalies for a sufficiently long period to be interesting. That absence is demonstrated in two datasets – one terrestrial and one lower-troposphere – in the head posting.
The only requirement to demonstrate a Pause is that there should be a sufficient period during which the least-squares linear-regression trend on the monthly temperature anomalies is zero. That demonstration, for two distinct datasets, is given in the head posting.
How do you statistically define a “sufficient period”?
For myself, I think I’d want to at least demonstrate that the pause was significantly different to the previous trend, or that it had had a significant effect on the overall trend.
It would also be useful if the pause trend joined up with the previous trend, rather than show a sudden jump in warming.
Bellman wrote at the beginning of this series that 6 years would be significant. It’s more than six years now.
The main point is that global warming is a lot slower than originally predicted. There’s a good reason for that.
You’ve made that outrageous accusation before, yet still fail to provide a link to where I’m alleged to have said it. I’ve skimmed through your first post and haven’t found anything that resembles such an ignorant claim, on the contrary I’m often pointing out how much longer periods are not significant.
For the avoidance of doubt the sentence “6 years would be significant” is meaningless in a statistical sense. It’s possible that a trend could be statistically significant over such a period, it depends on the amount of variance in the data and the strength of the trend, but that does not mean that all 6 year periods are statistically significant. I would also say that in the scheme of things even a statistically significant 6 year period would not mean much – all you are saying is it’s unlikely you would see that much warming by chance, but that says nothing about what caused the warming, e.g. a big El Niño, or about what impact it will have on the long term trend.
In any event, you cannot call the non-trend of the pause statistically significant unless you define the null-hypothesis, something you continually fail to do.
Here’s the graph I used in April to illustrate the meaninglessness of 6 year trends – they’ve ranged anywhere from -5°C to + 10°C / century.
Doesn’t look like I’m going to get an explanation or an apology for this accusation. I still haven’t found any comment where I said 6 years would be significant. In fact in this comment
https://wattsupwiththat.com/2021/02/03/the-new-pause-lengthens-from-5-years-4-months-to-5-years-6-months/#comment-3176643
I specifically say that 15 years may not be significant, and point out that his pause isn’t even 6 years old.
Maybe this is the comment Monckton means, and he just hasn’t read it properly, but who knows?