
Photograph of a dust storm captured in the Texas Panhandle during March 1936. When the drought and dust storms showed no signs of letting up, many people abandoned their land. The Dust Bowl exodus was the largest migration in American history. By 1940, 2.5 million people had moved out of the Plains states of which 200,000 moved to California. Credit: Arthur Rothstein, Public domain, via Wikimedia Commons
Paul Dorian
Overview
One of the most widespread and destructive heat waves ever recorded in the US took place in the summer of 1936 which fell right in the middle of arguably the hottest and driest decade ever for the nation. The decade of the 1930’s is renowned for the “Great Depression” and the “Dust Bowl”, both of which caused calamitous human suffering in this country. Not only were huge numbers of crops destroyed by the heat and lack of moisture in the “Dust Bowl” era, but thousands of lives were lost as a result of the heat, drought and economic hardship. This extreme heat wave was particularly deadly in high population areas where air conditioning was still in the early stages of development. The heat wave experienced in 1936 began in late June, reached a peak in July, and didn’t really come to an end until September. Many of the all-time high temperature records that were set in the 1930’s in numerous cities and states still stand today. Perhaps the hottest day ever recorded in the US took place on July 14th in 1936 when the average maximum temperature was 96°F and 70% of the US was over 90 degrees.

All-time city records (left, courtesy NOAA);
All-time state records (right, courtesy wunderground.com).
Note – the all-time high temperature record of 111°F in Pennsylvania was actually set on both July 9th and July 10th in Phoenixville (Chester County) during this heat wave.

Distribution of state all-time high temperature records on a decade-by-decade basis with the highest number in the 1930’s. Source: NOAA/NCDC
Discussion
The “Dust Bowl” years of 1930-1936 brought some of the hottest summers ever to the US; especially, across the Plains, Upper Midwest and Great Lakes in arguably the hottest decade on record for the US (source 1, source 2). In addition, there were a series of droughts in this time period which ruined crops all across the Plains where, for example, lush wheat fields became unproductive waste lands. The suffering in the “Dust Bowl” era was brought to life at the end of the decade in the book written by John Steinbeck called The Grapes of Wrath which follows the migration of a poor family of farmers from drought-stricken “Dust Bowl” farmlands to the state of California. The relentless drought across the central Plains during these “Dust Bowl” years contributed in a “positive feedback” fashion to the excessive heat by allowing the sun’s energy to be used almost exclusively in the heating of the ground and lower atmosphere without much energy loss at all in the evaporation of soil moisture.

An amazing loss of life due to the widespread and destructive heat wave in July 1936 (Courtesy “The Bend Bulletin” newspaper (Oregon))
The worst of the extreme heat in the summer of 1936 took place during the middle part of July. In the week that ended on July 18th, thousands of lives were lost due to the extreme heat and relentless drought conditions across the nation. High temperatures of 100+ degrees (F) were widespread in this time period and numerous cities and states set their all-time high temperature records which still stand today (including in the Mid-Atlantic states of Pennsylvania, New Jersey and Maryland).

Buried machinery in barn lot in Dallas, South Dakota, United States during the Dust Bowl, an agricultural, ecological, and economic disaster in the Great Plains region of North America in 1936. Only one-fourth of normal rainfall fell that summer, ruining crops and pastures. The heat wave accompanied a drought that covered much of the Midwest and Plains until scattered rainfall finally broke through on Aug. 28.
A few examples of the extreme heat that peaked in the Northern Plains and Upper Midwest on July 14th, 1936 included 112°F near Chicago, Illinois, 108°F in Minneapolis, Minnesota, and 110°F in Bismarck, North Dakota. In Minneapolis, the high temperature record set on July 14th still remains today as the highest ever recorded there and the heat caused 51 deaths in St. Paul alone on that particularly deadly day (source).

The front page of the July 13, 1936, issue of the St. Paul Daily News
The Mid-Atlantic region wasn’t spared in this widespread extreme heat wave with high temperatures on July 14th of 104°F in Philly and Washington, DC. In fact, the highest temperatures ever recorded in New York City (106°F) and Baltimore, Maryland (107°F) were set on July 10th, 1936. Even as far away as Toronto, Canada, temperatures reached 100°F and the reported death toll there for the heat wave was 225, the biggest spike in the city’s death rate since the 1918 flu pandemic (source).

Image from the July 14, 1936 Toronto Evening Telegram showing “Birch Cliff” neighborhood residents sleeping outdoors

Another newspaper headline on the deadly heat wave in mid-July (July 14, 1936)
Even in the latter stages of July in 1936, there were some absolutely amazing temperature readings as the relentless extreme heat continued in many areas. For example, a minimum temperature of 91°F was reported at Lincoln, Nebraska on the night of July 24-25 and the daily high on the 25th reached 115°F – still an all-time high temperature record. It is worth noting that the “urban heat island” effect did not have the unnatural warming impact on overnight low temperatures experienced in many spots in today’s world. In August of 1936, the extreme heat shifted a bit southward and four southern states set their all-time high temperature records that still stand today (Arkansas: 120°F, Oklahoma: 120°F, Texas: 120°F, and Louisiana: 116°F). (Data Sources: Wikipedia; wunderground.com)

1936 – Year of extremes
Interestingly, the exceptionally hot summer of 1936 actually followed one of the most severe cold waves in US history and some of the same regions that experienced the deadly summer heat suffered through the winter bitter cold (e.g., Northern Plains). The climatological summer (June-August) of 1936 was the warmest nationwide on record (since 1895) with an average temperature of 74.6°F (2nd warmest summer was that of 2006 with an average of 74.4°) and July of 1936 was the single warmest month ever measured with an average of 77.4°F (beating out July 2006 by 0.1°). Ironically, February of 1936 was the coldest such on record for the month with an average nationwide temperature of 26.0°F (single coldest month on record was January 1977 with a 23.6°F average).

In February of 1936 temperatures fell as low as -60°F in North Dakota, an all-time state record and Turtle Lake, North Dakota averaged -19.4°F for the entire month, the coldest average monthly temperature ever recorded in the US outside of Alaska. One town in North Dakota, Langdon, went for 41 consecutive days below zero (from January 11 to February 20), the longest stretch of below zero (including maximum temperatures) ever endured at any site in the lower 48. (Source: wunderground.com)
Meteorologist Paul Dorian
Peraton
peratonweather.com
Follow us on Facebook, Twitter, YouTube
Yabut, that was just weather. Today we have dangerous, planet-destroying “Climate Change”!
I wonder what the annual agriculture production stats were that year. I’ll check back if I find some data.
With all these high temp records still on the books, how dare the Alarmists try to claim the hottest anything!
Because they report averages, see the NOAA chart below.
Really? when the temperatures this year and in the last 5 years actually ARE records?
You mean the record colds this spring?
Give it up Griff.
As detailed here and elsewhere, the weather is not doing anything now that it has not done before – hot, cold, windy, calm, rainy, cloudy, clear, snowy, etc, etc – you name it, it’s been happening somewhere and will keep on happening just the same.
Ha! There is Griff and then there is reality:
https://apis.mail.aol.com/ws/v3/mailboxes/@ur momisugly.id==VjN-8CHMr1NfEq1OI1JyWcEENz33Gf16NfYukEPnMi8M2pmZbM0Vcp6kvXW9pKW3KOPUyqtsdt-jko-uK0ko8KHOrw/messages/@ur momisugly.id==AOEoBQsI5r-xYOr-gAMomGUI4TM/content/parts/@ur momisugly.id==2/thumbnail?appid=aolwebmail&downloadWhenThumbnailFails=true&pid=2
We have rain records at the moment, a summer as in the colder 70ies 😀
Some pictures
The global averages are moving upward largely because the nighttime lows and wintertime highs are moving upwards. However, the daytime highs of the 1930 are unmatched by today’s highs! The 1930s were truly ‘unprecedented’ and the levels of CO2 were low.
If there are such changes, hot records and cold records in short times, a coming cooling is to fear, the “wished” warming by CO2 is a steady one, not considereing ENSO / El Niño.
More spikes in both directions indicate a coming change with o CO2 connection.
”a coming change with o CO2 connection.”
with a… without a…. Which oneadeeze?
Griff, how long is your record?
Doesn’t really matter as it is stuck.
At the same time those supposed record high temperatures were being set in the Northwest, the rest of the country was substantially below average in temperature.
The warmunists never mention that part.
Liar.
griff will be along shortly to explain that back in the thirties they only had inaccurate analogue thermometers, people were too short to read said thermometers in stevenson screens, therefore they were always looking up at them and didn’t account for the parallax error, AND they read them by the light of oil lamps thereby introducing extra heat. Did I miss anything grief?
I’m sure the 30s had reasonably accurate measurements.
The issue is the continued and frequent record weather now, in the last 5 years and in the next decade. clearly warming, clearly intensifying, clearly a problem.
‘It happened in the 30s’ does not trump ‘look how often and how intensively it happens now’
Last 5 years: Super El Nino. You need to polish your crystal ball.
You do know that the energy released to the atmosphere by an EN has a lag of around 6 months at best (on tropospheric temps – ie UAH TLT V6) ?
There is NO WAY any “Super” EN will keep the Earth warmer 5 years after it’s finished.
And it hasn’t done so. Earth has been cooling since February 2016, not warming. Dunno where Griff got the idea that it has warmed. Antarctica suffered its second coldest month in the satellite record in June.
Recent winters here in Chile have been unusually cold. It has been even worse in Brazil:
https://riotimesonline.com/brazil-news/nosubscription/south-brazilian-state-of-santa-catarina-recorded-third-consecutive-day-of-snow-and-negative-temperatures/
Heat wave in western North America. Cold spell in southern South America. The net was a negative global anomaly for June.
And let’s not forget the brutal cold in North America in February.
Did you pay attention to the graph “US State All Time Temperature Records (Incl Ties)”? Yeah, I didn’t think so. Just under 35 per decade for the 1930’s. No other decade breaks 5 except 1910. But 1910 doesn’t fit your narrative, does it?
griff
Reply to
Right-Handed Shark
July 15, 2021 7:51 am
I’m sure the 30s had reasonably accurate measurements.
Well Griff, you just made it clear that even you know that this NASA data is fraudulent.
Occasionally NASA does what is supposed to do, when is not fiddling climate data.
Released yesterday: Juno Flies Past the Moon Ganymede and Jupiter,https://youtu.be/CC7OJ7gFLvE
best bit starts at 1.50 min in
Thx, bzw, always a good choice to underly such videos with Vangelis’ music !
Clearly, you’re a climate doofus.
Monckton has made the case that there is no statistical increase in temperatures for over 6 years.
I have made the case that there is no empirical evidence that heat waves are increasing:
https://wattsupwiththat.com/2019/09/06/the-gestalt-of-heat-waves/
You have an over-active imagination!
How hot would it have been and how many more records would have been set in the 1930s if there was as much concrete and asphalt back then as there is today?
I’m sure it’s all Different now. But if it’s Different now, why are so many Climate Scientists trying to change the Past? i.e. removing the MWP and LIA and trying to restate past temps?
And clearly adjusted to make the past Cooper AKA record warm from record modifications
Nonsense, Griff. Record weather phenomena are being set somewhere on earth normally and regularly. It is a function of the short duration of weather records that records will be set with regularity. It may be record cold in Siberia, record heat in western North America, record rainfall in India or record drought in Australia. It is all grist for your misinformation campaign.
Spin the troll dial and tell me what this is.
German floods kill 60 as dozens more remain missing | Fox News
I live in Kansas. In my area we haven’t broken 100 degrees in 4 years. Most of our high temperature records–about 1/3 of them across the years–were set in the 1930s. Very few records in the past few years. Not warming, not intensifying.
So griff, this would be a good time for you to finally answer the question…
In which time period would you prefer to live your life
[__] Benign low CO2 1675-1750
[__] Dangerous CO2 1950-2025
If records from the past are really unreliable then that discredits the entire official narrative. Then it would be we simply don’t know.
… because Climate Change …
Oh, wait! Mebbe not, eh
No, absolutely certainly now.
Temperatures that are absolutely within the range of normal, must have been caused by CO2.
Right.
Wait wait wait. Let me get this straight. Past heat waves were all natural. But when the exact same thing happens now, it is climate change. How can something that happened in the past be totally natural but when the exact same weather happens today it is unnatural?
The models have spoken.
All hail the sacred models.
“but when the exact same weather happens today it is unnatural?”
“It’s different this time”
So the summer 1936 was nationwide the warmest on record and February of 1936 was the coldest for the month.
But that doesn’t show on temperature graphs like this one
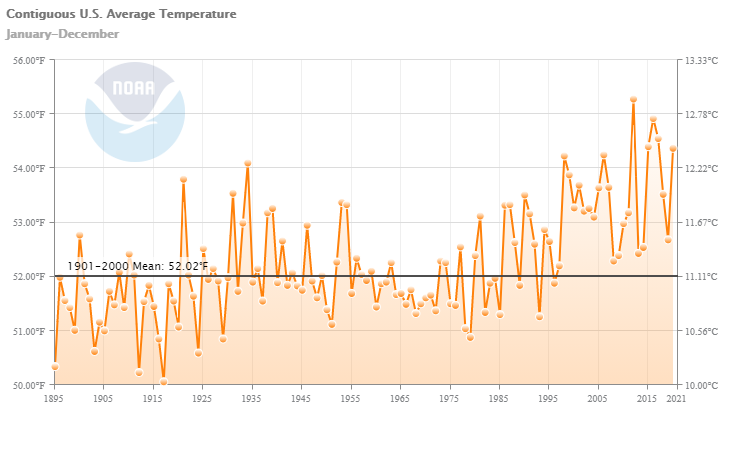
from NOAA’s Climate at a Glance because we are always treated to average temperatures.
In 1991 Dixie Lee Ray, the one time governor of Washington, during a speech in Pasco, Washington famously denounced the growing number of scientists advancing theories of climate change by telling her audience:
“Beware of averages. The average person has one breast and one testicle.”
“Beware of averages. The average person has one breast and one testicle.”
So science & math has proved we are all transgender !
Fun fact – in UK 17 million adults, equivalent to 49% of the working age population, have the numeracy skills expected of a primary school child.
All right.

Just consider extremes.
In 1936 there were about as many extreme cold records as hot.
Now there are twice as many hot as cold.
That implies that in 1936 was oscillating around a mean stable point.
Now it’s implying that the mean is rising and lifting maxima above that of minima.
Minima are warmer faster than maxima.
The reason is simple.
The volume of air under a nocturnal surface inversion is easier for ground flux heat to maintain a higher temp.
In the daytime, surface heat will convect up the DALR (until saturated), and so spread that extra heat through a deep layer of atmosphere.
The exception comes with a low level subsidence inversion, which always occurs in the hottest temps.
https://www.epa.gov/climate-indicators/climate-change-indicators-high-and-low-temperatures
“If the climate were completely stable, one might expect to see highs and lows each accounting for about 50 percent of the records set. Since the 1970s, however, record-setting daily high temperatures have become more common than record lows across the United States (see Figure 5). The decade from 2000 to 2009 had twice as many record highs as record lows.”

“However, overnight low temperatures have been rising even faster than daytime highs. Since 2010, there have been 34% more record high minimums than record high maximums (according to NOAA data compiled by meteorologist Guy Walton). And of all the summers on record, 2018 had the warmest low temperature in the contiguous U.S.”
https://medialibrary.climatecentral.org/resources/warm-summer-nights
“Observed changes in the occurrence of record-setting daily temperatures in the contiguous United States. Red bars indicate a year with more daily record highs than daily record lows, while blue bars indicate a year with more record lows than highs. The height of the bar indicates the RATIO OF RECORD HIGHS TO LOWS (red) or of record lows to highs (blue). For example, a ratio of 2:1 for a blue bar means that there were twice as many record daily lows as daily record highs that year. Estimates are derived from long-term stations with minimal missing data in the Global Historical Climatology Network–Daily dataset.”
This graph shows the RATIO of record low v high temps.
RED is more heat records.
Blue is more record lows
FI In 2012 there were 7x more heat records than cold.
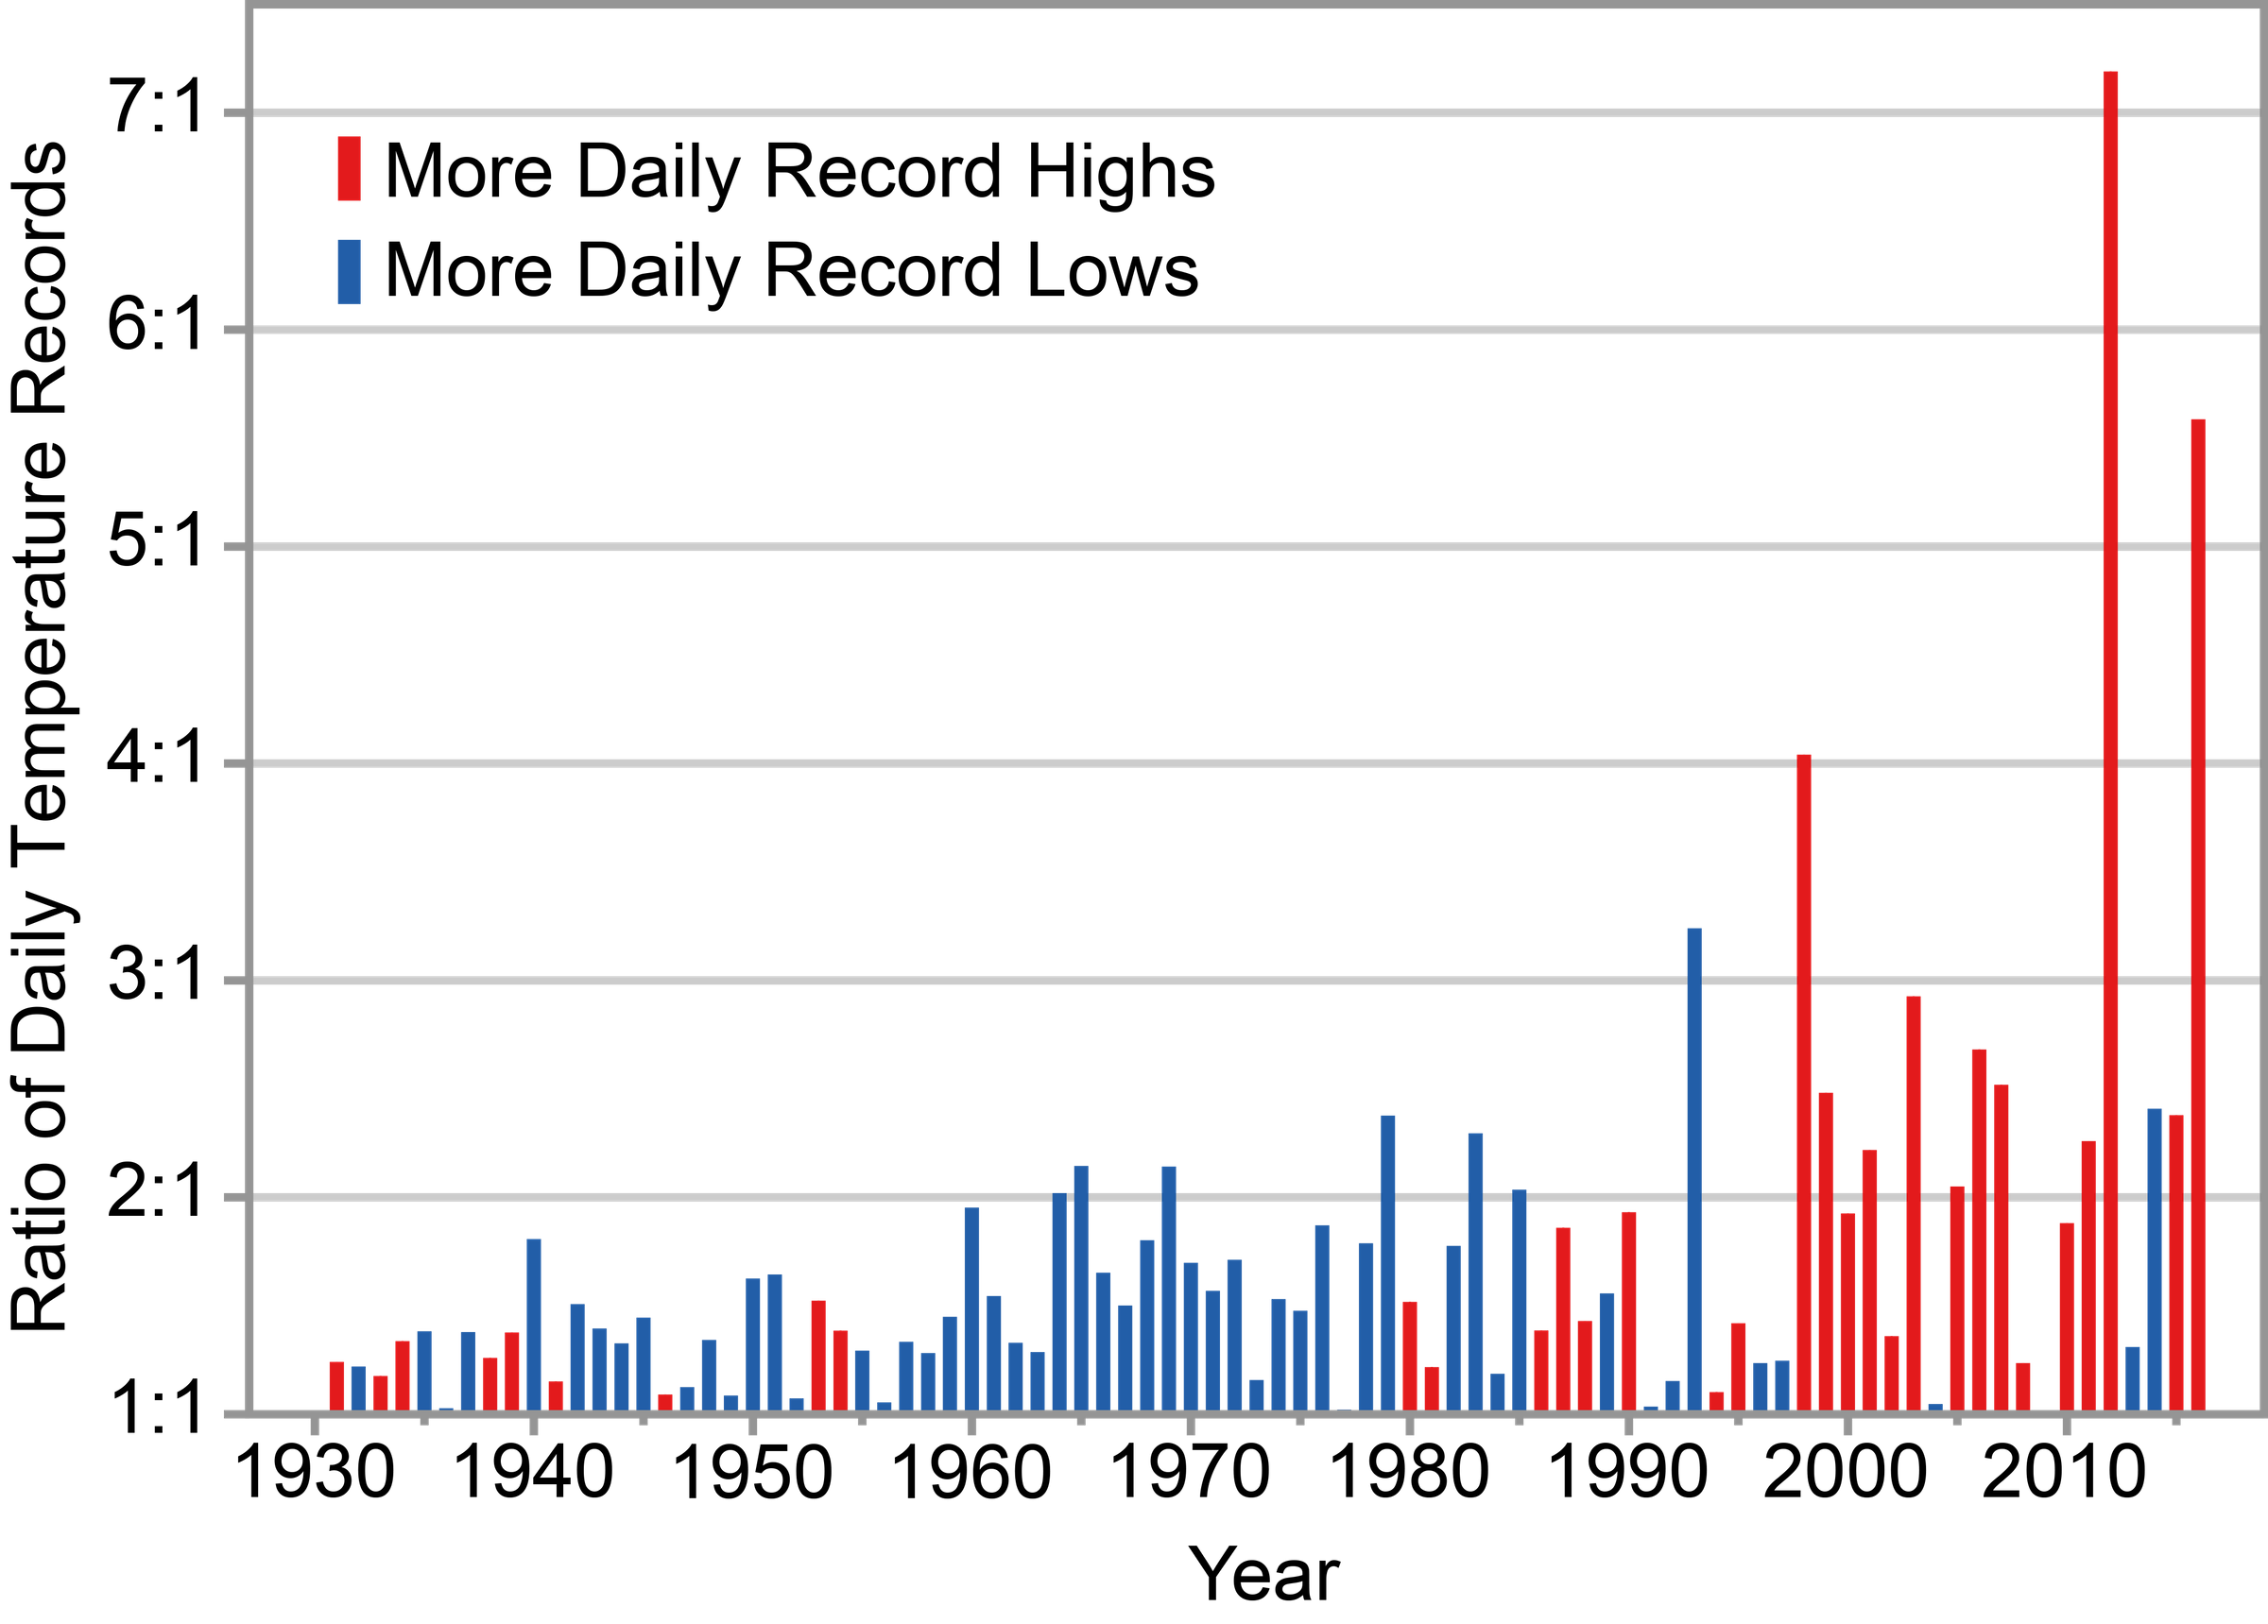
In 1936 heat and cold records tied.
On the other hand, the Contiguous State temperature shown by the Climate Reference System shows no change since 2005, when the system was placed in service. Only NOAA and NASA adjusted temperatures show increases. I wonder why?
“Minima are warmer faster than maxima.
The reason is simple.”
Yes it is … you are plotting Urban Heat Island Effect.
Weather stations that were in green fields are now surrounded by 1,000s of tons of concrete thermal mass & loads of A/C units; the weather stations at air fields are also surrounded by concrete thermal mass & regularly washed by jet engine exhaust.
So a nocturnal surface inversion holds the extra energy.
And the question remains – why do some people consider this a bad thing?
Hey. I’m a strong supporter of Global Warming.
–
The alternative is what’s to be feared. I’m fighting to keep my back yard glacier free.
–
If the climate holds true to the patterns of the past couple of million years, I’m going to lose that battle.
Maybe, in a couple of million years from now?
I don’t know if the tentative new record in WA has been certified or not.
Two stations in Chelan County, central WA, where my cousin lives, recorded 119-degree highs last month, surpassing the state’s previous all-time high of 118 degrees, which was recorded on August 5, 1961, at the Ice Harbor Dam, just east of the Tri-Cities. That record was a tie with prior highs. Dallesport tied it again in the June heat wave.
Salem tied the already tied official high of 117 F at Umatilla in 1939, but the old, now disavowed record was 119 F in my birthplace, Umatilla County seat Pendleton in 1898. That was in the middle of an historic heat wave, but there were also wheat fires around the city. An unofficial thermometer in the city hit 124 F, IIRC.
So, not unprecedented except in the big coastal cities, where the record-breaking stations were at airports.
Whatever the subject: Its never been as bad before as it is now and its getting much worse – you can apply that to just about anything in the narrative driven media etc
This is the result of indoctrination over generations.
In 1940 the average age of a British pilot was 22, some were as young as 18
In 2021 the average 22 year old is worried about their media profile and whether they can get to a safe space without being offended or triggered.
If it doesn’t fit the narrative, well, you reported on it here.
CAUGHT: ‘Inconvenient’ U.S. Wildfire Data Has Been ‘Disappeared’ by National Interagency Fire Center
You could say where data torture is concerned, it’s worse than we thought.
Numbers are a lot like people.
Torture them long enough, and they’ll tell you whatever you want to hear.
A frighteningly insightful comment. You’ve flagged precisely what’s wrong with the big picture. Those in charge are hiding the truth from a populace who have been lied to for so long they can’t handle the truth.
Oh and by the way, what was ppm co2 around that time again?
Joe
Parts of Europe meanwhile seem on their way to a year without a summer
At least 42 killed and dozens missing after record rain in Western Europe – BBC News
Our 70ies in Germany started in a comparable way, the beginning of the cooling despite increasing CO2
Well now the US has had two heatwaves in a month, one of them in the NW exceeding by degrees the highest records for the area.
See also heatwave in E europe and Russia, plus tornado; record heatwave in Finland and Lapland,; record temperatures along N Siberian coast; record and lethal flash flooding in Germany – all in N hemisphere in the last 6 weeks.
The ‘it happened before so its nothing exceptional’ and ‘just weather’ excuses are looking increasinglt thin, aren’t they?
Widespread flooding in central Europe in 2002 (Elbe, Danube), 2013 (Elbe), 1995 (Rhine, Meuse).
https://en.wikipedia.org/wiki/1966_flood_of_the_Arno
A couple of short heat waves that are well within the range of normal is proof positive that CO2 is going to kill us all.
A record breaking cold wave this winter that killed dozens, is just weather and must be ignored.
“…and ‘just weather’ excuses are looking increasinglt thin, aren’t they?”
No, no they’re not. Your implied attribution claims are ridiculous. Even the IPCC won’t go there.
Just the opposite Griff.
“the more things change, the more it’s just the same”
More reported weather events that have happened before support the observation that nothing extraordinary is underway.
Even if happend earlier, it may be nevertheless exceptional, as weahter never is at an average level, but chaotic, and exceptions happen, like your one in thousand comments may be a correct one. 😀
Look at Iceland:
Also weather despite the time of the year in melting time….
Greenland.
Right, sorry 😀
No idea why I wrote Iceland, no reason foe ;D
Don’t worry, griff wont know the difference; they are both melting back to bare rock … in his head.
It’s easy to confuse Eric the Red pere with Leif Ericson fils.
Good answer! LOL
Iceland is where a volcano is spewing forth right now, it’s on my mind for that reason.
That is Greenland, not Iceland.
Please see my comment about state heat records. OR’s was tied, at the Salem Airport, while WA’s might have been broken by one degree.
In the German Alpes, it’s snowing at the “Zugspitze”
In 1968, ir was snowing roo, as I had to realise with wrong clothes visiting that mountain..
The rest of Bavaria had rain over weeks at that time in July. As I was there for holiday in in a youth camp, it was not very “prickling” 😀
It was the early beginning of the coming coller time 2 years later., 1969 was the last exciting summer.
Yet, July 4th 1968 weekend on the North Fork of the American River was one (probably about 120 deg F) of the two hottest periods I ever experienced in Northern California during the many decades I lived there. Every time a breeze would blow up the canyon it would flash evaporate the water and we would all cough from the instantly increased heat index, as though we were in a steam sauna.
54 degrees C or 130 degrees F (if correct) seems hot to me. 10 degrees above the temperature quoted in the article.
https://www.gizmodo.com.au/2021/07/the-130-degree-fahrenheit-reading-in-death-valley-ties-for-the-hottest-temperature-ever-reliably-recorded/
They don’t call it death valley for nothing.
What is the correct number of heatwaves?
I hope you’re writing this tosh on a device made locally out of willow, powered by a handmade watermill, or else you are to blame for all this “unprecedented” mayhem.
COMRADE HYPOCRITE
…all in N hemisphere…
Where most of the, er, land is.
Where is our heat wave then, griff???
And during those NW heatwaves, what was happening over the rest of the Americas?
All you’re doing is reinforcing the Null Hypothesis with your frivolous comments. All empirical evidence points to natural variation as the best explanation for all these recorded events. The more you offer these flimsy excuses the less evidence there is for anthropogenic CO2 forcing.
griff
If the weather had a zero point zero anomaly for six straight years, you’d be blabbing about it being dangerously unchanging. And everybody but you know it. You have zero credibility. Why do you keep this up?
In which time period would you prefer to live your life?
[__] Benign low CO2 1675-1750
[__] Dangerous CO2 1950-2025
f.k g, idiot Griff was clearly NOT alive in 1976.
I remember it well, the boiling summer!
The wash out of 1968 with the Thames flooding across huge stretches of fields in mid to late summer around Lechlade- was also a sight to behold, you could literally canoe across about 20miles of fields.
I have no doubt the same things happened in the middle ages and in in Roman times.
Sweetgrass Saskatchewan had a high of 113F (45°C) in July 1937. Cooling with higher latitude seemed to get thoroughly swamped by the huge weather system. It would be great to see an analysis of this continent sized weather system by Cliff Mass if some kind of forensic work can be done with the limitations in available data.
Tony Heller has gone over the extremes of the 30s time and again.
1934 – Worldwide Drought, Poles Melting, England To Drown, Freak Weather | Real Climate Science
Perhaps we can put today’s ruination of Western civilization because of weather in perspective. Many reading this almost unbelievable article will be sceptical, especially those who otherwise don’t seem to have a sceptical faculty. I was born in 1938, a little late, but my family and their friends recounted the nightmare for over a decade afterwards, so there is no doubt that it was real. It was like interviewing survivors of the Titanic – there is no room for doubt something horrible occurred
Imagine today’s climate klatch and a 5th Column of néomarxistes, having formed IPCC and the industrial climate complex back in 1920 and the utter devastation of the 1930s- mid 40s continental ‘weather’ hit. They certainly would have had an easier time installing the centrally planned government. The masses were already poor, socialism was strong in America and strong arm tactics were more acceptable. Sceptics would hunted and shot.
By the end of the first 5 year plan, it began to suddenly cool and this deepened over the ensuing 35 years, dropping -1°C (I was a newspaper boy late 40s to mid 50s and then in university to 1962, yeah it was cold) and erasing the the entire century’s warming high stand.
The two decade warming at the end of the 20th century that caused all the present day hysteria was simply recovery from the preceding 1°C drop! Indeed, Jim Hansen, head of GISS stated that the super el Niño of 1998 failed to surpass the 30s record high.
Then, oops, an 18yr hiatus in warming followed, until the 2015 el Niño ended the Pause -all the while CO2 galloping uninterupted growing 40% of the total rise after 1850!
We are in the sixth year of dropping temps since the recent el Niño. Hmm… will we connect back and extend the 18 yr Pause another decade or two. I know the chief climate worriers are scared of this.
The “chief climate worriers” aren’t worried. They know fear will drive you to pay more taxes eventually in what amounts only to an air tax. Do you for a moment believe they can control the weather? This is what has to happen to “fight climate change”.
What they are worried about is acquiring power and money. Same as it ever was.
The storms finally eased off in March, but it would be July until many of the largest snowbanks completely melted. In all, nearly 80 people died across Wyoming, Nebraska and the Dakotas in the storms of 1949.
Be careful what you wish for when you want to rid the globe of warming.
Is Tony Heller posting here?
He does, and has been doing, this real-world analysis for a long, long time.
Here’s his “Hottest June Ever”, from earlier this week.
https://realclimatescience.com/2021/07/hottest-june-ever-2/
No, there was a errr… parting of the ways.
I like his videos, especially his use of old newspaper articles, great perspective. We all need to support his work in this information war.
Yes, sir. That was a rhetorical question.
The dude who wrote this posting copies pretty much all of Tony’s techniques, data, and analysis–NOAA’s own records, press reporting from the time, etc.
Tony has, for years (a decade?) covered this exact topic–1930s were the hottest years ever–in exquisite detail, with deeply researched and sourced data.
It’s quite amusing/disturbing that the folks here ignore the best analyst of the scam.
Ah ok, I didn’t know that, now you mention it , it is similar, but info worth repeating all the same.
It’s a shame Hella doesn’t post here, but it is what it is.
A damned shame if you ask me. The rift is often used by the climate crazies against skeptics. Tony is one of the few who use actual empirical evidence, unadulterated data and volumes of historical proof.
If you extrapolate such heat waves, you get movies like Interstellar which try to depict concepts in physics while distorting climate issues like CYCLES. Maybe more advanced civilizations can rediscover cycles in climate and non-agenda science.
Hey, in Game of Thrones they predicted that “Winter” was coming. In this case a horrific multi year cold cycle. “Subversive” I say.
The 1936 June-Sept. heat wave has all of the appearance of a stalled high pressure weather system, like the 2003 event in Europe (mostly France), its repeat in the spring and summer of 2018, and the 2013-2016 “blob” in the Gulf of Alaska (due to a “persistent and intense” ridge of high pressure), and the recent warming in our North West.
This temporary event had nothing to do with CO2 or the gradual warming of our climate, nor did any of the others. However, I have read that they may become more frequent, as our climate warms up.
Ah yes, the magic word “may”. Get them to tell you it will and when.
Climate cultists would be having non-stop orgasms if they could get headlines like those.
My 2 cents. The heat is from coming down from the upper troposphere, hot and dry air as it compresses as it comes down. How they get there is from large storms in the Pacific, which push air high into the troposphere when has to come down somewhere and hot places is where it does. The cold period previous season, it’s likely the pacific isn’t allowing the warm waters to move north/south much and uses the energy to create larger pacific storms which creates the huge dry and hot areas of sinking air in the summer and cold winters.
Actual planetary climate change occurs over centuries to millennia. In between there are multi decade weather cycles, which even then are still just the noise level on the long term very, veeery slow trend of actual global climate change.
Nothing the UN, or the yap-media, nor the idiot politicians, or the corrupt met-agency data corrupters, nor the Malthusian arts-school dropouts ignorantly assert, is ever going to change the way the Earth does its business.
Their pseudo- ‘climate predictions’ will always be rejected by observation, because they do not even understand that the Earth does not change climate quickly. Never has and never will, it only oscillates around a trend that is dominated by solar system level orbital orientations.
Plus the fact that the next radical global climate change due will be the onset of a global glaciation, in a few thousand years ahead.
Any warm oscillations we get in the interim, and lovely ‘global greening’ spurts, will be the last warm days of the planetary Summer. And that is not Malthusian doom-ism, this is how earth works.
Really, really slowly.
It is hard to understand heat waves when you work with daily data. Why don’t readers here do some of the simple math for thir own regions, by looking at the average Tmax over 3, 5, 10 consecutive days, as I have for Australia’s State capital cities? It throws a whole new complexion on what you are encouraged to believe.
What happens with one-day data is rather different to 3-day data for heat waves.
Here is but one example, from Sydney, using BoM official adjusted Acorn-Sat v.2 data.
http://www.geoffstuff.com/black_swan_heat.jpg
Points of note.
Meanwhile, up North of Sydney, on the Gold Coast, we have some more black swan events to confuse the experts with new things happening every day.. Geoff S
https://www.dailymotion.com/video/x318270
We need now to address the German floods: these would have been exceptional even in winter, in summer there’s no adequate word for the scale of them
Three months rain in 24 hours with the flood onset in minutes…
This sort of slow moving very intensive summer rain system is EXACTLY as predicted by climate science… this is EXACTLY what the physics of a warming atmosphere dictates should happen.
Please don’t bother finding spurious previous examples or defining this as ‘just weather’
It’s weather, and you know it.
Sticking your fingers in your ears and screaming don’t show me facts that shatter my world view, isn’t going to help.
I think people have had a belly full of your childish behaviour. In all the years that you’ve spent here you’ve never once convinced anybody of anything, apart from the fact that you are an uneducated lefty militant extinction rebellion type foot soldier.
One of the “usefull idiots”, one of the true believers, living a confortable middle class life in a world built on fossil fuels, even using them on a daily basis, but then feeling so much guilt that you feel you must atone for your sins by hypocritically berating others with diatribes of virtue signalling.
How worthless you are Grifter.
“Three months rain in 24 hours”
Sheesh, that’s nothing. Where I used to work we had a year’s worth of rain in about 4 hours. It’s a rather dryish area at the best of times, but it happened. Currently they’re in substantial drought.
Averages are comprised of extremes. Weird, eh?
Follow the logic
CO2 > 350ppm is responsible/causes heat waves
CO2 < 310ppm during the year 1936
Conclusions –
Either CO2 does not cause heatwaves
or somehow CO2 has “been disappeared” from the the historical record.
Any ideas?
pity more warmists dont read or know history isnt it