The first version of this post had an error in Figure 1. It has been fixed along with the associated text (7/5/2021).
By Andy May
The IPCC claims, in their AR5 report, that ECS, the long-term temperature change due to doubling the atmospheric CO2 concentration or the “Equilibrium Climate Sensitivity,” likely lies between 1.5° and 4.5°C, and they provide no best estimate (IPCC, 2013, p. 85). But their average model computed ECS is 3.2°C/2xCO2. Here, “°C/2xCO2” is the temperature change due to a doubling of CO2. They also claim that it is extremely unlikely to be less than 1°C. ECS takes a long time, hundreds of years, to reach, so it is unlikely to be observed or measured in nature. A more appropriate measure of climate sensitivity is TCR, or the transient climate response, or sensitivity. TCR can be seen less than 100 years after the CO2 increase, the IPCC claims this value likely lies between 1° and 2.5°C/2xCO2, their model computed average is 1.8°C/2xCO2 (IPCC, 2013, p. 818).
The CO2 climate forcing, or the net change in radiation retained by Earth’s atmosphere associated with these scenarios is 3.7 W/m2 (IPCC, 2007b, p. 140). Using these values, we can calculate a surface air temperature sensitivity to radiative forcing (RF) of 1.8/3.7 = 0.49°C per W/m2. These values are inclusive of all model-calculated feedbacks.
The IPCC explicitly state that they believe cloud, water vapor and albedo feedbacks are all positive and claim both model and observational evidence for this (IPCC, 2013, p. 82). They admit that cloud feedback, especially low cloud feedback, is poorly constrained and the source of most of the spread in model results (IPCC, 2013, p. 817). Cloud feedback is poorly understood; but it can offset the entire estimated human impact on climate. According to CERES satellite measurements, the net RF of clouds has recently varied from -13 to -25 W/m2 as shown in Figure 1. Both numbers are negative, which means that overall clouds cool the earth. If the IPCC claims that doubling CO2 will increase RF about 3.7 W/m2 at Earth’s surface are true, this is less than the change in yearly cloud RF. For more on clouds and global warming, see here.
The IPCC wants us to be concerned about a CO2-caused change about 100 years from now, when we see a larger change in radiative impact every year. Their computed impact of doubling CO2 is tiny compared to natural changes. The uncertainty in the impact of CO2 on climate is the difference between two tiny numbers, both too small to measure. One might reasonably conclude they have a screw loose.

It is worth repeating that the AR5 report does not provide a best estimate of ECS because of a lack of agreement in their various estimates. It is also significant that they think that TCR is extremely unlikely to be more than 3°C/2xCO2, but they do not offer a lower limit they are confident in. A summary of the IPCC estimates of ECS and TCR is presented in Box 12.2 of AR5 (IPCC, 2013, pp. 1110-1112).
There are several peer-reviewed estimates of climate sensitivity, based on observations in the real world, that are less than 1°C/2xCO2. These estimates are the focus of these posts. Some of these estimates are of ECS and some of TCR, or similar to the quantity that IPCC labels TCR. In this post we will not distinguish between the two. The IPCC has specific model-based definitions of ECS and TCR that do not translate to the real world. Here we focus on real-world estimates, not abstract model constructions. The IPCC tries to ignore these lower estimates and claims they are discredited (IPCC, 2013, p. 923), we think this is inappropriate.
The lower estimates come from Richard Lindzen (Lindzen & Choi, 2009), Sherwood Idso (Idso, 1998), Reginald Newell (Newell & Dopplick, 1979), and Willie Soon (Soon, Connolly, & Connolly, 2015). Lindzen’s estimate is about 0.5°C/2xCO2, Idso’s is 0.4°C/2xCO2, and one of Soon’s (he offers four) is 0.44°C/2xCO2. Newell and Dopplick derive 0.25°C/2xCO2 for the tropics. The researchers use a variety of datasets and methods, but all are observation-based. We will get into the details below and in a second post that will appear in a day or two.
There are other observation-based estimates, such as the well-known estimate by Nic Lewis and Judith Curry using historical CO2 and global temperature records. Lewis and Curry estimate TCR to be 1.2 (5%-95% range: 0.9-1.7) °C/2xCO2 (Lewis & Curry, 2018). Lewis and Curry’s work is excellent, but we will focus on the lower estimates in this post. We mention their work only to show that many, if not most, observation-based estimates of TCR are lower than the model-based estimates. Models that do not track observations should be ignored.
While AR5 does address Lindzen and Choi’s work, they ignore Idso’s estimate from 1998, Newell and Dopplick’s estimate from 1979, and Soon’s estimate was not yet published.
Lindzen and Choi
In a series of papers Lindzen and his colleagues have developed a robust hypothesis that rising sea surface temperatures (SST) cause some high-level tropical cirrus clouds to disappear, opening the sky so that more infrared radiation can escape into space, cooling the tropical atmosphere and surface. As mentioned above, the IPCC claims that net cloud feedback to warmer surface temperatures is positive and further warms the surface. CERES tells us that the overall impact of clouds is negative, but how cloud cover changes with surface temperatures is unclear. Lindzen’s investigation into this problem is illuminating.
Most tropical cirrus clouds, but not all, originate in the upper reaches of cumulonimbus towers. The hypothesis is that higher surface temperatures cause the precipitation efficiency within the cumulonimbus towers to increase, as well as the number of towers, therefore, there is less water vapor available high in the towers to form cirrus clouds (Lindzen & Choi, 2021). High-level cirrus block outgoing infrared radiation, but allow most incoming shortwave radiation in, so reducing cirrus covered area cools the surface.
Lindzen calls the reduction of cirrus cloud cover, due to rising surface temperatures, the “iris effect;” since it is analogous to opening an eye’s iris. This negative feedback is not part of most climate models, but Thorsten Mauritsen and Bjorn Stevens added it to their ECHAM6 climate model and found it caused the model’s results to move closer to observations (Mauritsen & Stevens, 2015). A one-degree increase in surface temperature reduces the cirrus cloud cover by 22% in the tropical Pacific, so it is significant.
The standard ECS, computed from the ECHAM6 model output, is 2.8°C/2xCO2. When the iris effect is added to the model, ECS always becomes smaller, and can fall to 1.2°C/2xCO2 in some scenarios. As mentioned above Lindzen computed an ECS of 0.5°C/2xCO2 from the cloud feedback parameter derived from ERBE (Earth Radiation Budget Experiment) satellite data. The precise impact of the iris effect has yet to be determined, but once incorporated, it always lowers both TCR and ECS.
Despite severe criticism over the past 20 years, including a paper entitled “No Evidence for Iris” in the Bulletin of the American Meteorological Society (Hartmann & Michelsen, 2002), the cooling iris effect is generally accepted today. What is still being debated is the magnitude of the effect. While in theory, the ECS can be computed from the total feedback, the calculation has many unknowns, these are described in Lindzen’s papers, especially the first one in 2001 (Lindzen, Chou, & Hou, 2001). Depending upon the assumptions made, Lindzen’s iris effect results in an ECS between the purely observation-based 0.5°C/2xCO2 (Lindzen & Choi, 2009) and the model-based 2.5°C/2xCO2 (Mauritsen & Stevens, 2015). While the range of possible values is large, they are all smaller than calculations that exclude the iris effect using the same assumptions.
Lindzen emphasizes that the cirrus cloud response to SST warming is essentially instantaneous, data lagged a month, or more are not usable and misleading. There are also factors other than SST that affect the area covered by cirrus clouds complicating the calculation. Statistically the longwave infrared (LW) feedback response to the iris effect is a reliable -4 W/m2K-1. That is, as SST goes up one degree, it results in 4 Wm-2 of LW RF cooling. But the loss of clouds also means more shortwave radiation (SW) hits the surface from the Sun, so the net amount of cooling is in doubt. The estimates in the increase of SW as a function of cirrus cloud cover are less precise than the cooling effect of escaping LW, but probably between 3 and 3.5 W/m2K-1. So, the exact amount of cooling due to the iris effect remains unknown, but there is general agreement that the iris effect exists, results in cooling, and reduces ECS and TCR.
Soon, et al., 2015
No one knows precisely how Earth’s surface temperature varies with insolation. Just like the weather, the energy flux at the top of the atmosphere changes, so long-term small changes, whether due to changes in the Sun, or the CO2 concentration, are obscured by short-term natural variability. Likewise, the surface temperature record has measurement problems, both systematic problems and instrument problems.
Willie Soon and colleagues were concerned that urbanization may have contaminated the global temperature network, so they created a record of Northern Hemisphere (NH) temperature using predominantly rural weather stations (Soon, Connolly, & Connolly, 2015). Their new record was compatible with NH SST trends and records of glacier advances and retreats. The record was combined with a NH SST record and compared to the Hoyt and Schatten TSI (Total Solar Irradiance) reconstruction as modified by Scafetta and Willson (Scafetta & Willson, 2014). The match was quite good as you can see in Figure 2.

The least squares fit of the curves in Figure 2 results in a set of residuals that is quite small. The R2 is 0.48 to 0.5 and the slopes are 0.1 to 0.211°C/Wm-2. Soon and colleagues assumed that the temperature variation that was unexplained by the change in TSI was due to increasing the CO2 concentration and, depending upon how they did the calculation, resulted in a climate sensitivity between 0.44°C/2xCO2 and 1.76°C/2xCO2 (Soon, Connolly, & Connolly, 2015).
The TSI reconstruction shown in Figure 2 is similar to many others, as shown in Soon, et al., but the IPCC generally ignores the more active TSI reconstructions and favors more invariant reconstructions that make it appear that CO2 is the dominant factor in recent warming. The key point is that the climate models are tuned to the various global temperature records, which may very well be contaminated by the rapid urbanization that took place in the 20th century. The tuned IPCC models of natural warming assume a nearly invariant Sun, so when the natural-only modeled temperature is subtracted from the anthropogenic plus natural model to extract the human (or CO2) component of warming, all the warming is assigned to humans and CO2. This IPCC process is described here. The post also displays plots of various peer reviewed TSI reconstructions, those used by the IPCC and those they ignore.
Conclusions
In this post we compare the IPCC view of climate sensitivity to two modern observation-based estimates that are lower. In particular the low-end of the ranges that Lindzen, Soon and their colleagues calculate are much lower than the low-end estimate by the IPCC, yet they are based on reasonable assumptions and observations.
In the next post we will look at older, but still valid, observation-based estimates of climate sensitivity. The next post will also investigate estimates of surface air temperature sensitivity to radiative forcing. One main point, is that the impact of doubling CO2 is tiny compared to natural changes. As you can see in Figure 2, very small changes in solar output, 4W/m2 or 0.3% of 1361 W/m2 can make nearly as much difference as all the CO2 emitted to the atmosphere by humans. Likewise, yearly observed changes in cloud RF are larger than the impact of human-emitted CO2. The impact of CO2 on climate is too small to measure, thus we are arguing and panicking over something that likely doesn’t matter.
Download the bibliography here.
The Sherwood et al. 2020 publication is relevant to this topic. The 5-95% range is 2.3-4.7C.
“The lines of evidence we consider, as in SSBW16, are modern observations and models of system variability and feedback processes, the rate and trajectory of historical warming, and the paleoclimate record…
Derived from GIGO models and the bogus tamperature “record”, plus denying that the net effecct of clouds is cooling.
If theory and observations conflict you need to make a choice as to which to prioritise.
If you are a scientist you prioritise the observations. Reality matters.
If you want to believe you prioritise the theory. The truth is ut there.
AGW uses the same peer review process as the Fortean Times.
“…..neither credibly suggested by any model, nor by physical principles, nor…..blah blah…”
The physical principle is that the Albedo of clouds can be as high as 0.9, much higher than the surface of the planet. Therefore more clouds reflect more sunlight back to outer space. More clouds are the result of more water vapour in the atmosphere which is primarily a result of warmer sea surface temperature. Warmth causes clouds… causes cooling…negative feedback morning/afternoon/night and thousand year long ocean turnover temperature effects…not to mention shorter term El Ninos, PDO’s, etc…
The observation that OLR is increasing simultaneous with a positive EEI means ASR is increasing. Because TSI is neutral to declining that means the most likely reason is because albedo is decreasing. Declining snow/ice extents probably contribute some here, but the magnitude may be too small. The next most likely factor to close the gap here is a positive cloud feedback.
Strange, I thought it was a carbon tax that would have the most likely effect on climate, but you don’t mention that at all.
I didn’t mention it because it is has nothing to do with the cloud feedback.
Is that the SHerwood who said ‘if we replace wamr with windy, and measure wind speed instead, we can say the mid troposphere is warming’? Excuse me if I dont take anything he says seriously!
GW, now defined as Global Windy! Ridiculous!
I’m not sure if that was said by Sherwood or not. I’d have to look it up. But I do know that a positive planetary energy imbalance is dispatched in various ways including possibly increasing the kinetic energy of the wind. If the context of your use of the word “warming” here is the accumulation of energy then I cannot challenge the result. Though, personally I feel like this an abuse of the word of the “warming”. I much prefer describing this as the accumulation of energy. However, I should point out that “warming” is common phrasing for the phase change from ice to water or from water to vapor even though this does not raise the temperature of the mass at all. We still consider that “warming” because the heat is in latent form. In a similar manner I suppose you could consider an increase in kinetic energy of the wind as a form of “warming” as well. In fact, “warming” in its most common sense where a temperature increase does occur is because of an increase in the kinetic energy of molecules so in that sense “warming” = “higher kinetic energy”. What are your thoughts here?
My thoughts are that it is ridiculous. The troposphere was supposed to warm, according to the theory. Finding one iota of increased wind speed doe snot mean it got warmer.
Warmth and wind are not the same.
Too bad for them that actual, real world data has shown that all of these are actually negative feedbacks.
Looks like the JoeBot CO2 army has organized to mindlessly push negative buttons.
Given that, as the saying goes the flak is heaviest over the target, it’s reasonable to take it that the higher the – votes the more pertinent the comment.
“it’s reasonable to take it that the higher the – votes the more pertinent the comment”
+1
True, Nick, I’ll grant you that. But oftentimes a cigar is just a cigar, and most often a lot of down votes on a comment indicate that the comment is wide of the mark, just plain wrong, or just more repetition of the CAGW narrative.
Yes, I noticed that heavy hitters came in and piled up on me for my last article analyzing why the pandemic reduction in CO2 could not be observed in even the seasonal ramp-up when NH photosynthesis was at a minimum.
And yet, after all the effort expended to push all those buttons, there is still no hockey stick, Nick Stokes 6°C is science fiction.
Nope … not “science fiction” … just plain fiction. There’s no science in there at all.
True Mark, there have been Ph.D theses but no improvement in the cloud numbers since Ramanuthan and Hartmann’s et al ERBE assessment of 1989, a non-paywalled version here….
https://www.researchgate.net/profile/Patrick-Minnis/publication/313177307_Cloud-radiative_forcing_and_climate_Results_from_the_Earth%27s_radiation_budget/links/5a6f442f45851517967626e3/Cloud-radiative-forcing-and-climate-Results-from-the-Earths-radiation-budget.pdf?origin=publication_detail
https://agupubs.onlinelibrary.wiley.com/doi/full/10.1029/2008GL035333
“believe” is still the magic word. However, that is not science, it is religion.
WV is a stabiliser, a damper.
Desert: High diurnal variation. Much higher high, much lower low.
Jungle: Low diurnal variation. High and low are much less extreme.
So WV isnt a +ve or -ve feedback, it is a damper.
Figure 2 is based on the discredited Hoyt and Schatten TSI reconstruction which is not recommended by the TSI ‘community’. The ‘best’ [or at least mostly ‘accepted’] historical reconstruction is probably that from LASP:
https://lasp.colorado.edu/lisird/data/historical_tsi/
which is a poor match to the temperature record.
Not good since the Maunder and Dalton Minima anyway, in the LASP reconstruction.
In addition to very different up and down patterns, Hoyt and Schatten show a TSI range of about 5 W/M^2 while LASP has a range of about 2 W/M^2. That seems to be quite a difference. Any explanation?
Yes, Dr Svalgaard, if you don’t mind giving us the benefit of your expertise, why is H&S discredited?
Because it was not based on observations and because it shows a range much bigger than modern observations since show.
Yes, Solar activity has been high for quite a long time.
Thank you for the reply, Dr S. I also read your more extensive replies below.
The fact that the variation in TSI is almost perfectly correlated to solar surface magnetic field strength over a short modern period (63 months ended July 2016) and presumably has continued to do so in the 60 months since July 2016, is strong evidence that magnetic field was the only significantly varying factor affecting TSI during the recent/current period. Indeed it leaves little scope for alternative drivers during that period. I would think that all sides would be willing to acknowledge that limited conclusion.
What evidence do we have that causes you to preclude the possibility that there is at least one significant factor other than surface magnetic field that can affect TSI, and has affected TSI in the past, but that during the recent period has been nearly constant? I mean of course other than Occam’s razor.
UV is a part of TSI. UV creates and maintains the Earth’s ionosphere. Solar heating [and tides] causes the charges to move across the Earth’s magnetic field creating a dynamo electric current whose magnetic effect at ground-level we can measure [this was discovered 300 years ago]. From observations of that magnetic effect we can measure the UV from the sun. The variation over time of the UV is due to variations of the sun’s magnetic field, which in turn also drives the variation of TSI, so we can be confident that TSI has had no long-term trend the last 300 years.
https://leif.org/research/Geomagnetic-Indicators-of-Solar-Activity.pdf
I appreciate very much your indulging my questions.
If I dare question the professor further, you say that we have a proxy in the form of magnetometer readings that indirectly indicate the strength of the UV insolation (presumably adjusted for any observed fluctuation in the earth’s magnetic field strength). Since 300 years of readings do not imply much variation in UV insolation, you infer that there has not been much variation in total solar insolation in the same period. I hope that you will correct me if that is a wrong understanding.
My question then, do you therefore assume that the UV portion of TSI is a constant? Is there evidence to support that assumption, or is it still a possibility that the intensity of certain wavelengths could fluctuate independent of the intensity of UV wavelengths?
I apologize if these questions demonstrate the reality of my ignorance but I hope that in asking the right questions, we all might come to a better understanding.
Both EUV and the variation of TSI are directly caused by the Sun’s magnetic field so they will vary together. Other wavelengths will also vary with the magnetic field and we have no evidence of anything that does not follow the magnetic field.
I don’t like to base anything on something we have no evidence of.
Ok, I don’t want to be tedious with my naive questions but what is the physical mechanism that generates light from the sun’s magnetic field?
Speaking again from my ignorance, I imagined that the magnetic field modulated the sun’s luminance, which ultimately derived from fusion reactions, rather than being the source.
For example, something about the magnetic field caused cooler spots that are therefore darker. Is my thinking off base?
If the luminosity comes from the fusion reactions and the surface magnetism modulates it, then it follows that factors that change the rate of fusion or the amount of turbulence in the interior, etc. could adjust the TSI up and down like a stereo system master control knob, independent of the real effects of surface magnetism, which would continue to operate.
So if you would not correct me on that, then isn’t it more accurate to say that the only evidence that factors other than the magnetic field can affect TSI is the proxy data from Hoyt & Schatten? (Rather than saying that it is not based on any evidence).
Your patience with me is amazing!
“Because it was not based on observations” So I take it that the IPCC models are also discredited?
because A is not true does not automatically imply that B is false.
That was the aim of the new ‘reconstructions” from the very start…,
… to try to take solar activity out of the equation.
Nonsense. The aim was and is the get the best possible reconstructions and to correct known errors in previous reconstructions.
Leif,
You must admit that no one knows what the correct reconstruction to 1700 is, we don’t have the data. Hoyt and Schatten have as much evidence for their reconstruction as any other. There is also a similar reconstruction by Shapiro (2011) that was compared to many other Sun-like stars by Judge and colleagues in 2020. By golly, it made sense. The paper is:
https://iopscience.iop.org/article/10.3847/1538-4357/ab72a9/meta
Either our Sun is the weirdest star of its type, or it is more variable than it appears. Both Hoyt and Schatten and Shapiro are well within the norms for a star like our Sun. The attached plots shows Shapiro’s reconstruction and normal variability for Sun-like stars.
We have several cycles more data than H&S had so we have a much better understanding of what drives TSI [the sun’s magnetic field]. The magnetic field can with confidence be reconstruction at least back to the mid-1700s, so we do know what TSI should be.
Here is the abstract of a seminal paper by Kok:
“The variation in the radiative output of the Sun, described in terms of solar irradiance, is important to climatology. A common assumption is that solar irradiance variability is driven by its surface magnetism. Verifying this assumption has, however, been hampered by the fact that models of solar irradiance variability based on solar surface magnetism have to be calibrated to observed variability. Making use of realistic three-dimensional magnetohydrodynamic simulations of the solar atmosphere and state-of-the-art solar magnetograms from the Solar Dynamics Observatory, we present a model of total solar irradiance (TSI) that does not require any such calibration. In doing so, the modeled irradiance variability is entirely independent of the observational record. (The absolute level is calibrated to the TSI record from the Total Irradiance Monitor.) The model replicates 95% of the observed variability between April 2010 and July 2016, leaving little scope for alternative drivers of solar irradiance variability at least over the time scales examined (days to years).”
Solar Irradiance Variability is Caused by the Magnetic Activity on the Solar SurfaceKok Leng Yeo, Sami K. Solanki, Charlotte M. Norris, Benjamin Beeck, Yvonne C. Unruh, and Natalie A. KrivovaPhys. Rev. Lett. 119, 091102 – Published 1 September 2017
Leif, It is clear from my post and many, many peer-reviewed articles, that 0.3% variability in the Sun is equal to nearly all the computed impact of human-caused CO2.
95% is nothing, you must do better than that.
0.3% is too large and is meaningless without stating over which time frame. On a yearly basis the variability is only half of that. And you have not understood what the 95% was. It meant that of the variability, 95% can be understood as due to observed variation of the magnetic field.
Here is part of Figure 4 from Kok Yeo’s paper. It shows how well we understand the variations. The red curves show the observed TSI, while the black curves show TSI calculated from the observed magnetic field.
If 0.3 is too large, how do you explain the changes in Be-10 flux estimated from the NGRIP ice core over the last ~180 years? Be-10 is cosmogenic, influenced by the Sun’s magnetic field, highly variable over the period ~1400 to 2000, but shows a distinct, and quite large, downward trend (increasing Solar magnetic field) since ~1820 (shortly before the LIA ended).
A 600-year annual 10Be record from the NGRIP ice core, Greenland, A.-M. Berggren, J. Beer, G. Possnert, A. Aldahan, P. Kubik, M. Christl, S. J. Johnsen, J. Abreu, B. M. Vinther, 02 June 2009
The 10Be concentration depends on several thing: changes in the Earth’s magnetic field, in atmospheric circulation and other climate variables, and on the cosmic ray intensity and solar activity. It is hard to separate the various causes leading to different regional responses.
See e.g. https://arxiv.org/abs/1003.4989
“A comparison of new calculations of 10be production in the earths polar atmosphere by cosmic rays with 10be concentration measurements in polar ice cores between 1939-2005 – a troubling lack of concordance”
Your reference is focused on short-term correlations between the production rate and the 10Be measured concentrations in snow and ice. The production rate varies by up to 36% over a solar cycle. We’re not talking about a 36% effect – the reduction in 10Be concentration over the last 180 years has been a factor of almost two. Unless you can explain why the polar atmosphere didn’t used to have global mixing and now it does (global production is ~factor of two lower than polar), you’ve dismissed a factor of ~two with this paper which addresses much smaller disparities. I can’t help thinking that you were being a bit evasive when you suggested that your reference explains the last 180 years of (large) change in 10Be concentration when it doesn’t.
As long as all those many, many peer-reviewed articles are using the same wrong TSI reconstruction it doesn’t matter how many, many there are
There is more too solar variability than TSI.
TSI is driven by sun’s magnetic field, and and that is all the variability there is.
UV ? Much more variability than TSI
I believe he might be referring to the spectral composition variarion, ie more or less UV component. UV, while even at its highest is a small portion of TSI, it varies widely and is qualitatively different from the less energetic wavelengths, in that it makes and breaks ozone, among other effects.
Leif,
TSI variations may or may not be important, we don’t know. I think Osborn is referring to variation in the radiation wavelength, for example UV varies by much more than total TSI, the solar wind varies a lot and the changes in the solar magnetic field affect much more than TSI. You oversimplify.
TSI is where the energy is, all the other variations are minute and inconsequential and BTW follow variations of the sun’s magnetic field which in turn drives the variation of TSI. Your own Figure 2 purports to show that the temperature closely follows TSI, so is your admission that you consider TSI to be the important driver of climate.
Solar wind, Magnetic connection to earth and UV, which you say is minute.
Does UV penetrate the Oceans?
Aren’t varitaions up to 10%?
Up to 100% for the more energetic UV, but a percentage is the wrong measure. The total energy of the variation is 100 to a 1000 times less than that of TSI.
But you ignore the fact that the qualitative effect of UV is different than the visible portion of the spectrum which is hardly attenuated by the atmosphere and doesn’t drive photocatalytic reactons.
Also, while the UV photon flux is much smaller than the visible part of the spectrum, the UV photons carry much more energy.
So Soon et al matched a discredited TSI to a wacky home-made NH land record, and then
“depending upon how they did the calculation, resulted in a climate sensitivity between 0.44°C/2xCO2 and 1.76°C/2xCO2”
and you ask “what do we know?”.
Seems you are not trying very hard to find out. This is not the place to look.
Maybe not so ‘wacky and home-made’, remarkably like Hansen 1981 NH all-surface, up to a point:
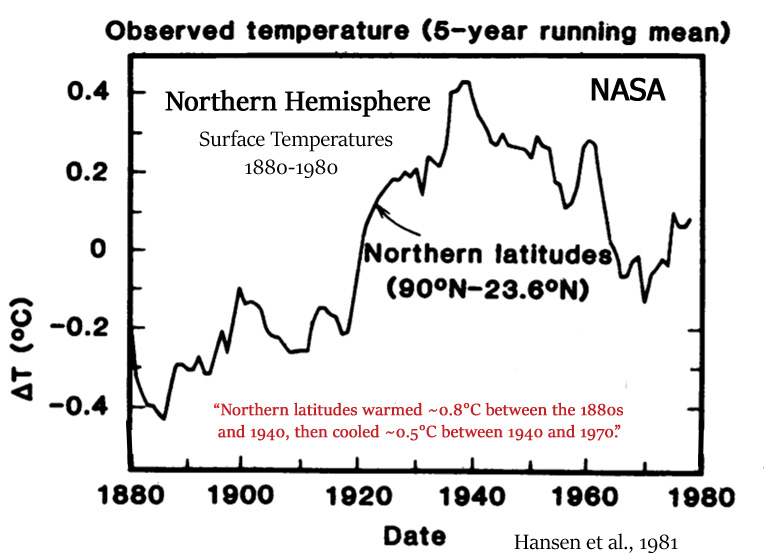
As an aside just about every scientific principle that Big Science uses today was in a sense ‘homemade’.
Like Hansen 1981, it is based on a very small number of stations. But unlike Hansen, they are eccentrically chosen. They have only stations in USA, China, Ireland (of course) and Arctic. But they have only one station in Ireland, Valentia. Because they also do a weird weighting with mean latitude, Valentia alone is weighted to be 24% of the “global” average to compare with TSI. You’d think it must be really sunny.
Nick,
Thousands of scientists spent billions of dollars in 34 years and went from a possible range of ECS from 1.5 to 4.5, in 1979 to a possible range of 1.5 to 4.5 in 2013!
I think I can ask:
Better question: “Why can’t the Climatariat acknowledge that they have no fracking idea what the TCR and ECS are?”
Even betterer question: “Why do they continue to crank out paleo-based and model-based sky-high ECS estimates, when almost all instrumental observation-based estimates put the TCR at ~1.0-1.6 °C and the ECS ~2.0-2.3 °C?”
https://wattsupwiththat.com/2020/11/14/climate-sensitivity-estimates-declining-or-not/
TCR is generally 1/2 to 2/3 of ECS.
I’ve done those back-of-the-napkin observation-based calculations of ECS and I get the low 2’s as well. The issue is that this assumes the climate sensitivity in C/W.m2 remains static. Many feedbacks can unlock higher C/W.m2 values on the backside of the response. This is most easily explained with the ice-albedo feedback in which a lot of the energy early on is consumed by melting ice and lowering volumes, but not really lowering areal extents. Once the volume gets low enough the areal extents start pulling back quickly. Ice-albedo is modulated more by areal extent than by volume. This is an example of how the C/W.m2 sensitivity can start low and end high making it difficult to quantity ECS on an observation basis.
Those aren’t “back-of-the-napkin observation-based calculations of ECS.” They are from peer-reviewed papers published from 2002-2018.
Awesome. That is a great list. Thank you.
You had me right up to Monckton.
The list comes from an article by Zeke Hausfather. If there was even a flimsy reason to exclude the Monckton paper, I think he would have excluded it.
https://www.carbonbrief.org/explainer-how-scientists-estimate-climate-sensitivity
Unlikely. Hausfather simply reproduced a list and extended a list of references from Knutti et al extended via Google
Compilation of climate sensitivity studies adapted from Knutti et al 2017 and extended through March 2019 based on a Google Scholar search of “climate sensitivity” and consultation with researchers.
I guess Monckton had to go in as it was published in a peer-reviewed journal, but as the rebuttal published later in the same journal made plain, it was trash. The same applies to the Leohle paper.
Hausfather should arguably have done some more checking, however the inclusion of rebutted Monckton 2015, Loehle 2014 and the deeply flawed Lindzen/Choi papers implies Knutti was performing a review of what had made it into the literature, rather than performing quality control.
In that case, here’s a great big hat tip to Zeke and Knutti for not limiting the list solely to Mannian Climatariat-approved papers…
To be followed by 1.8 to 5.6 in 2021!
My answer: that ECS is not a real quantity.
Without a doubt, the difference between TCR and ECS is not a real quantity. TCR can (sort of) be measured. The delta from TCR to ECS will supposedly occur over about 500 years, as Trenberth’s “missing heat” returns from its Voyage to the Bottom of the Sea… 😎
Interestingly, in IPCC #5, the reported TCR values have the appearance of a normal distribution, while the ECS values are tri-normal!
But you have just given a list of supposedly measured ECS. Mean value 2.3 K/doubling
Which is what I posted earlier.
An ECS of 2.3K means that the TCR is only 1.2-1.6K.
“An ECS of 2.3K means that the TCR is only 1.2-1.6K.”
But you were just saying that
“Without a doubt, the difference between TCR and ECS is not a real quantity.”
TCR is a real quantity that can be directly measured. The delta from TCR to ECS will always be hypothetical.
Along with “What is the state of verifiable, falsifiable and replicable science today versus 1981?
Today’s alleged science claims greater detail and a multitude of negative CO₂ effects and spurious energy budget flows.
Nick, It’s always refreshing to see an open mind in action.
This is entirely the wrong way to determine the climate sensitivity to carbon dioxide changes, ie measuring temperature changes vs CO2. This immediately assumes that CO2 is the only, or major, factor in determining changes in Earth’s temperature. If this was the case, it would be simple to determine as there would be little scatter in the data. Clearly this is not the case. Therefore, what are the other factors – and their size?
And so the size of the CO2 contribution is undetermined.
Secondly, Earth’s temperature has always fluctuated in response to various factors, which presumably have not disappeared simply because people have decided to focus on CO2 since the industrial era … which seems to have a variable starting time depending upon what fits whoever’s particular correlation.
Carson,
Indeed. If you frame the question around CO2, you gain an advantage in the debate. Make it about “global” changes, again CO2 wins.
My point is only that the CO2 induced changes they predict are so small that they are immeasurable and irrelevant.
I know H2O, CO2, CH4, etc absorb Earth’s IR heat – but ALL gases absorb it in other ways, eg conduction, convection (winds), and so ALL gases are Greenhouse Gases. (All gases – like all substances – absorb heat; they all have a Specific Heat.)
Therefore by far the major atmospheric absorbers of Earth’s heat are nitrogen, oxygen and argon because of their total mass, and so are the major Greenhouse Gases. Carbon dioxide, methane and other IR gases are very minor Greenhouse gases, with no perceptible effect upon Earth’s temperature; even water vapour is only about 1% to 2%.
Earth’s major gases – nitrogen, oxygen and argon – are therefore by far the major absorbers of Earth’s heat and so are the major Greenhouse Gases.
You may have noticed from the above that the amount of Greenhouse gases does not change so that they have no effect upon changes in Earth’s temperature. So, what causes such observed temperature changes? Check my site’s Chapter 2 for the quantitative answer. (Matches observed tectonic activity.)
Complete bollocks.
Adam Gallon.
Any risk that you might be capable of a reasoned reply?
Which are the only gases that cool the earth by LWIR radiation?
Even though they are at the same relative temperature
Not complete bollocks, but bollocks as described in the comment. i.e. bafflegab.
N₂. O₂ and O₃ and Ar may absorb energy via conduction, but they are either not long wave interactive or very minimally interactive.
Very true. And the source of heat is not just the Earth, It also comes from the sun. About 1/3 of the energy from the sun is absorbed directly into the atmosphere.
The energy absorbed into the atmosphere from the surface and sun is spread around by/between all the gases you mentioned. The gases are distributed based on gravity. The reason it is warmer at the surface is there are more molecules. It really is that simple.
However, the atmosphere must be able to radiate energy to space for it to warm above the S-B computed temperature at the surface. Hence, you need some gases to radiate energy. Water vapor provides everything needed for that to happen.
Richard M.
1. The gases are not distributed by gravity to any extent as diffusion, but largely convection (including wind) have their say. I’ve just detected the effect with very sensitive experiments in a still environment (within a cylinder).
2. All substances, including gases, radiate energy – whether they absorb IR or not.
Not true.
CO₂’s highest concentration levels are measured at the surface near or below CO₂ sources.
Lake Nyos, Lake Muon disasters and animal deaths in Yellowstone are attributed to CO₂ and CO₂’s tendency to hug the Earth.
As one goes higher in Earth’s atmosphere, the larger heavier molecules are fewer and lighter atmospheric molecules are more abundant.
Which is why helium and hydrogen molecules are more likely lost to space.
Yes, the approach should look at the change in all ‘greenhouse gasses,’ not just CO2.
Not just greenhouse gases.
Water is light interactive in all three physical states, water vapor, water and ice. A trick that CO₂ is incapable of one Earth.
Earth’s surface is the source of most infrared wavelengths heading into the atmosphere. Surface objects that absorb the majority of the light spectrum and radiate IR.
What do we know?
We know that the source of our planet’s heat is this big yellow ball in the sky called the Sun.
We know that all the water and our atmosphere keep Earth from going from a deep freeze to an oven every 24 hours as the Moon and Mars do.
We know that we don’t know in any measurable way what the difference between Man’s CO2 effect on the weather is from Nature’s CO2. (Or nature’s ability to absorb and adapt to Man’s CO2 contribution.)
We also know that “CAGW” (redubbed “Climate Change”) is being used as just one of many levers to divide and overturn the ideals, goals, the USA was founded on. That is, the only just purpose of Government is to preserve and protect and “referee” between the inherent rights of the Individual from those controlling and instigating Mob Rule.
We were getting closer until …
(Sorry, I drifted into politics. But isn’t that what PopSci “Climate Science” is all all about?)
Gunga din
You nailed it
“ECS takes a long time, hundreds of years, to reach, so it is unlikely to be observed or measured in nature. “
…
“There are several peer-reviewed estimates of climate sensitivity, based on observations in the real world, that are less than 1°C/2xCO2″
Something does not add up here.
ECS differs from TCR, as explained.
Yes, and he says
“Some of these estimates are of ECS and some of TCR, or similar to the quantity that IPCC labels TCR. In this post we will not distinguish between the two.”
which seems remarkably insouciant. So how can comparisons be made?
Nick, I am unconcerned about the difference between ECS and TCR. The differences are meaningless constructs of people obsessed with models and ignorant of the real world.
Neither ECS, nor TCR can be observed or measured. The models used to compute the values have yet to predict climate changes, they certainly cannot predict weather.
As implied in the post, the term “climate sensitivity” has some real world meaning, perhaps we can measure it at some point. ECS is an artificial construct that will probably never be measured.
“Nick, I am unconcerned about the difference between ECS and TCR. The differences are meaningless…”
Then your analysis is meaningless, because you can’t compare with anyone else’s results. In fact sensitivity has no meaning without a scenario of the GHG change you are talking about. ECS is definite, doubling and then to equilibrium. TCR is a specific time dependent scenario (doubling by exponential over 70 years, measured at end). You get different quite numbers just for those two scenarios. If you imagine others, you’ll get different numbers again. Sensitivity means nothing without a scenario specified.
If they both take so long, explain how can they use CURRENT CO2 increases to ACCOUNT for CURRENT temperature increases?
ie they match up the current CO2 trend to the end of the 20th century temperature increases and say look there is the cause and effect.
This should be fun.
In fact, current T increases depend on [CO2], ie accumulated emissions. But there is all the usual natural variability superimposed.
Even the units of ECS are wacky.
Thanks John, better answer than I could have offered. Spot on! ECS and TCR are artificial model constructs with little meaning. The term “climate sensitivity,” as vague as it is, makes much more sense in the real world.
Yes the ECS is am “emergent” phenomenon of the climate models. The ECS therefore is a product of the underlying assumptions.
And some of the UN IPCC CliSciFi climate modelers state that they tune their model to get an ECS that “seems about right.” Lies, damned lies and CliSciFi.
Which ones do that? Can you provide links to literature that we can review?
Things happen in real time, bdgwx. I note them and move on. Do your own research.
That’s a big turnaround. From minus 5 likes yesterday to plus 8 today
CO2???
That stuff trees eat that make them poop Oxygen?
You know, that stuff carbon based beings use to breath?
WTF, wheres that asteroid they keep promising us?
Trees take in water and make toxic O2. Trees then take in CO2 and turn that into sugars using reducing energy produced from chlorophyll’s reactions. It’s the Hydrogens and electrons being shuffled between those two reactions that makes all higher ordered life on Earth possible.
Dear Andy,
thank you for a nice article, which in my opinion might serve well to start a discussion.
You mention a few statements which merit more discussion IMHO.
First any real world parameter must have an uncertainty attached to it and a perceivable way how this uncertainty was determined, a lot of numbers you cite from both sites do lack that which makes them quite meaningless.
“These values are inclusive of all model-calculated feedbacks.”
There are some models which are unlikely to have real meaning (particularly high CO2-feedback ones seem not to pass a paleo climate “smell test”), they should be included with small weight to reflect that! (Otherwise the alarmist will simply include more and more unlikely models to support more alarming views, see the difference between CMIP 5 and CMIP 6)
“ECS takes a long time, hundreds of years, to reach…”
Radiation imbalances should average out over microseconds, do these long time constant by any chance have something to do with IPCC carbon cycle models?
A. Ollila says about that “According to IPCC, the oceans can absorb about 55 % of the yearly CO2 emissions in the present climate but as soon as the fossil fuel emission rate starts to decrease, the ocean can not do it anymore!” (he has more to say about it, but that sums up one criticism)
All the best,
LoN
LoN,
This is true on its face, but my point is that even accepting the IPCC numbers, they are too small to measure and thus irrelevant. Why put uncertainty bars on immeasurable quantities? If you can’t measure them, you can’t derive an uncertainty, right?
Plus, these days, Monte Carlo simulations that assume normality around an accurate value are the norm, and I call that BS.
This is very true. This is one of Lindzen’s main points. Many others disagree, I’m with you and Lindzen on this however.
Your last point is something I don’t know anything about.
In IPCC #5, Ch. 9, the words “uncertain” and “uncertainty” are used a lot, but never anything quantitative. It is nothing but hand-waving.
Thank you for your personal response!
And I think your article was clear enough on this point “but my point is that even accepting the IPCC numbers, they are too small to measure and thus irrelevant”
I just wanted to add a few discussion point not criticizing your article!
(Technically, my last point was a question)
It should be obvious that the Earth responds to higher levels of CO2 by becoming more efficient in reflecting radiation (light) or moving heat away from the Earth – it is why the Earth has remained so stable.
All the models and hypotheses in the world cannot change what we already know from Earth’s past.
Regarding Lindzen & Choi 2009 note that Lindzen conceded that this publication contained significant mistakes. The Lindzen & Choi 2011 publication ammended the climate sensitivity to 0.5-1.3C. I don’t know if Lindzen has amended this since, but I do what wonder what his thoughts are now given the 0.15C’ish increase in the last 10 years and the EEI increase to about +0.8 W/m2.
bdgwx,
You are behind in your reading. Read this article:
https://link.springer.com/article/10.1007/s13143-021-00238-1
I have no idea what mistakes you are referring to in the 2009 article, but it makes little difference. The iris effect is real, it reduces ECS and TCR, and it is a cooling effect. Further the AR5 models completely ignored it.
I’m definitely behind on my reading. I did read the publication you linked to. It is concerning the iris effect hypothesis. I don’t see any amendments to the climate sensitivity in that publication though.
When interviewed by Justin Gillis of the New York Times Lindzen said that the publication contained stupid mistakes and that it was embarrassing. They revised the paper and resubmitted it. The 4 reviewers rejected the revisions including the 2 that were hand picked by Lindzen himself. The 2011 publication I referred to above was eventually accepted by Asia-Pacific Journal of Atmospheric Sciences.
Today, most mainstream researchers consider Dr. Lindzen’s theory discredited. He does not agree, but he has had difficulty establishing his case in the scientific literature. Dr. Lindzen published a paper in 2009 offering more support for his case that the earth’s sensitivity to greenhouse gases is low, but once again scientists identified errors, including a failure to account for known inaccuracies in satellite measurements.
Dr. Lindzen acknowledged that the 2009 paper contained “some stupid mistakes” in his handling of the satellite data. “It was just embarrassing,” he said in an interview. “The technical details of satellite measurements are really sort of grotesque.”
https://www.nytimes.com/2012/05/01/science/earth/clouds-effect-on-climate-change-is-last-bastion-for-dissenters.html
Lindzen & Choi (2009) was indeed embarassing. Using their methodology you could get any value of climate feedback you want just be tweaking the start and end dates slightly. The methodology also broached the second law of thermodynamics and they attempted to derive global sensitivity from tropical only data which turns out not to be feasible (Murphy 2000 , Trenberth et al 2010 ) and even more errors were pointed out in Dessler 2011.
As you say, the revised paper was rejected by PNAS, review comments can be read here.
NYT as a reference, snigger!
That’s the BS!
Nor are specious refusals of publications preventing contrary or skeptical science.
Nothing to do with science, everything to do with prejudice and bias.
Super El Nino?
The ONI average over the last 10 years is close to zero.
Show me.
https://www.cpc.ncep.noaa.gov/data/indices/oni.ascii.txt
And this pile of numbers signifies?
It’s the Oceanic Nino Index.
Andy, I can’t replicate your finding regarding the toa net cloud radiative effect. I’m using the CERES file entitled “toa_cre_net”. My results look like this:

Not sure why the very large difference. I’ve checked mine to make sure it’s the sum of the CRE longwave and the CRE shortwave, and it is exactly the same. Mine is area-weighted using the correct oblate spheroid areas, although just using cos(midlatitudes) makes little difference.
Suggestions?
w.
Willis,
I’ll review my work and check it out.
Willis,
You are correct, I had a bug in my code. I fixed it and replaced the figure in the post. My plot is still not exactly like yours. I suspect we are using different input datasets or maybe a different variable. My monthly data has a larger variation than yours.
Andy, what I’m showing is the monthly data with the seasonal variations removed. I’m not showing the raw monthly data as you are doing. My raw monthly data looks much like yours.
So our results are quite close. You are using a 12-month “boxcar” filter, while I’ve used a LOWESS filter, but they give almost identical results.
The remaining minor differences are the result of you not using the area weighting of an oblate spheroid, but instead using the area weighting of a perfect sphere.
My best to you,
w.
Climate is local and changed by variations in flow/surface/slope and rainfall. CO2 is global and cannot change climate. It has never changed climate in the past. It can “bias” the global condition some but even at 2000+ppm it has never altered climate.
The “gain” from variations of CO2 above 60ppm has no power at all over the solar input variation and global seasonal changes. The thin film of oil on the oceans has more effect on climate than any amount of CO2.
Well, the outgoing longwave radiation (OLR) has been rising since 1985, and correlates well with the rising global temperature.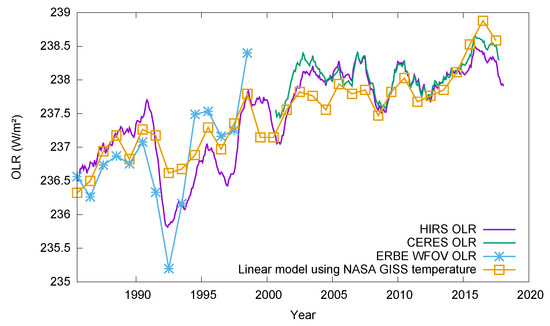
WUWT?
https://www.mdpi.com/2072-4292/10/10/1539/htm
EEI = ASR – OLR. With EEI > 0 and dOLR > 0 that means dASR > 0. There are two main factors that can cause dASR > 0: 1) increase in TSI or 2) decrease in albedo. We know dTSI = 0 or even dTSI < 0 so that means the most likely culprit is a decrease in albedo. This may be an indication that the cloud feedback is positive. Actually that is the conclusion of the publication. The authors call it “cloud thinning”.
Uh, what happened in the 21st Century?
Re forcings and sensitivity,
I keep coming back to van Wijngaatden and Happer.
In their abstract, there is a short sentence “Doubling the current concentrations of CO2, N2O or CH4 increases the forcings by a few percent.”
https://wvanwijngaarden.info.yorku.ca/publications/
Some people try to dismiss their calculations by saying that their ECS estimates resemble those of others from The Establishment.
I do not recall The Establishment accepting that doubling these GHGs will alter forcings by only a few percent.
Can others assist with what they understand the message of the vW&H work to be? Geoff S
Geoff,
I posted separately below (at 8:28 am) before I ran across your post.
We are in resonance on this point!
Read here. CFCs have produced 1/2 the warming since the 80s.
Therefore CO2 cannot be solely responsible for it.
0.85 degree C per doubling, TOPS.
Lindzen and Choi’s Iris Hypothesis is possibly the most important discovery of modern climate science, perhaps worthy of a Nobel prize (in a rational, parallel universe.)
The Iris mechanism is probably an outworking the known phenomenon of emergent thermal homeostasis in a dissipative system containing two or more reaction diffusion systems with different enthalpies.
A Precarious Existence: Thermal Homeostasis of Simple Dissipative Structures | Artificial Life Conference Proceedings | MIT Press
The abstract of Bartlett and Bullock 2016:
We demonstrate the emergence of spontaneous temperature regulation by the combined action of two sets of dissipative structures. Our model system comprised an incompressible,
non-isothermal fluid in which two sets of Gray-Scott reaction diffusion systems were embedded. We show that with a temperature dependent rate constant, self-reproducing spot patterns are extremely sensitive to temperature variations. Furthermore, if only one reaction is exothermic or endothermic while the second reaction has zero enthalpy, the system shows either runaway positive feedback, or the patterns inhibit themselves. However, a symbiotic system, in which one of the two reactions is exothermic and the other is endothermic, shows striking resilience to imposed temperature variations. Not only does the system maintain its emergent patterns, but it is seen to effectively regulate its internal temperature, no matter whether the boundary temperature is warmer or cooler than optimal growth conditions. This thermal homeostasis is a completely emergent feature.
Discovery of the PDO should rank right up there, too. Made by a fisheries biologist, not a “climate scientist” (TM).
El Nino was also observed and named by Peruvian fisherman.
But El Nino and PDO are connected of course.
“Cloud feedback is poorly understood”
There are other important climate factors that are also poorly understood.
The confidence of the climate alarmists is astounding to anyone who understands how science works and has some knowledge of the history of scientific discovery.
“As you can see in Figure 2, very small changes in solar output, 4W/m2 or 0.3% of 1361 W/m2 can make nearly as much difference as all the CO2 emitted to the atmosphere by humans.”
All estimates use the total CO2 in their calculations of which the “human” contribution is a fraction of the total CO2. When I see comments like this I cringe at them, as it implies that natures natural contribution is nothing when we know it’s the vast majority of the CO2.
John Chism,
The CO2 RF in the post is for anthropogenic CO2 only, as calculated by the IPCC in AR4 and AR5. I don’t believe the RF they provide, but I thought it was important information to mention their estimate.
“So, the exact amount of cooling due to the iris effect remains unknown, but there is general agreement that the iris effect exists, results in cooling, and reduces ECS and TCR.”
Actually most studies that have examined the proposed phenomenon found little or no evidence in support and also that the magnitude of the feedback was grossly exaggerated by Lindzen and may actually be positive, that is, a warming rather than a cooling.
“Regardless of definition, the radiative properties are found to be different from those assigned in the original Iris hypothesis. As a result, the strength of the feedback effect is reduced by a factor of 10 or more. Contrary to the initial Iris hypothesis, most of the definitions tested in this paper result in a small positive feedback. Thus, the existence of an effective infrared iris to counter greenhouse warming is not supported by the CERES data.”
Lin et al 2002
Hartmann and Michelson are name-checked above, but no real rebuttal offered…
“It is shown that the negative correlation between cloud-weighted sea surface temperature (SST) and high cloud fraction discussed recently by Lindzen et al. results from variations in subtropical clouds that are not physically connected to the deep convection near the equator. A negative correlation between cloud-weighted SST and average cloud fraction results from any variation in cloud fraction over the areas with lower SSTs within the domain of interest. Therefore, this correlation is not evidence that tropical cloud anvil area is inversely proportional to sea surface temperature and should not be used to infer the existence of a negative feedback in the climate system.”
Rather than ‘general acceptance’ Rapp et al 2005 noted the ‘significant controversy’ around the hypothesis and found no evidence for a negative feedback from the iris effect:
“Defining the effective size of a cloud as the area of cloud divided by the total rainfall from that cloud, this study finds very weak correlations between the effective size and the underlying SST. Examination of the confidence interval of the slopes indicates that the sign of the slopes and correlations is valid. Since the majority of the results shows a positive correlation, this indicates that the interaction between the SST and effective cloud size may even have a slight positive relationship, not the inverse relationship suggested by Lindzen & Choi.”
That is not what they did, in fact they increased the rate of water vapour converted to rain in response to warming, that is they tweaked the model to mimic the iris effect, the result was indeed an increase in negative feedback, but also an increase in the positive effect from less incoming radiation being blocked. The two nearly cancelled out, even in the run with the biggest plausible ‘iris’ effect, climate sensitivity was 2.2C – still within the IPCC range.
So, far from general acceptance, the existence and magnitude of an adaptive infrared iris remain controversial – but don’t take my word for it,
“Nevertheless, it is a subject of controversy to what extent the shortwave feedback compensates for the longwave feedback; some studies also assert that the compensation would give nearly zero net radiative feedback in the iris effect ”
-Richard Lindzen.
The two nearly cancelled out, even in the run with the biggest plausible ‘iris’ effect, climate sensitivity was 2.2C – still within the IPCC range.
2.2 lies in the range of 0.5-2.5 stated in the article:
Depending upon the assumptions made, Lindzen’s iris effect results in an ECS between the purely observation-based 0.5°C/2xCO2 (Lindzen & Choi, 2009) and the model-based 2.5°C/2xCO2 (Mauritsen & Stevens, 2015).
John,
None of the critiques of the iris effect were valid, including Lin’s and the others you mention. The iris effect is well established today. All of this is explained well here:
https://link.springer.com/article/10.1007/s13143-021-00238-1
I don’t need to cover the same ground.
Your Lindzen quote is out of context.
The Mauritsen and Stevens model is still a model, with all the weaknesses of all models. The iris effect observations result in lower climate sensitivity. The only point of mentioning their work is that every run with the iris effect had a lower sensitivity than similar runs without it. The actual numbers that come out of the model have no more meaning than the numbers out of any other model that don’t match reality.
I’m always amazed at you alarmists when you take model results over observations!
“None of the critiques of the iris effect were valid, including Lin’s and the others you mention. The iris effect is well established today. All of this is explained well here”
Hand-waving. And excuse me if I don’t find Lindzen‘s explanation of Lindzen’s hypothesis hugely convincing. If he had valid rebuttals he would have submitted to the journals, with evidence. In fact, when he tried to get a correction to his woeful 2009 paper published, it was rejected for being of poor quality and the review comments included:
The paper is based on three basic untested and fundamentally flawed assumptions about global climate sensitivity:
1) Correlations observed in the tropics reflects global climate feedbacks
2) Their analyses ignore changes over land areas in the tropics. It is well known that adjustment in the atmosphere is over the entire length scale of the tropics (due to the large Rossby radius of deformation).
3) Lastly, the authors go through convoluted arguments between forcing and feed backs. For the authors’ analyses to be valid, clouds should be responding to SST and not forcing SST changes. They do not bother to prove it or test the validity of this assumption. Again this is an assertion,without any testable justification.
There may or may not be an iris effect. If it exists, the net magnitude is negligible. The existence of the hypothesised strong net negative feedback has been effectively ruled out by observations.
“Another argument against the iris comes from my work looking at the cloud feedback in response to short-term climate variability. If the iris provided a strong negative feedback, then we would expect to see it in response to short-term climate fluctuations. Analysis of observations doesn’t show anything like that (Dessler, 2013).”
Andrew Dessler.
In short the assertions that the Iris effect is ‘generally accepted’ and that it lowers ECS are both wrong. There was considerable controversy around the hypothesis and even if it is correct it does nothing to rule out high sensitivity, indeed it may lower ECS. You are also wrong about what Mauritsen and Stevens showed, here is Thorsten Mauritsen
“I would like to point out that even with an iris-effect you can get a high ECS. Andrew Gettelman repeated the experiment with CAM5 and actually got over-compensation from shortwave, i.e. an increase of ECS. This is written in the paper.”
Who to believe, you or the lead author of the paper? 😉
Typo ‘indeed it may lower ECS’ should of course be raise ECS. Apologies.
Whew! Well, we know where you stand on the subject. Obviously, I disagree.
The point of my posts is not to advocate for any particular value of climate sensitivity, we get hints from nature about it, but the climate sensitivity to CO2 has never been observed or measured, only modeled with unvalidated models. Lindzen provides evidence that it might be much lower than the lower bound provided by the IPCC. His case is just as strong as theirs.
We have a few hints from nature, which I am examining in these posts, but no one has any valid or accurate observations of the effect of CO2 on climate or temperature. All the criticisms I’ve seen of Lindzen’s estimate are just as applicable to all other estimates, Climate sensitivity is an unknown.
“but the climate sensitivity to CO2 has never been observed or measured, only modeled with unvalidated models. Lindzen provides evidence that it might be much lower than the lower bound provided by the IPCC. His case is just as strong as theirs.”
False equivalence. Lindzen’s low sensitivity relies on a strong, negative cloud feedback which has never been observed. In fact it was quantified by Dessler (2010) as 0.54 ± 0.74 (2σ) W m-2 K-1, ie more than likely positive or at most weakly negative, insufficient to reduce ECS significantly. And he has never (as far as I am aware) addressed the other issues with the hypothesis, such that this feedback occurs only in the tropics and extending it to the global climate ignores heat transfer in/out of the tropics, which is considerably larger in magnitude than the feedbacks. Even Judith Curry, writing at Climate Audit was critical. And no, these criticisms do not apply to the mainstream studies.
By contrast the IPCC relies on a consistent body of studies, both modelled and from paleoclimate reconstructions. David Middleton lists observational ECS studies in a table upthread.
I dont see anything special in these critiques:
1) Correlations observed in the tropics reflects global climate feedbacks
How many studies extrapolate trends near the poles (which are definitely heavily influenced by oscillations in the seas) to the whole world?)
But you are right, let´s assume that there are possibly strong local phenomena affecting the temperature and be VERY skeptic about global warming mainly caused by anthropogenic CO2!
2) Their analyses ignore changes over land areas in the tropics. It is well known that adjustment in the atmosphere is over the entire length scale of the tropics (due to the large Rossby radius of deformation).
Are you saying that effects like UHI should be considered in publications about global temperature trends? Definitely, you are preaching to the choir here!
3) Lastly, the authors go through convoluted arguments between forcing and feed backs. For the authors’ analyses to be valid, clouds should be responding to SST and not forcing SST changes. They do not bother to prove it or test the validity of this assumption. Again this is an assertion,without any testable justification.
Hmm let´s see about that one.. is there a plausible mechanism how clouds could depend on SST like aww evaporation?
Looks like these 3 points are in no way special for Lindzen´s article but rather usual behavior for such studies! Let´s recall of them!
“How many studies extrapolate trends near the poles (which are definitely heavily influenced by oscillations in the seas) to the whole world?)”
I am not aware of any, could you name one?
But you are right, let´s assume that there are possibly strong local phenomena affecting the temperature and be VERY skeptic about global warming mainly caused by anthropogenic CO2!
Category error. The problem is the iris effect is only hypothesised for the tropics, Lindzen asserted it could be extrapolated globally, but provided no supporting evidence and glossed over the fact the heat transfers in and out of the tropics are several times larger than the feedback he proposed. CO2 is globally well-mixed, not a local phenomenon.
Are you saying that effects like UHI should be considered in publications about global temperature trends? Definitely, you are preaching to the choir here!
Not sure where that came from, but yes UHI should and is considered in global temperature trends and found to be negligible.
Hmm let´s see about that one.. is there a plausible mechanism how clouds could depend on SST like aww evaporation?
A plausible mechanism is one thing, a theory backed up by observations is another. In fact the observations demonstrate that if the iris effect is real, its effects are insignificant.
Looks like these 3 points are in no way special for Lindzen´s article but rather usual behavior for such studies! Let´s recall of them!
Again, could you name another study that attempts to apply tropical feedbacks to the whole globe?
Then we can move on to the other flaws……
Andy May,
Thank you for a good article, but I was disappointed that you gave no consideration to the possibility that CO2, as a greenhouse gas in Earth’s atmosphere, may already be near its asymptotic limit in ability to further affect atmospheric temperatures (i.e., ECS and TCR).
W. A. van Wijngaarden and W. Happer [2020], Dependence of Earth’s Thermal Radiation on Five Most Abundant Greenhouse Gases, (free download available at https://arxiv.org/abs/2006.03098 ) present strong evidence and compelling reasoning that this is the case at the current CO2 concentration level of about 420 ppmv. They conclude that doubling the current concentration of CO2 increases its feedback forcing by only a few percent.
Because ECS and TCR are currently calculated on the basis of a doubling of atmospheric CO2 without consideration of CO2’s likely inability to absorb any significant additional LWIR energy from Earth’s surface, ECS and TCR values are very likely meaningless.
N.B.: The van Wijngaarden and Happer CO2-is-near-total-saturation-at-420-ppm assertion gives us an excellent explanation for why Earth did not experience “runaway” greenhouse warming, and thus the extinction of all life, when Earth previously experienced CO2 levels 8 to 15 times higher than today’s level.
W. A. van Wijngaarden and W. Happer [2020] said that, even with what they called saturation, the ECS was 2.2 K/doubling.
“ Our result of 2.2 K is substantially lower than the value obtained by the pioneering work of Manabe and Wetherald [35] who obviously did not have access to the current line by line information.”
And what did they conclude about TCR, since I’d prefer not to wait the hundreds years or so that it takes confirm ECS values, as Andy May properly notes above in his very first paragraph?
Nick,
And why did you leave out this important caveat/limitation that Wijngaarden and Happer mention in this passage from Page 34 of the referenced document (my underlining emphasis added):
“For the case of fixed relative humidity and a pseudoadiabatic lapse rate in the troposphere, we obtain a climate sensitivity of 2.2 K . . . The issue of water feedback would undoubtedly be greatly clarified if additional observations of water vapor concentration as a function of altitude were available.”
And I’ll take this opportunity to answer the question I asked earlier, having received no response from you yet: Wijngaarden and Happer [2020] make absolutely no statement regarding transient climate response (TCR).
“this important caveat/limitation”
It isn’t a limitation. The limitation is that those are the only feedbacks they consider. You can’t ignore them. Fixed RH is primitive, but it seems it is the best they can do for wv.
“make absolutely no statement regarding transient climate response (TCR)”
So? Do you think they should? How am I involved there?
Sigh . . . the limitation is what I underlined in my previous comment to you. To repeat, Wijngaarden and Happer state “For the case of fixed relative humidity and a pseudoadiabatic lapse rate in the troposphere . . .”
If that is not a specified limitation on their analysis, I don’t know what else would be.
Too small to measure but not too small to imagine. Target fixation can be a very bad thing and scotomisation, the mind seeing only what it wants to see, has nothing to do with measurements but a lot about focus and desire that determine outcome.
The discovery of a lifetime could be missed or the approaching tiger.
We also know the specific heat air to three decimal places. Further, we know that according to that Cp that air will reach the same temperature change no matter what form of energy is the input. The involvement of IR is irrelevant.
What we don’t know is the up dated Cp of air using 400 ppm.
“We also know the specific heat air to three decimal places.”
Well, that might be true for dry air at a specific pressure. However, the specific heat of “air” varies significantly as a function of its absolute humidity, so there is no single value for “the specific heat of air”, regardless of the number of decimal values one wants to discuss.
In need not go into the difference between input energy that results in ionization of one or more of the component gases comprising “air” versus the energy input that results in sensible temperature (molecular translational and vibrational/rotational/stretching modes of storing energy input).
I cannot comment on your last sentence, obviously.
Climate is a far from equilibrium system so ECS is at best a meaningless 1000 year abstraction. Greenhouse gases act immediately on emission so if TCR takes 100 years it is measuring something else for sure, something real slow that we certainly do not understand. Plus we are apparently only seeing the full effect of emissions prior to 1921. Who knew? Actually this is ridiculous.
‘Then too, given that published ECS estimates range from less that 1.0 to more than 5.0 (many CMIP6 models) the only sound conclusion is that we have no idea what is going on. In particular there is no basis for a supposedly prescriptive “carbon budget”.
Agreed
I agree 100%. Todays high temp is not due to CO2 form 2 centuries ago, The suggestion it is is ridiculous.
“The standard ECS, computed from the ECHAM6 model output, is 2.8°C/2xCO2. When the iris effect is added to the model, ECS always becomes smaller, and can fall to 1.2°C/2xCO2 in some scenarios.”
What I see in the paper is
“Together, these mechanisms compensate the strong negative feedbacks associated with longwave cloud radiative effects, so that the resulting reduction of ECS (from 2.8 K to 2.2–2.5 K) is relatively modest (Fig. 3a, Supplementary Fig. 6).”
Nick,
So, how are they contradictory? We are talking about a climate model, it’s not real, just a set of imaginary scenarios. The numbers are meaningless, unless they have a record of predicting the future, which they do not.
It is the direction of change for each scenario that is important. In every case the numbers decreased, including the one you site, the highest scenario. Do not confuse models with data, they are not data.
“The numbers are meaningless”
Andy, you say that a lot. But then you trot out a lot of numbers. It’s very confusing.
C’mon Nick, even you should understand the difference between a modeled number and a measurement. Measurements are real, modeled numbers are not. I should know I wrote and ran petrophysical models for 42 years. If I measured the density of a rock, I knew what it was. If I created a model to estimate the density, without validating the model and the data I used or the parameters I set in the model, I did not know what it was.
I could and did, vary parameters in my models to play “what if” games, the direction that the model output moved as I changed the parameters was useful information, but the modeled numbers themselves were meaningless unless the model had been validated.
“If I measured the density of a rock, I knew what it was.”
Did you really? You may have known the density of that stone in the lab, but you didn’t know the density of a layer of rock under many atmospheres of lithostatic pressure, and possibly at quite high temperature. I bet you modelled that.
I did modelling too, and of mineral processing. The weak spot in our modelling was always knowing actual physical properties like density – well, elastic properties were worse.
But what it comes back to is that you are telling a very confusing story. It is full of numbers, but constantly casting doubt on their meaningfulness.
When we drill wells, we run logging suites. These can be LWD (logging while drilling) and/or wireline. Density logs are one of the most common logs that we run. Density doesn’t vary with depth. Quartz is always 2.65 gm/cm3. The sandstone matrix doesn’t vary with depth.
If density varied with depth, density logs, hence porosity logs, would be useless.
Rock types vary with depth. Rock bulk density varies with depth. This is one of the many ways we know that the mantle petrology differs from that of the crust.
The density of a specific rock sample is the same in the lab as it was when measured in situ by a density log.
Every log described by David is comprised of real observations, not models!
Reality trumps belief, models, estimates and guesses every time.
I think the point you missed is that some numbers are meaningless. To wit, if a scenario is highly improbable, e.g. RCP 8.5, there is no point in even considering it, other than to exaggerate the risk and scare people.
So, how are they contradictory?
Because 1.2 is a different number to 2.2? Just a wild guess.
The modulation of cloud cover as a result of solar activity changes contributed about 0.33 C to the global temperature rise last century (Rao 2011).
At the same time the ~60 year thermohaline cycle contributed a similar amount, about 0.3-0.4 C, due to the choice of the 20thC as the reference period. That’s because the cycle was at bottom at the start of the century and at peak of the following cycle at the end of the century.
Remove that 0.6-0.7 C or so of natural global temperature rise and the residual is consistent with an ECS well below 1 C/doubling. Which is harmless.
Regarding the question of delay between ECS and TCR it seems to me that the rapid cycling of temperature in the ~60 year cycle indicates that ECS and TCR are similar, otherwise we wouldn’t be seeing such sharp temperature changes over decadal timeframes due to the cycle – which should be dampened by the supposed slow climate response.
Interesting, thanks.
Sadly Prof Rao is no longer with us. Not only was he a noted GCR astrophysicist but also the head of the Indian space program for many years.