Reposted from the NoTricksZone
By P Gosselin on 28. March 2021
Share this…
Antarctic sea ice grows 2 million square kilometers in 4 years…
It’s hard to back up the statement: Global warming is global. Some places have seen warming over the past 40 years (e.g. Arctic), but other places have not.
Antarctica definitely has not been playing along with the man-made global warming hoax. (Yes, man has caused some of the warming, but not all – and it certainly isn’t catastrophic).
Antarctic sea ice surges
Though Antarctic sea ice fell to a “record minimum” in 2017 – after having reached a “record high” in 2015 – the latest data from the National Snow and Ice Data Center show sea ice at the South Pole has bounced back robustly since, surging some 500,000 sq km above the mean.

Cropped chart parts, source: NSIDC.
On March 26, 2017, Antarctic sea ice measured 3.055 million sq km. Four years later, sea ice reached 5.103 million sq km. That’s a difference of more than 2 million sq. km., which is an area the size of Saudi Arabia!
No way to ignore natural factors
So why would sea ice grow so quickly? If the ice had disappeared, many would blame it on greenhouse gases – absurd of course. And it would be just as absurd to blame the recent gain on global cooling. Obviously there is a complex array of natural factors at work – factors that climate alarmists consistently have ignored over the past decades.
Here’s the March 26, 2021 satellite photo of Antarctica:

Source: NSIDC
Hamburg spring trending a bit later
One interesting climate anecdote is spring trend in Hamburg, Germany. It appears that Hamburg’s forsythia flowering is occurring increasingly late, according to our friends at Die kalte Sonne here. Also not what we’d expect from “warming”.
The perceived beginning of spring in Germany is when the Hamburg forsythia bush in the city centre blooms. The location at the Lombardsbrücke on the Alster is well suited because the surrounding area has hardly changed in the last 50 years. Phenologist Jens Iska-Holtz dates the flowering date for 2021 on the 25th of March, which is 84 days since the beginning of the year. Over the last 50 years, the following graph emerges:

Fig. 1: Development of forsythia flowering in Hamburg since 1972. The X-axis shows the years since 1972, the Y-axis the flowering date, measured in days after the beginning of the year, i.e. from 1 January.
There has been no significant trend in the flowering dates of the Hamburg forsythia bush on the Alster. The average is 79 days from the beginning of the year. At 84 days, the start of flowering this year was slightly above the average.
Hamburg spring 11 days later since 1990
Next we take the new climate reference period 1991 to 2020 as the period under consideration:

Fig. 2: Development of forsythia flowering in Hamburg since 1991. Note: rising trend line means delay. At the beginning of the observation 31 years ago, the forsythia tended to flower at the end of February, the flowering date moved further and further back into March. The last February flowering was in 2008.
Cooling February
What explains the delay in spring since 1991 in Germany? Global warming? Carbon dioxide?
The month of February is decisive for the forsythia blossom. The corresponding graph from the Hamburg weather station for the month of February shows only a slight cooling since 1988.

.
Fig. 3: February temperatures in Hamburg since 1988 according to original data from the German Weather Service.
Let’s move on to the question of the year since which the forsythia blossom has been delayed:

.
Fig. 4: Since 1985, i.e. for 37 years, the forsythia, the DWD’s flagship shrub for the beginning of spring in Hamburg city center, has shown a slight delay in flowering of 5 – 6 days.
The reason for the rising trend line and thus the delay is probably the warm February months of 1988/89/90 at the beginning of the observation period.
Result: Forsythia flowering has been slightly delayed for approx. 37 years – quite clearly from 36 years onwards – although the shrub is located in Hamburg’s inner city, in a heat island. You will probably look in vain in the media for reports on the delay trend of the Hamburg spring bloomer.
Those who read the Die kalte Sonne [or NoTricksZone] blog will therefore know more.
If there was any ‘Global Warming’ to be observed in reality, it would indeed be “Global”. The search continues.
Antarctic sea ice is always up and down.. not much happening there
But the fact that NATURE shows a later start to Spring, in an urban area, will require some imaginative and fantasy-based explanations from the AGW cultists. 🙂
Nope.
I mean the answers will be fantasy and imaginative, but they will have no trouble creating them.
“The trees are clearly showing trauma caused by the disruption to their normal growth rates by the Man Made damages to the global eco-system. Not only may it be worse than we thought, but it may already be too late!
“Also, how dare you, How Dare You, HOW DARE YOU!”
Greta would agree … https://newtube.app/user/RAOB/xPLyzd4
That is quite brilliant and I have no doubt their BS answer will be something along those lines.
Call them “Climate Liars” on blogs, by text, by email, to your friends, everywhere you can. They are calling you a “Climate Denier” to put you on the defensive. It’s time to put the FU in fundamental freedom of expression.
Climate bedwetters is more appropriate.
those beds are wet from melted “Snowflakes.”
Climate change is causing disruptions in cognitive awareness in major urban areas. don’t ya know
Antarctic sea ice extent yesterday was higher than in the previous five years on that date, and above the normal range, ie two SDs.
It is not above two standard deviations…
.
http://nsidc.org/data/seaice_index/images/daily_images/S_stddev_timeseries.png
.
It is well with in the grey 2sd bands.
Around NORMAL in any meaningful terms
Not much untoward happening down there , is there. !
It should be melting. And the melting should be accelerating. That’s what climate crisis does to ice, remember?
https://nsidc.org/arcticseaicenews/charctic-interactive-sea-ice-graph/
Yesterday Arctic sea ice was above every year from 2015 to 2020, inclusive.
Garsh! You mean weather fluctuates? When did that start? I thought everything happened right on the dot from the beginning of time until humans starting building power plants and driving cars, but since then it’s all been a one-way ticket to Doomsday.
Good posting of actual data by P. Gosselin, as usual. As a resident of central-western Argentina I can report that an even more important statistic, the wine-grape harvest, has been suffering from both late Spring frost and early autumn chills, especially very cold rain.
Grape harvesting data from Portugal exists over a long period, and is quite interesting
.
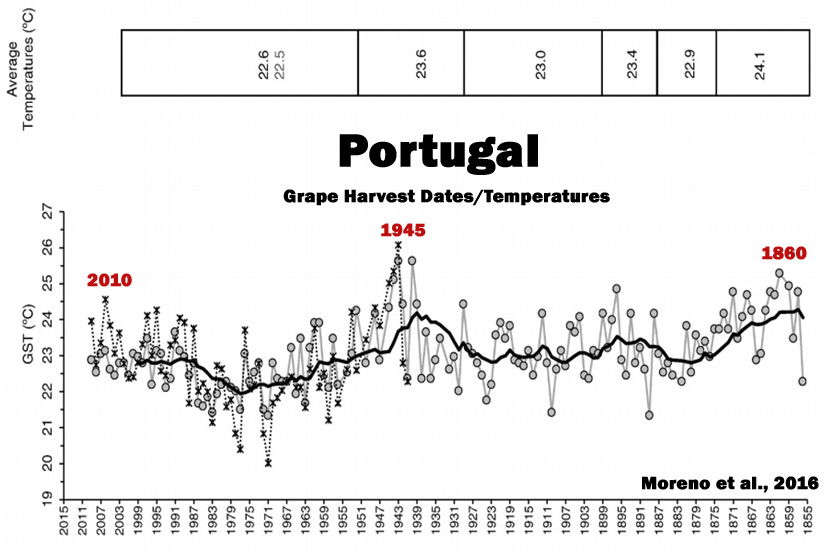
I love this graph and I’m saving it! It speaks volumes. If correct (and there’s no reason to think otherwise) It overrides any damn adjusted temp data – for Southern Europe at the very least.
When you have time Fred, you should dig up as many harvest dates as possible using your good talent for digging 🙂
Antarctic Sea Ice Grows 2 Million Sq. Km – Area As Big As Saudi Arabia. And: Hamburg Spring Arriving Later
This got me to wondering what our bastions of truth were saying. The BBC is remaining tight-lipped, the only recent (March) article Auntie has gives a rather different angle:
Antarctic seafloor exposed after 50 years of ice cover https://www.bbc.co.uk/news/science-environment-56424338
The Grauniad is similarly silent, the most recent news came in January:
Global ice loss accelerating at record rate, study finds
…the melting of the Greenland and Antarctic ice sheets [is] speeding up the fastest, research has found.
The rate of loss is now in line with the worst-case scenarios of the Intergovernmental Panel on Climate Change
https://www.theguardian.com/environment/2021/jan/25/global-ice-loss-accelerating-at-record-rate-study-finds
It’s hard to back up the statement: Global warming is global. But full marks to the Guardian for a valiant and rather unhinged effort.
In the please donate money blurb at the foot of the page is this little gem…
…millions rely on the Guardian for independent journalism that stands for truth and integrity.
The Guardian’s truth, that is.
Yeah funny isn’t it, CNN BBC Guardian etc etc, all advertise themselves as the world’s most trusted, its like black is white war is peace male is female etc, these people live in an alternate reality.
“Antarctic sea ice grows 2 million square kilometers in 4 years…”
This is because Antarctics is melting.
It is like an icecream ball on a hot road
The melting icecream is spreading before it turns to water
We all are doomed!
I assume that is a joke??
No, but the MWP from a thousand years ago, that was definitely global /sarc.
As most actual evidence shows
Yes. See this Nature article showing it stretched from the Northern Hemisphere to Australia, for instance.
https://www.nature.com/articles/s41598-018-22766-z
And in Chile
.
And in the South East Pacific..
Your Chile graph shows it was cold from around 1200 for a few hundred years. The Nature report says it was warm in Australia from around 1130 – 1392.
SO WHAT !
Your graph suggests during much of the MCA and LIA Chile was cold when Australia was hot, and hot when it was cold.
You really seem to be quite the ignorant twerp
Warmer period in both graphs around 100 years ago.
Wrong room, wrong floor, wrong hotel… stupid ignorant bellhop !!
You’re comparing two graphs both showing temperature reconstructions in Chile. I was comparing Chile with Australia, specifically the data from https://www.nature.com/articles/s41598-018-22766-z which started this debate.
.
WOW.. Loy-dodo gets something correct.
Totally by accident !!
Sorry Fred, but I beg to differ. She did put a sarc tag on it, thereby keeping intact her 100% record of looking like an idiot in public.
Yep, Loy-dodo’s /sarc comments are the only thing he/she/it gets correct.
Not more of that Eurotrash stuff?
Really?
Evidence that not ?
The modest warmth we see at present couldn’t possibly be due to whatever natural forcings that created much greater warmth during the mid-Holocene, Roman Optimum, Medieval Optimum, etc, poorly understood though they may be. Gotta be CO2, huh Loy?
LoyD’oh,
You’ve been schooled on this before. Red is a study that found warm conditions, blue found cool conditions. The other colors are for wet or dry. Notice how studies that found warm conditions OVERWHELMINGLY outnumber the studies that found cool conditions and it’s across the entire globe.
https://www.google.com/maps/d/viewer?mid=1akI_yGSUlO_qEvrmrIYv9kHknq4&ll=-3.81666561775622e-14%2C38.03818700000005&z=1
You have a choice, either believe in the known liar, Michael Mann, or believe the hundreds of other researchers that represent many different disciplines who collectively found that the MWP was global. What’s it going to be, LoyD’oh?
It doesn’t matter if the MWP was global or not. What matters is whether the models can simulate persistant regional change or not in their control runs. And they can’t. Or at least there is no evidence I’ve seen to suggest that any model ever produced a habitable Greenland, for example.
Nice work, as usual. Only wish, Charles, that you didn’t always feel compelled to add things like, “(Yes, man has caused some of the warming, but not all – and it certainly isn’t catastrophic).”
We all here, I imagine, know that that “not all” is miniscule (if any), but anyone who comes here who doesn’t already know that would imagine that you mean “a majority” or some large part. And any actual warming is not only NOT “catastrophic,” but beneficial, as is / would also be any rise in CO2 levels.
I don’t think that comment was made by Charles. It’s a quote from the linked article.
You’re right … my bad, thanks for the heads up. Still, I’d rather he not simply link to it without comment, which gives the appearance of agreeing in toto. And I shouldn’t say “always” … that is just my frustration showing.
Yes. It seems the warming up of earth is not symmetric. In this respect I did expect to see more ice in the Antarctic.
https://breadonthewater.co.za/2021/01/26/am-i-a-climate-denier-denialist/
I am not sure why I got a -6? Can anyone please tell me?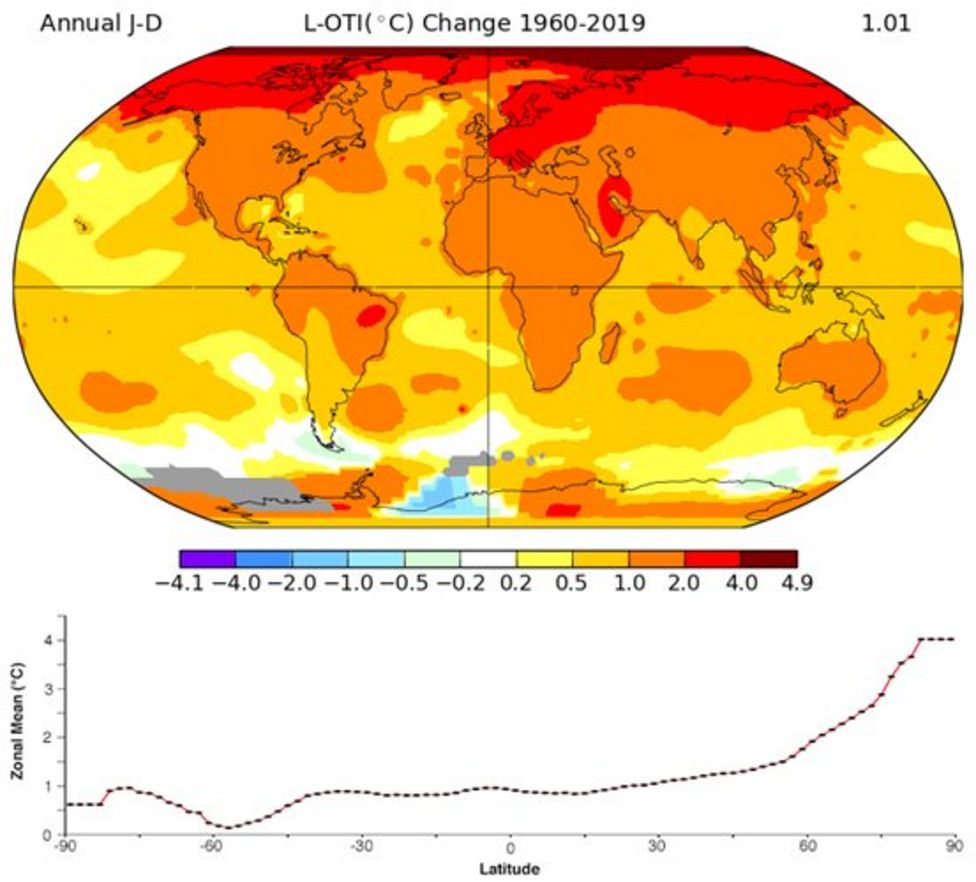
Surely the heat come from the north and is going south?
Can anyone tell me what the alarmists’ ultimate threat of CO2 is? I mean are they suggesting that the Earth will experience a runaway greenhouse event, are they suggesting that it will only cause average temperatures to rise slightly? I have looked and I can’t quite figure out what their ultimate threat is supposed to be.
Thanks for the help!
Jay
Once the earth has warmed enough and the atmosphere poisoned enough, interdimensional aliens will start sending cloned monsters through a space-time rift to destroy us, forcing us to build giant robots to fight them.
There was a documentary called Pacific Rim on this some years ago.
Very entertaining.
As near as i can tell, that is the only real threat
” I have looked and I can’t quite figure out what their ultimate threat is supposed to be.”
All manner of horrors.
Reefs dying
decades of drought
wide spread desertification
biblical rainstorms
sea level rise which swallows all coastal cities
statue of liberty floating away
mass extinction
heat waves of death
bone chilling cold
sharks swimming the wrong way
Mass migration (to cooler zones presumably)
Human starvation
Apocalyptic firestorms which even burn solid rock – yeah I’m talking real hot!
World war
Local wars
Family wars
Lots of crying
lots of swearing
lots of sweating
Insect armageddon
Frogs falling from the sky
Cats sleeping with dogs
That kind of thing….
It’s a good idea to notice the small things, too, such as a fly showing up on the front steps, just because it was a warmish day, e.g., above 45F. Then the temp drops to barely 35F overnight, the chill comes back and the fly is gone. It’s just weather, spring weather, which bounces back and forth and then settles in by mid-April.
Still, I have seen early leaves arrive and stick around in mid-March and the weather just warmed up a little more each day. It’s just weather, seasonal changes and nothing else.
If the weather stayed cold until Memorial Day, as in the 40s day-time, I’d be concerned about it, based on my location, because that is not normal. One year is a fluke. Ten years of it in a row – not a fluke. There’s no ‘on-off’ switch in climate change.
Is anyone monitoring the gas discharge volumes of active volcanoes like Etna. There’s a bunch at work now, including the newest in Iceland: Bob the Baby Volcano, on the mid-Atlantic ridge. He has a lot of fans watching him.
That’s the whole reason we average 30 years of weather (or more) before we call it “climate”. The whole idea that climate causes weather is backwards and conceptually misleading.
Thank you, DMacK, for that feedback (NO sarc here.)
It’s as obvious to most of us that seasonal changes are nothing but seasons, and have little to nothing to do with climate or its changes.
I guess (hope) we who do not worship at the silliness table will be better off in the end.
Might as well go big here. Arctic Sea Ice extent yesterday was above that for the same day in 2005, 2006, 2007, and 2015 – 2020 inclusive.
Phew, I’m sure Guardian readers and BBC watchers everywhere are breathing huge sighs of relief.
Re Antarctic sea ice: The UAH satellite temperature data shows, that for the 42 years of monthly lower troposphere measurements, the Antarctic zone has had a slight but not statistically significant increase in temperature. Heading North through the Southern Extension, Tropics, Northern Extension and Arctic zones gives a steady rise in the rate of increase of temperature to the maximum of 0.25 deg.C per decade in the Arctic zone.
This is to be expected given that the land area predominates in the Northern Hemisphere and the ocean area predominates in the Southern Hemisphere. For the same heat input from the Sun over both hemispheres, the temperature will be higher in the Northern Hemisphere due to the difference in heat capacities of the land surface in the North and the ocean area in the South.
As there has only been a minor difference in the CO2 concentration from South to North, perhaps the temperature is merely reflecting a return to a median after the Little Ice Age. It certainly cannot be increasing due to an increasing CO2 concentration because the ‘back-radiation’ from the atmospheric CO2 absorption bands is less that 9% of the Earth’s emitted radiation (for an average surface temperature of 15.5 deg.C) and 99.8% of that is in the 15 micron band which is the peak radiation from a surface at -80 deg.C. The temperature of a surface can only be increased by receiving radiation from a hotter source, that is, greater than 100% of the Earth’s emission with a peak less than the 10.044 micron peak from a 15.5 deg.C surface so definitely cannot be any warming due to CO2.
Remember there is nothing magical about ‘back-radiation’, everything around you is radiating heat in accordance with its temperature. You do not feel any heat unless the surrounds are hotter than you.
The Antarctic Peninsula is one of the fastest cooling places in the world lately. Pepperidge Farm remembers when the AP was the poster child of global warming doomaghedon.
That’s widely accepted, isn’t it? Even the IPCC has stated this much (see paragraph 4 here): https://archive.ipcc.ch/publications_and_data/ar4/wg1/en/faq-3-1.html
However, all the global surface (and satellite) temperature data sets show that more regions have warmed than have cooled, meaning there has been an overall increase in average global temperature over the various periods of measurement.
A possible slight delay in the flowering of fosythia bushes in Hamburg is a pretty weak retort to the various temperature observations.
Depends upon when you start your time series. The trend from the Holocene Optimum is down. Ditto from the Egyptian, Minoan, Roman and Medieval Warm Periods. Likewise in the US since the 1930s. Probably globally as well, but data are missing or have been fudged.
Starting from the Little Ice Age Cool Period, or the cooling cycle of 1945-77 within the Modern Warm Period, of course will show a warming trend. But slight and not the least bit out of historical norms.
Natural fluctuations swamp whatever negligible effects at local and regional scales there may be from human activities.
The period 1945-77 is 33 years long (inclusive). There have since been 43 full years starting 1978, with statistically significant warming in all global data sets over that period. If the cool period 1945-77 is part of a cycle then that cycle is running a little late.
Also, NOAA shows a trend of +0.17C per decade warming in the US since the 1930s, with each full decade from 1981-90 onwards being warmer than 1931-40. The warmest full decade on record for the US lower 48 was the one just ended, 2011-20 (+0.96C warmer than 20th century average, compare to +0.34C for the 1930s).
.
Only after MASSIVE data adjustments
REALITY is that the 1930s,40s in the USA were almost certainly WARMER than now
Those are summer temperatures. The trend I refer to is for annual average temperatures, as I stated.
Actual MEASURED temperature tell a different story
Measured temperatures do not take into account known biases introduced by such things as UHI and especially Time of Observation. The second chart shows Texas only, not the entire US and, again, it uses data that has not been processed to remove known biases.
As stated, I was referring to the official NOAA annual average temperature data for the lower 48 US states. Not summer only; not Texas only; and not unadjusted only.
Possibly, although another explanation could be that Forsythia bushes have greater brain power than climate “scientists” when it comes to measuring temperatures out there in the field or even in an urban heat island.
Given my opinion of the brain power of climate “scientists”, I’m leaning towards that as the explanation.
It doesn’t count since it’s not within the Arctic theme. /sarc
Its only a couple of Wadhams, nothing to see here.
It’s too late to tell the Canadian Supreme Court members to get their facts straight. Keep the blinders on.
A Supreme Court ruling affirming Canada’s carbon tax opens the door for a startup explosion (yahoo.com)
Another link with a little less BS, maybe
Trudeau’s Carbon Tax Upheld by Top Court, Cementing Green Agenda (yahoo.com)
All BS all the time.
As the SC judgement stated that its ok to renovate the constitution due to climate crisis, i think they should be challenged to prove “climate crisis” in court, an impossibility
A maple syrup producer in Quebec’s Eastern Townships said today on CBC that the start of the sap run is getting later by 3 weeks over the last 15 years. This year is a disaster.
My observation agrees with this. When my younger son was courting his now wife they called us out to the summer house to hear the sound of frogs calling (mating). the next morning, Feb. 22nd 2000, we found loads of frogspawn in our pond. This year, whilst re-modelling our garden for us, he called us out to see a football sized amount of frogspawn in the same pond. Date 23rd March. Four weeks and a day later..
So air has warmed a little bit, increasing evaporation (on average) and increasing cloud cover (on average), causing later blooming due to a lack of that photosynthetic fuel, sunshine. Never to worry, AMO is headed cooler, the sea surface will cool down a degree or so, slightly cooler but less cloudy air will be advected over Hamburg’s forsythia once again.
Is this the end of winter conditions in the US? My advice is to hold off on planting.
Have a look at Europe / Germany
We can work together. We broadcast on the same wave.
In late February and early March, the stratospheric polar vortex was reborn in the Northern Hemisphere.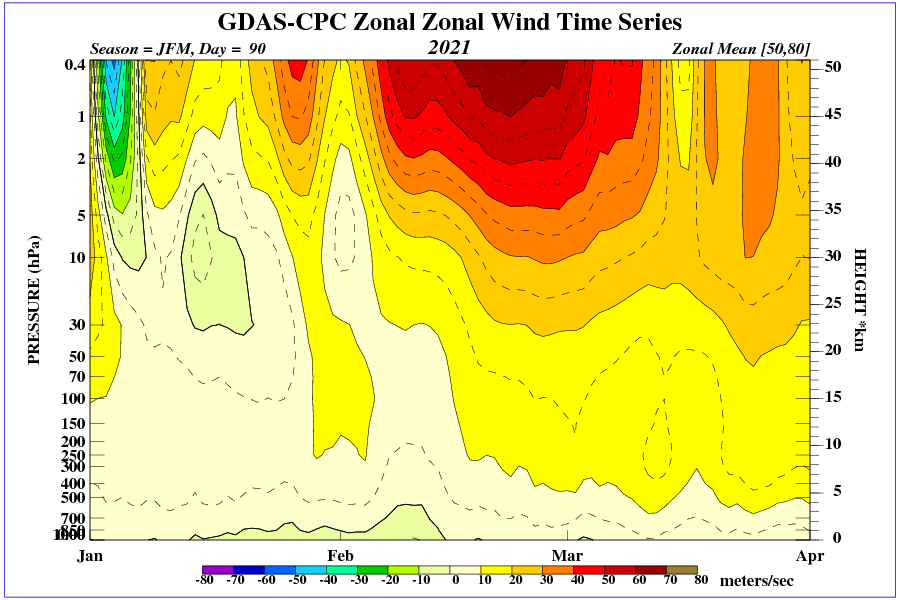
Temperatures above the 80th parallel are holding to the 1958-2002 average. Strong fluctuations the sea ice extent can be seen since 2006, when solar magnetic activity collapsed.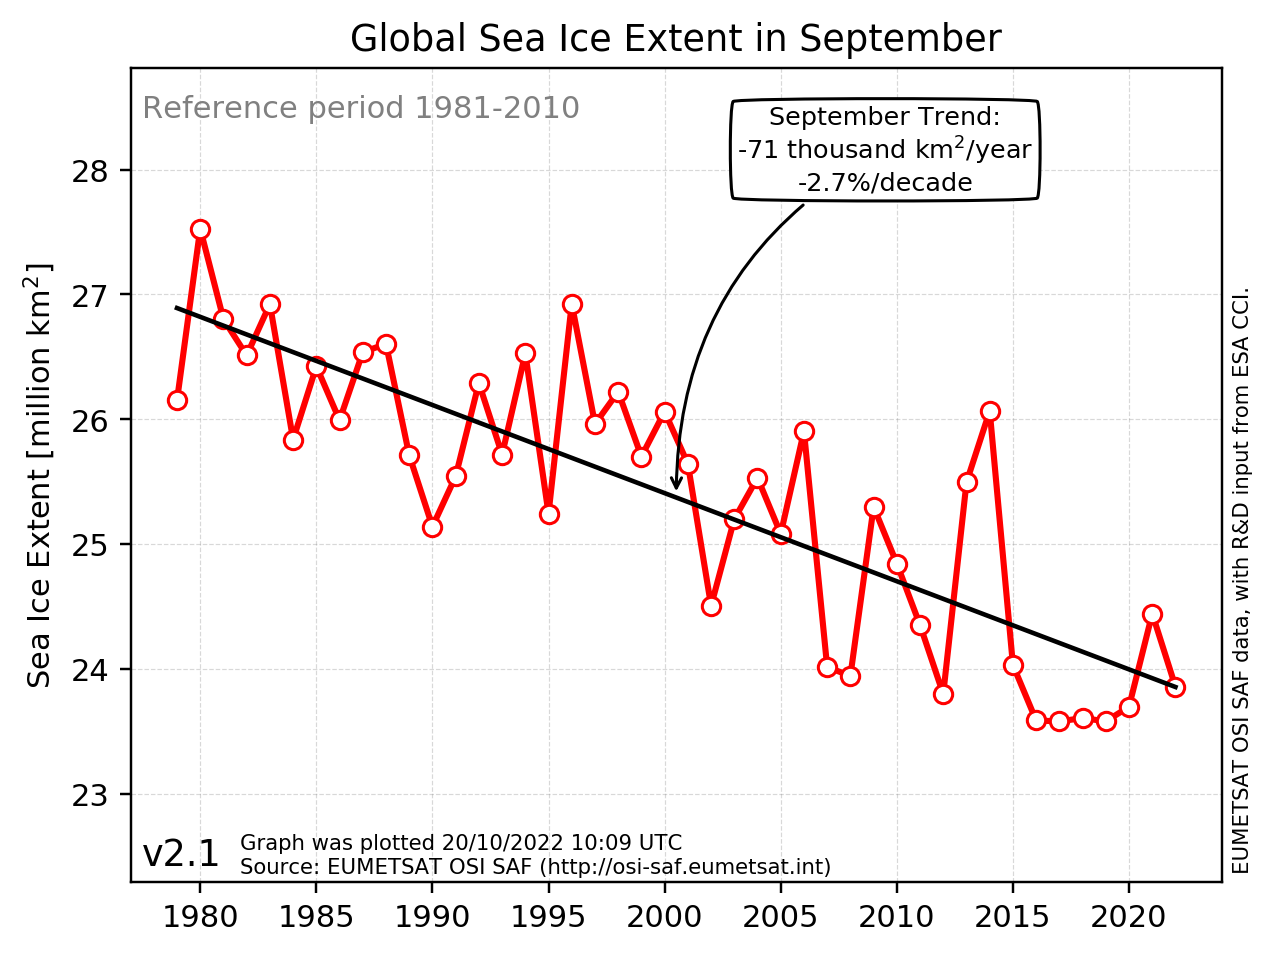
http://ocean.dmi.dk/arctic/plots/meanTarchive/meanT_2021.png
You may be watching a snowstorm on the Canada-U.S. border.
http://tropic.ssec.wisc.edu/real-time/mtpw2/webAnims/tpw_nrl_colors/namer/mimictpw_namer_latest.gif
its a monster. Spring break for my kids, can’t really travel so we went to the lake house south of swift current. Cabin is swaying, visibility less than 100′, nasty bugger of a storm
From the NOAA website updated Feb 26/21– How does sea ice affect global climate
“… Even a small increase in temperature can lead to greater warming over time, making the polar regions the most sensitive areas to climate change on Earth.”
How does sea ice affect global climate? (noaa.gov)
I assume it is sensitive in only one direction!!!!!!
About Sea Ice
Warm tropical currents remove sea ice. Ice that is pushed into the warm tropical saltwater currents from the tropics thaws and chills the ocean currents to below freezing and sea ice forms. When there is not enough ice on the land to push ice into the ocean currents, the evaporation and snowfall with warm water close to shore rebuilds the ice on land. When the ice is sufficient more ice is pushed into the water and sea ice forms and turns the ice machine off. This is a natural dynamic cycle. Sea ice must be removed to rebuild land ice. This process is self-correcting
This works
the same in the Arctic and in the Antarctic. The cycles are not the same
magnitude and are not in phase with each other. and they do not have the same cycle
times.
Without warm times with no sea ice, there would not be sequestered ice in Polar Regions.
Proof of this is recorded in Ice Core Records. Warmest times have most ice accumulation and coldest times have least ice accumulations. Warm times with less sea ice correlate with more ice accumulation. Cold times with more sea ice correlate with less ice accumulation.