If you thought he cold last month was “unprecedented” and ” worse than we thought” you’d be right. Last month’s polar outbreaks in the United States caused record subzero temperatures, power outages for millions of homeowners in Texas when wind energy failed, and more than two dozen deaths.
It was also the coldest February in over three decades. Two different metrics of temperature measurement from NOAA agree in demonstrating that we really could have used some “global warming” but there was none to be had.
The event was mainly due to the “Polar vortex”, which blasted the coldest air across central U.S. from the polar region in more than 30 years. At the same time, Alaska experienced its coldest February since 1999. The main driver for the weather across the contiguous U.S. during February was a strongly negative Arctic Oscillation (AO) during the first half of the month. This may have been the result of a sudden stratospheric warming event that occurred in January. The negative AO pattern favors a cold air outbreak over the central U.S., often referred to as the “polar vortex”.
The National Oceanic and Atmospheric Administration (NOAA) officially reported that during February, the average contiguous U.S. temperature was 30.6°F, 3.2°F below the 20th-century average. This ranked as the 19th-coldest February in the 127-year period of record and was the coldest February since 1989.

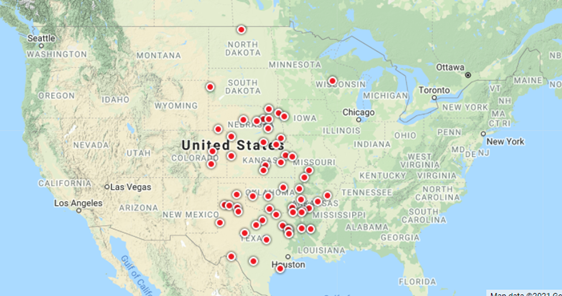
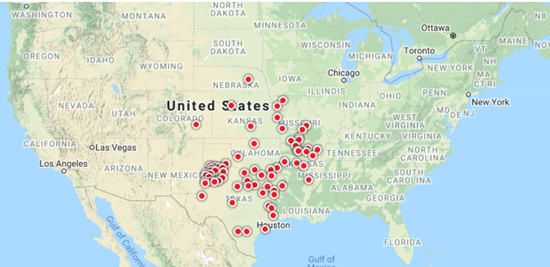
Based on preliminary data, 62 all-time daily cold minimum temperature records were broken from February 11-16 and 69 all-time daily cold maximum temperature records on February 15-16.

Several locations across central Texas, including Austin and Waco, broke records for the longest freezing streak with temperatures below freezing between six and nine consecutive days from February 10-19.

At the same time, another metric, the U.S. Climate Reference Network (USCRN) reported even colder results than the data from the highly compromised weather station network operated by NOAA. While the USCRN uses state of the art measurement systems and is far removed from Urban Heat Island (UHI) it is seldom used in press releases by NOAA.
The USCRN shows a -4.32°F negative deviation in the average US temp anomaly for Feb, 2021 which is -1.12°F colder than NOAA’s problematic and biased surface temperature network. A quick scan of the data shows this to be the highest magnitude monthly temperature drop since the start of the USCRN network in 2005.

While this coldest February on record for over 30 years does not disprove the claim of “man-made global warming,” it does show that the warming is so minor that an area the size of the ENTIRE United States can still set a “coldest ever” record for a time period for as long as a full month.
This event is a strong indicator that nature, not man-made emissions, is still the deciding factor in temperature.
USCRN – UAH USA48
Pristine surface data vs Satellite difference.
Is Roy getting a “warming” satellite drift he is not properly accounting for, as Rick has suggested ?
Does anyone have a link to the Climategate quote by Phil Jones that “if it turns out to be cyclical, they’re going to kill us” or something like that? I Googled, but that was like talking to a door.
I think that was Tommy Wils, when asked what will happen if all this turns out to be bogus he said “we’ll likely all be ki!!ed”
1989, I recall snow on the ground in Charleston, SC
Don’t worry. Bill Gates has all weather events covered in his new book.
You know, I suspect that was shadow-written. I believe he’s too busy elsewhere building his Weather Dominator.
I thought he was working with the ChiComs on their next corona virus! Don’t they have to build another lab now that everyone is onto the Wuhan Biological Warfare Center?
Um, the press and Democrats (I repeat myself) are doing everything they can to deflect attention away from the Wuhan lab. Fauci still wants to fund it, even, and no doubt they will – probably the most insane thing from the whole China virus ordeal, to be honest.
And the AMO is just getting started in that 60-year downcycle with irregular cycle amplitude.
A multi-cycle solar minimum, PDO, and ENSO help in the short run. I suggest a collection of natural anti-depressants and good exercise to deal with the visions and policy distortions of having to watch the Climate Maginot Line being built for warming. It does give you a very real, upfront and personal look into the historical situations of people dealing with religious orthodoxy or wrongheaded build up to wars.
I would much rather see the record cold in the Northeast so we can watch John Holdren tell them it’s caused by global warming. There will be a next time with all these cycles lining up for more cold.
I look at this routinely, but last time I checked Feb wasn’t up yet. I figured it would show a dip.
but somehow the great lakes could only muster 46% ice coverage. of course, the people doing it had already predicted the 30% also predicted by their models.
uhh yeah.
Nine years left…
The plot shows no warming over the past 15 years. Who from NOAA released that! They should be fired for exposing to the world that there has been no warming in the US since 2005. John Kerry, you know anything about this?
I’m tempted to say: so what?
One swallow doesn’t make a summer and one bad winter is not that unusual. If you look at the temperature records over the last 200 years there have been many months in many countries where the average temperature was extremely low. In most northern latitudes extreme lows in winter are much more extreme than extreme highs in summer. The only thing that matters is the long term trend. You need at least 150 years of data to see this and most are stable.
This NOAA data on US temperature anomalies looks similar to temperature and (inversely) ice mass data from Greenland:
https://notrickszone.com/2021/03/10/danish-institute-data-greenland-ice-melt-has-slowed-down-significantly-over-past-decade/
Here’s the other one
People are really missing the point with all these various temperature charts. CO2 is 415ppm at all locations, and yet temperatures in the US are wildly different than in Europe and Australia. You have temperature differentials between N and S Hemi, the top 1/3, middle 1/3 and bottom 1/3, you get temperature differentials between the Poles. CO2 can’t be causing those temperature differentials. Identify a location that isn’t impacted by the UHI effect or Water Vapor and you will find no warming. Simply look at the Desert Locations.
Alice Springs (23.8S, 133.88E) ID:501943260000
https://data.giss.nasa.gov/cgi-bin/gistemp/stdata_show_v3.cgi?id=501943260000&dt=1&ds=5
Facts are, fewer clouds leads to warming, and somewhere there are fewer clouds to the warmists simply find those locations and report it as CO2 driven warming.
Moscow has 3 stations, all exposed to 415 ppm, and yet only one shows warming. How can that be if CO2 causes the warming?
Moscow U Of I (46.7281N, 116.9558W) ID:USC00106152
https://data.giss.nasa.gov/cgi-bin/gistemp/stdata_show_v4.cgi?id=USC00106152&ds=14&dt=1
Moscow (35.0711N, 89.4117W) ID:USC00406274
https://data.giss.nasa.gov/cgi-bin/gistemp/stdata_show_v4.cgi?id=USC00406274&ds=14&dt=1
Moscow (55.8331N, 37.6167E) ID:RSM00027612
https://data.giss.nasa.gov/cgi-bin/gistemp/stdata_show_v4.cgi?id=RSM00027612&ds=14&dt=1