Reposted from Chris Martz Weather
BY CHRIS MARTZ on
“By failing to prepare, you are preparing to fail.”
— Benjamin Franklin
Meteorological Analysis
Three weeks ago, a major cold snap and series of winter storms enveloped the southern plains and parts of the Mississippi River Valley, sending temperatures below zero as far south as central Texas. According to NOAA NCEI, a total of 8,632 daily record low temperatures — including both maximums and minimums — were set or tied from February 10-20, as opposed to only 262 daily warm records.¹ Additionally, a whopping 693 monthly record lows were set, 199 of which were all-time record lows. According to the NOAA Weather Prediction Center, over 30% of all of the official weather stations in the United States set at least record low maximum temperatures between February 14 and 16. Without a doubt, this was the coldest 10-day period that this part of the country had experienced in over a century. The animation below conveys just how widespread the cold was between February 10 and 20 (Figure 1).²

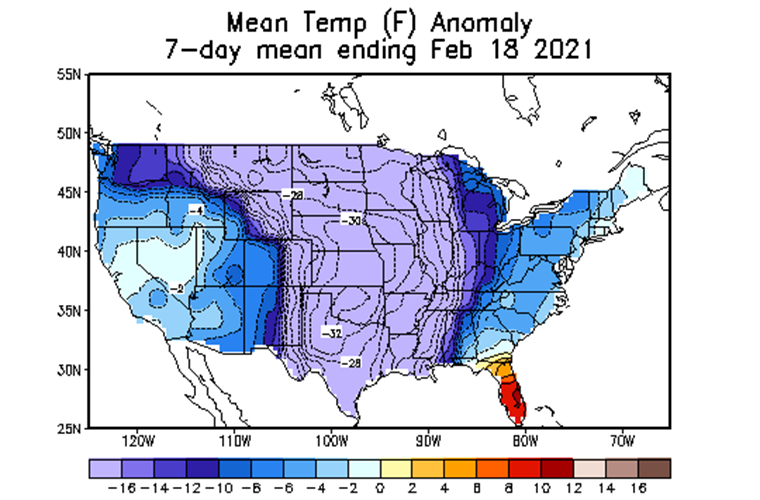
While no statewide records were broken, some of the records that were reported were quite shocking to say the least. The two coldest days were Monday, February 15 and Tuesday, February 16, where temperatures were some 40-50°F below average across Oklahoma and Texas. Between February 11 and 18, temperatures across much of the Heartland averaged some 30°F below average (Figure 2).³ Temperatures this cold for such a sustained period can lower the monthly and seasonal average by a wide margin.
On Monday, February 15, Oklahoma City only rose to 4°F (-15.6°C), which was colder than the daily record low of 7°F (-13.9°C) set in 1909!⁴ San Angelo, Texas dipped to a bone-chilling -1°F (-18.3°C), which tied with December 29, 1983 and February 2, 1985 for the city’s second coldest temperature, only behind the reading of -4°F (-20°C) set on December 23, 1989.⁴ That was also the only subzero reading for the date, smashing the old record of 16°F (-8.9°C) from 1909.⁴ Houston, Texas dipped to 16°F on Monday the 15, which was their coldest temperature since December 24, 1989, when it plunged to 11°F (-11.7°C).⁴ That also broke the old daily record of 18°F (-7.8°C) from 1918.⁴ Kansas City, Missouri plunged down to -10°F (-23.3°C), breaking the old record of -6°F (-21.1°C) from 1936, while the high of -1°F smashed the old record of 8°F (-13.3°C) from 1900.⁴ According to the local National Weather Service office, a wind chill of -32°F (-35.6°C) was recorded, the coldest wind chill there since 1989.
The following morning, Tuesday, February 16, even more notable record lows were set. Oklahoma City once again set a record low, this time falling to a jaw-dropping -14°F (-25.6°C), which not only obliterated the old daily record of 4°F (-15.6°C) set in 1903, it was the coldest reading there in over 120 years, only second to the -17°F (-27.2°C) recorded on February 12, 1899.⁴ Oklahoma City also recorded its longest stretch of temperatures at or below 20°F (-6.7°C), at 210 consecutive hours, surpassing 1983.³ Meanwhile, Tulsa dropped to -13°F (-25°C), tying the city’s coldest temperature on record, originally set on January 12, 1918.⁴ Dallas, Texas even dipped to -2°F (-18.9°C), which matched January 31, 1949 for the second coldest temperature ever recorded there, just behind February 12, 1899, when it dipped to a bone-chilling -8°F (-22.2°C).⁴ Tyler, Texas broke their all-time coldest temperature of -3°F (-19.4°C) from January 18, 1930, dipping to six below zero.⁴ Hastings, Nebraska tied their all-time coldest temperature of -30°F (-34.4°C), originally set on January 12, 1912.⁴ It also obliterated the old daily record low of -13°F set in 1979.⁴ In Arkansas, Fayetteville fell to -20°F (-28.9°C), which not only anihilated the old record of 7°F from both 1958 and 2007, it was their all-time coldest temperature, and only nine degrees short of the statewide record set on February 13, 1905 in Gravette.⁴
Perhaps the most impressive record that was set was in Bottineau, North Dakota, approximately ten miles from the Canadian border. On the morning of February 13, the mercury dove to an incomprehensible -51°F (-46.1°C), which not only crushed the previous daily record of -37°F (-38.3°C) from 1936, it also broke the town’s prior all-time record low of -50°F (-45.6°C) set on February 3, 1893, a record that stood for over 128 years!⁴ This reading was only nine degrees off the statewide record, set on February 15, 1936 in Parshall.⁴ Other impressive readings were temperatures as low as minus 20° as far south as northern Texas.
Now that we have flipped the calendar to March, to really shed some light on how large of an impression the Arctic outbreak had on the monthly outcome, last month was the coldest by departure from average in the Continental United States since December 2000 (Figure 3) and third coldest since December 1989.

Major cold snaps that impact the southern plains all share similar characteristics with respect to their meteorological evolution. While the event itself was arguably predictable with moderate confidence as early as two weeks out, something my friend meteorologist Joe Bastardi over at WeatherBELL.com was very bullish — and ultimately correct — on from over ten days out, the threat for such cold became elevated within weeks following the sudden stratospheric warming event which was the primary cause of the stratospheric polar vortex (SPV) displacement.
The term polar vortex has become a part of everyday vocabulary after broadcast meteorologists and journalists began using it during the winter of 2013-14. What many people don’t know is that each hemisphere actually has two polar vorticies: the stratospheric and its tropospheric counterpart (Waugh et al. 2017).⁵
The knowledge of a stratospheric circulation has been known since the 1940s, and has been referred to as the polar vortex since at least the 1950s (e.g. Brasefield 1950, Palmer 1959).⁶ ⁷ While the tropospheric polar vortex (TPV) exists all year, the stratospheric circulation only exists from mid-late autumn through mid-late spring (keep in mind seasons are opposite, respective of which hemisphere) (e.g. Waugh et al. 2017).⁵ It forms as thermal gradients tighten between the mid-latitudes and poles, which occurs due to a lack of solar heating (e.g. Waugh et al. 2017).⁵ As the air becomes colder, the temperature difference (gradient) between the poles and mid-latitudes increases, which causes westerly winds in the upper levels of the atmosphere to begin cranking in an attempt to balance the energy differences.
The SPV is generally circular and fairly symmetrical in nature, unlike the TPV. This is because land-sea contrasts and topographic influences aren’t as pronounced in the stratosphere. The TPV, like its stratospheric counterpart, is strongest during the winter and is weakest during summer and exists due to thermal gradients (e.g. Waugh et al. 2017).⁵ Planetary Rossby waves, which form in highly baroclinic environments, if strong enough, can affect the symmetry and structure of the SPV (e.g. Waugh et al. 2017).⁵ Rossby waves strong enough to propagate upward into the stratosphere and cause a deceleration or even reversal in the westerlies typically form as air flows over mountains and rough terrain (e.g. Charney and Drazin 1961 and Limpasuvan et al. 2004).⁸ ⁹ Deceleration or reversal in the westerlies surrounding the polar vortex often initiate a sudden stratospheric warming (SSW) event, which can cause the polar vortex to either be displaced or even split into two or three vortices. If either of those two things occur, that energy propagates down into the troposphere and subsequently causes the TPV to do the same.
You can see the distinct differences between the two vortices in the schematic diagram below from Figure 1 in Waugh et al. 2017 (Figure 4).

Sudden stratospheric warming events, by and large, occur much more frequently in the Northern Hemisphere than in the southern, simply because there is more land-sea contrasts and mountainous terrain in North America than in Antarctica. In fact, there have been only two documented occurrences of it occurring over Antarctica; once in 2002 and more recently in 2019. While major stratospheric warming events don’t occur every year, it is not uncommon for them to occur every 2-3 years.
As I mentioned above, we did observe a sudden stratospheric warming event back in early January. As early as mid-December, I highlighted this as something that could very likely occur in early January. A time-based vertical cross-section of atmospheric temperature anomalies from the surface to the very top of the atmosphere averaged along 60°-90°N latitude is shown below (Figure 5). Time is on the x-axis while air pressure (hPa) is plotted along the y-axis alongside height in altitude (km). Pressure levels are plotted because air pressure decreases exponentially with altitude. 1000 hPa of air pressure, for instance, is on average, found at the surface and an average air pressure of 500 hPa is found at approximately 5.4 km. The shaded areas within the plot are temperature anomalies with respect to time and altitude. The early January warming in the stratosphere is clearly visible on the far upper left, as denoted by the deep orange and red shading, and as time progresses, that energy transfers down to the mid-levels of the atmosphere and surface, which reinforced the already-existing high-latitude blocking pattern, which then caused the TPV to become displaced into Eurasia in mid-late January.

While not all sudden stratospheric warming events cause a disruption to both the stratospheric and tropospheric polar vortices, there is an enhanced risk for severe cold air outbreaks in the mid-latitudes beginning around two weeks after the event if it does. In mid-January, many weather enthusiasts and meteorologists declared winter to be a bust, yet I alerted my followers that it may take an additional 2-4 weeks before we begin to see the effects of the TPV displacement into Eurasia here in the United States. Typically, but not always, when a split or displacement favors Europe initially, that cold air will come into North America later in the winter, which is why I highlighted late-January through mid-February as a prime time for winter to make a roaring comeback.
However, in order to get that cold air into North America and down into the Lower 48, there needs to be cross-polar flow. Cross-polar flow occurs when an area of higher heights known as a ridge builds in over Alaska, which causes the jet stream to meander around the ridge over Alaska, through the Arctic, then dip south into North America bringing with it true Arctic air out of Siberia.
Since Arctic air masses are very cold, they are also very dense. Cold air is denser than warm air, which causes it to sink to the surface. This greater mass of air at the surface creates a surface anticyclone with an upper level low aloft; this is also known as a cold core high (Figure 6).¹⁰ Because cold air contracts and is dense, thickness values between height contours are far lower than in warm air masses associated with warm core highs (ridges). High pressure systems, regardless of their nature, are associated with little to no wind at the surface as air diverges away from the center. This lack of wind prevents mixing of air, which allows temperatures to either be extremely cold or extremely hot. This tidbit of information will be useful later. . .

Throughout much of January, jet stream flow was very progressive and zonal over the North Pacific. This was largely due to La Niña. Progressive flow over the North Pacific inhibits upper level convergence over the West Coast of North America from developing a ridge to slow down the flow and change the jet stream configuration. As a result, the entire continent was flooded with mild Pacific air. However, by mid-February, changes were a comin’.
The evolution of the recent cold snap was very similar to the setups which caused other historical cold spells across the southern plains (Figure 7). For purposes of this article, we’re going to make a comparison to the deep freezes of December 1983, February 1985, and December 1989. Shown below from left to right in chronological order are the synoptic scale setups for each outbreak, with the recently expired one on the far right. The top panel conveys 500 mb heights on the day leading up the beginning of the Arctic outbreaks, while the bottom panel conveys surface mean sea-level air pressure (MSLP). As clearly shown in each picture in the top panel, a ridge developed in the jet stream (denoted by the black H) over Alaska. Some ridging over Northern Canada forced the tropospheric polar vortex (TPV) south into the Prairies bringing with it very cold air. The upper level low associated with the TPV means that there is a cold core high at the surface. As the TPV rotated about itself, the Arctic surface anticyclone dived south into the Rockies and Heartland before migrating south into Lone Star country. This go-round, several low pressure areas that developed along the cold front dropped considerable amounts of snow and freezing rain across Texas in the span of ten days.

The Texas Energy Disaster
Incredibly cold air combined with snowfall and freezing rain impacting regions that infrequently observe such conditions can only lead to disaster to the energy grid and infrastructure only built to local building codes, especially if a significant percentage of that energy is supplied by unsustainable sources. This is exactly what occurred in Texas three weeks ago. The majority of businesses, schools, places of worship, and homes there are built to be resilient to incredibly hot summertime temperatures that engulf the state in a bake fest, not winter storms and extremely cold temperatures.
To vividly describe all of the damage to infrastructure and to tally the loss of life and property would be essentially impossible. Both the major winter storm and Arctic outbreak cost $195 billion in damage topping Hurricanes Harvey for the costliest natural disaster in U.S. history. As the cold settled in and the energy grid collapsed, pipes inside homes and businesses froze, contracted, and burst to release pressure, flooding buildings with insane amounts of water. Many of those who couldn’t venture elsewhere to seek warmth literally froze to death in their homes.
As usual, trying to have a coherent discussion with someone about what actually happened using science, common sense, and logical reasoning is quite the challenge. You can’t get a single word in without someone viewing the issue through their political ideology lenses. Democrats are blaming climate change (more on that nonsense later) and shortages in natural gas, while Republicans blame the loss of renewable wind power on the crisis. While there is some truth to both, it is a complex issue and there isn’t blame to place on any specific person or thing. So, what actually happened to cause the energy grid to fail?
The first thing we need to look at is what the main sources of energy are in Texas. According to last year’s ECROT Texas Fuel Mix Report (Figure 8), wind energy accounts for 23%, overtaking coal as the second most prominent energy source within the state.¹¹ Natural gas is still the largest source of energy in Texas, comprising 46% of the grid.¹¹ Progressive politicians in Texas have been encouraging the development of wind turbines across the western half of the state as well as along the Gulf Coast for years. As such, wind power is the fastest-growing source of energy in Texas, as it has risen from accounting for 11% of the state’s energy supply in 2015 to 25% so far so far in 2021.¹¹ The ever-increasing reliance on wind energy means that there is steadily less demand from fossil fuels like natural gas, coal, and nuclear with each passing year.

The push for wind energy ultimately has nothing to do with wind energy being cleaner, rather it’s because the renewable energy industry is being used by the government to take in billions of dollars in taxpayer money annually. In Texas alone, both the local and federal government combined has collected over $80 billion in solar and wind subsidies over the last 15 years.¹² Like the fossil fuel industry, the renewable energy industry should be able to mostly thrive on its own without taxpayer money, but that’s if it were affordable, reliable, and efficient on a large scale. Without tax dollars going towards subsidies by means of, to put it honestly, government theft, the wind industry in Texas would be miniscule compared to the 23-25% it currently supplies to the state.
So, with that in mind, let’s take a closer look at what happened in Texas. . .
On Tuesday, February 9, temperatures began to plummet across northern and western Texas, and as the temperature cooled to the dew point at the surface, condensation formed on various surfaces, including the turbine blades. As temperatures continued to drop like a brick, the condensation froze, particularly on the leading edges of the blades, which are specifically designed to direct wind around the blades allowing them to spin. When covered with thick coatings of ice, the blades become significantly heavier and there isn’t enough lift to spin them. Nearly half of Texas’ wind energy supply went offline as a result. This would’ve been much more disastrous if the heavy snow and freezing rain had impacted that part of the state.
Some Republican congressmen and commentators were making the claim that the cold weather itself caused the turbines to come to a halt, but this is only partially true. Wind turbines operate just fine in climatologically cold and dry regions like North Dakota, the Arctic, and even in Antarctica. However, when cold air moves in behind a cold front, that Arctic air is associated with a cold core high pressure system, which as discussed earlier, means there is very little wind. So, while ice accretion on the turbine blades caused the turbines to fail, they would have anyways regardless.
As wind energy began to fail on February 9, natural gas backup generators located all around the state kicked in almost instantaneously. You can easily see this on the graph below from the U.S. Energy Information Administration (EIA) (Figure 9). As wind energy buckled (green line), natural gas (light brown line) consequently shot up like a rocket to pick up slack.¹³ Natural gas is a very useful backup source of energy, backups of which are a requirement for any renewable source given intermittency in solar and wind output. It can be easily generated based on demand and delivered to homes, schools, and businesses by pipeline. This is far different than coal or nuclear energy, which, while there is a lot of fuel on site, take time to generate significant output.

Demand for natural gas far exceeded the 67 gigawatts ECROT anticipated back in November, meaning that they had to implement rolling blackouts to reduce the demand and avoid a complete blackout of the energy grid by February 14 as the coldest air set in.¹⁴ One of the major fallouts, however, is that natural gas plants don’t have a lot of energy on site. Thanks to the frigid temperatures and snow, the wells closed up and gathering lines froze due to a lack of insulation around them, while the pumps stopped working due to power outages, inhibiting the gas from reaching the Earth’s surface that could then be supplied to the plants by pipeline.¹⁴
So, in summary, a lack of preparedness with regards to infrastructure and a chain of reactions beginning with the failure of wind energy are to blame for this disaster. The push for wind energy by progressives has led to an unbalanced mix of power generation across the state. Prior to February 9, wind energy was producing an average of 15-20 gigawatts of energy while natural gas only accounted for approximately 5-10 gigawatts. This, in theory is fine. However, renewable energy, unlike fossil fuels, only works intermittently. This is why natural gas is a great backup source. However, natural gas is only supply on demand, which also makes it vulnerable to poor weather conditions.
Coal and nuclear energy, while they take time to generate output, have a base load of fuel on site available for weeks or even months at a time, which makes them very useful during natural disasters. Coal may not be the cleanest source of energy environmentally, but when it comes to a life and death situation, the environment isn’t really that important.
Climate Change: Did It Play a Role or Not?
Only adding to the confusion, a large number of media outlets have been running headlines using convoluted logic to explain how the cold air outbreak and winter storms which pounded portions of the southern plains and Mississippi River Valley causing billions of dollars in damage to infrastructure and power grid failure was an indication or even outright result of man-made global warming. Intuitively, these assertions make zero sense, and they don’t withstand physical reasoning either.

These days, it seems like no matter what the weather does, someone makes an attempt to blame it on man-made climate change. This has become a commonplace in the mainstream news media, particularly within the last five years, and has disturbingly been perpetuated by a few atmospheric scientists with large public platforms. Scientists who have large social media followings play a very important role in science communication; it’s their job to communicate science as clearly and as effectively as possible, especially when there are large discrepancies between the headlines journalists spin up and what peer-reviewed papers actually suggest. Unfortunately, many scientists refuse to call out misinformation in the media simply because it hurts the cause for climate action. In other words, many prominent scientific voices are just political activists hiding behind the mask of a competent scientist.
The very first thing I should point out is that climate change does not cause extreme weather — or any weather, for that matter — to occur. In fact, extreme weather is well. . . normal. Climate change activists have this wild perception that the weather should be exactly average, and that it always used to be that way until humans screwed up the weather; this point of view is probably a result of the news media constantly emphasizing averages and normals in their reporting. Weather is rarely average. Given that the majority of weather stations, particularly those within the United States, have periods of records spanning more than a century, it can be expected that on occasion, any given location will experience a weather event it hasn’t experienced before. It is not uncommon for both record high or record low temperatures to be set.
Weather and climate are related, but are two separate topics. Weather describes atmospheric conditions here and now. Climate, on the other hand, is a compilation of a wide array of statistics that describe long-term atmospheric conditions for any given location, region, or even the entire planet; this includes everything from averages and distributions to frequencies and extremes. Climate is typically justified over a 30-year period, at minimum. Individual weather events, whether it be extreme heat, extreme cold, a hurricane, tornado, flood, drought, or wildfire, tell us nothing remotely useful about any given location’s climate, let alone any climatic changes that may or may not be taking place. This doesn’t stop journalists from making a shoddy attempt trying to do so, however.
Before we go any further, however, let’s take a look at some indisputable facts, some of which are often ignored in these studies and especially in press coverage:
- Record cold temperatures do occur from time to time; cold waves are an expression of natural variability in Earth’s atmosphere.
- The Earth is warming in the long-term, of course, with day-to-day, month-to-month, and year-to-year variability. The loss of sea ice in the Arctic has been a contributor to the enhanced warming trend being observed there when compared to the global average. This means that the source of cold air is where it’s warming fastest.
- The frequency of cold waves, the number of record low temperatures, and the percent of land area observing unusually cold temperatures have all declined over the last century, particularly since the late 1980s.
With those three key points in mind, let’s take a closer look at this. . .
Arctic outbreaks are expressions of natural variability in Earth’s atmosphere. For as long as we’ve had weather records, official or not, lobes of cold air associated with the tropospheric polar vortex (TPV) have broken off thanks to high-latitude blocking patterns, diving south into the mid-latitudes rotating west to east bringing with it unpleasantly cold temperatures for days or even weeks. This natural process, which was discussed earlier in detail, used to just be the weather, but like everything else these days, it’s now caused by man-made climate change.
Frigid air masses begin forming over the Arctic in autumn as the north pole tilts away from the sun. The lack of incoming shortwave radiation means that all of that energy and then some is emitted back into outer space. This results in continuous cooling of Earth’s surface until spring arrives. The colder it gets, sea ice begins to grow out. That combined with newly added snow cover results in even more cooling leading to a negative feedback loop. What results from this is the formation of a very dense, very cold air mass which not only forms the polar high at the surface, but also the polar vortex aloft.
There have been many studies which suggest that sea ice loss in the Arctic region has brought about enhanced warming there thanks to loss of albedo, known as Arctic amplification. This theory is indeed supportable by observations from satellite temperature data (Figure 11).¹⁵ Shown in the map below on the left, you can easily see the the north pole is warming at a faster rate in the lower troposphere than pretty much anywhere else in the world. When you compare the decadal trends shown on the right, the Arctic (top) is warming 0.261°C per decade faster than the global mean (bottom).¹⁵

Some scientists, in particular, Dr. Jennifer Francis (also here and here), have hypothesized that Arctic amplification, which reduces latitudinal thermal gradients, has caused planetary-scale Rossby waves to elongate as westerlies weaken, which thereby causes the jet stream to meander resulting in more frequent blocking patterns, leading to more polar vortex disruptions during the winter and therefore more frequent cold air outbreaks and extreme weather. Climate scientist Dr. Katharine Hayhoe, at Texas Tech University, calls this “global weirding.” However, many scientists disagree with these assertions (see here, here, and here), as there is a lack of data to support them and it even violates global warming theory itself.
Given that the Arctic is the fastest-warming location on Earth, as discussed above, that means that our cold air supply is steadily decreasing, which means that claims about cold air outbreaks becoming more frequent due to global weirding or the jet stream being out of whack don’t hold much water. It is a thermodynamic impossibility for warming to cause colder weather. Such claims are speculative, at best.
One of the easiest ways to test this theory is to look at the frequency of cold air outbreaks. If global warming was leading to more frequent blasts of Arctic air by means of Arctic amplification, then that should be reflected in long-term station data observations. To no surprise, the number of cold snaps have decreased across the central and eastern United States since general recordkeeping began in 1895.
Two years ago, Dr. John Christy, a climatologist at the University of Alabama Huntsville (UAH), formerly of NASA’s Marshall Space Flight Center, graphed the average number of November through March cold waves across the central and eastern United States, excluding the Deep South (Figure 12).¹⁶
The criterion necessary to do this analysis, according to Dr. Christy, were as follows:
- All weather stations used had to have sufficient periods of records and little missing data. While not explicitly mentioned in the article, this tidbit is something Dr. Christy has done with many other of his analyses.
- Defining a cold wave meant that each individual station used in the analysis had to observe daily maximum temperatures over at least a two-day period between November and March, colder than the 5th percentile of that specific location’s average January daily maximum temperatures.¹⁶
- The resulting frequency of cold waves per weather station was then grouped by region and then averaged to get a good idea of cold spell frequency across the central and eastern United States since 1895.¹⁶
- While many urban sites have data spanning more than 125 years, most rural locations don’t have periods of records going back before 1895, which is probably why that starting date was chosen. For what it’s worth, NOAA NCEI also starts their graphs in 1895.
The main conclusion from this analysis shown in Figure 12 below is that there is no evidence supporting the media’s claim that cold waves are becoming more frequent in the United States thanks to man-made climate change. While there is indeed a lot of-year-to-year variability with perhaps even multidecadal cycles evident, the overall trend is notably down. With the exception of the late 1970s and 1980s, cold waves were far more prevalent during the late 19th and early 20th centuries than they are today.

Furthermore, the total number of daily record low minimum temperatures tallied up from 805 United States Historical Climatology Network (USHCN) stations has taken a rather steep decline since the mid-1980s (Figure 13).¹⁷ There was a similarly low period between the mid-1930s and early-1950s, but thanks to both urbanization locally and the lesser amount of cold air to work with in the Arctic, the current low period is quite a bit lower than that observed several decades ago.

If the two graphs already shown aren’t compelling enough, well, here’s a graph from the Environmental Protection Agency (EPA) of the percent of land area in the Continental United States by year experiencing unusually cold wintertime temperatures from 1911 to 2016 (Figure 14).¹⁸ While the graph is a bit dated, as government agencies seemingly never like to update anything, the long-term downward trend in land area affected is without a doubt unaffected by anything that has occurred within the last five years. The biggest exceptions to recently mild conditions were in 2009-10, 2010-11, 2013-14, and in 2014-15.

Global warming theory specifically states that as the planet warms, latitudinal thermal gradients between the Arctic and mid-latitudes weaken as the Arctic warms at a faster rate due to sea ice loss that initiates a positive feedback loop. This is where applying global warming theory is correct. However, the reduction in thermal gradients corresponds to lower amounts of baroclinic instability. Why is this important? Well, baroclinic instability is necessary for initiating extratropical cyclone development (Dacre et al. 2012 and references therein), which in fact causes a reduction in atmospheric thickness values between 500 hPa and 1000 hPa by means of cold air advection from the north and west, causing the upper level trough to deepen and elongate as shown in Figure 15 below.¹⁹ A lack of baroclinicity in a warmer climate inhibits planetary waves from elongating, exactly opposite of what is claimed by the press and even some scientists such as Dr. Jennifer Francis, as discussed in Blackport and Screen (2020).²⁰

Under radiative forcing by means of adding carbon dioxide into the atmosphere, climate models projected that the stratosphere would cool in response to tropospheric warming through both heat retainment in the troposphere and ozone depletion in the stratosphere. Scientists touted this for decades as the undeniable human fingerprint of man-made global warming, and rightfully so, as satellite observations of lower stratospheric temperatures confirm long-term cooling since measurements began in 1979.¹⁵

In order for the polar vortex to become unstable and unleash frigid air into the mid-latitudes, the stratosphere needs to be warmer, which is what happens, albeit briefly, when sudden stratospheric warming events occur during the winter, as previously discussed in my meteorological analysis. Some fringe scientists suggest that such warming events have become more frequent in recent decades due to Arctic amplification, but both NOAA and a 2019 study suggest otherwise.
Figure 17 below is cropped from Domeisen (2019). According to the study, there has been no robust trend in the frequency of sudden stratospheric warming events both over the last 170 years through a reconstructed time series, or since the 1950s by means of reanalysis.²¹ Furthermore, Domeisen (2019) found that the lack of stratospheric warming events actually observed during the 1990s coincides with the most extreme minimum in the reconstructed time series in red.²¹
“. . . the occurrence of SSW events is estimated to have experienced decadal variability comparable or slightly weaker to today’s climate and no significant trend since 1850. The minimum in SSW occurrence in the 1990s coincides with the most extreme minimum in the reconstructed SSW time series, indicating that the 1990s may constitute the most significant absence of SSW events since 1850.”

What this likely suggests is that profound long-term stratospheric cooling in response to greenhouse forcing in the troposphere and a strong stratospheric polar vortex reduced the frequency of such events,²² contrary to claims made by other scientists.
So, the bottom line is this. Yes, when linearized, the Arctic is warming at approximately double the global average rate per decade. This is more than likely caused by melting sea ice and loss of albedo leading to a positive feedback loop. Furthermore, this Arctic amplification is reducing the latitudinal thermal gradients resulting in weaker westerly flow in the jet stream. This is where global warming theory is correct and can be applied. However, the wheels fall of the wagon when it comes to attributing invasions of Arctic air on it. Weaker westerlies do not lead to a wavier jet stream configuration and more blocking patterns, conducive for weakening the SPV. Rossby waves elongate due to baroclinicty. Strong thermal gradients at the surface cause waves of low pressure to develop, maturing into an extratropical cyclone, which then cause the upper low to deepen. Additionally, because of global warming itself, the stratosphere cools which strengthens the SPV. The SPV splits or becomes displaced under warming events, so global warming theory fails here.
The Moral of the Story
Crippling weather events should teach us important lessons about both energy policy and our level of preparedness for such conditions. Like previous Arctic outbreaks that have pummeled Texas over the years, this one was no different with respect to impacts, except for the amount of infrastructure damaged. Texas’ energy grid was unprepared for such prolonged freezing conditions combined with ice and snow.
Wind turbine blades located there aren’t winter weather resilient like they are up north. To make matters worse, wind energy comprises over 23% of Texas’ power generation, and it’s the fastest-growing energy source in the state. This has pushed the energy mix to unbalanced and unsustainable levels. Energy demand is highest during both periods of extreme cold and extreme heat, whether it be heating or cooling in demand, respectively. What progressives don’t understand, however, is that such weather conditions are associated with high pressure and very light wind speeds, which means that regardless of whether or not the turbines have ice on their blades, the turbines would stop working either way.
Natural gas is a great backup source of energy, as it’s instantaneous. However, it’s only supply on demand, and the majority of winter weather forecasts were predicting a very mild winter, which meant that supply for it was low when the cold air came rushing in during mid-February. This is why we have both coal and nuclear power plants, which have a ton of fuel on site and are great sustainable sources of energy. While coal most certainly is not the cleanest source of energy, it is certainly one of the most sustainable and affordable. Fossil fuels are essential during crises, as renewable energy only works intermittently. When it comes to a life and death situation, what would you do? Use fossil fuels to keep warm and survive, or freeze yourself to death once wind power fails in order to save the planet?
Politics thoroughly corrupted climate science over 30 years ago, but it’s now beginning to corrupt energy policy and engineering, which is a far greater problem than the former. Billionaires own large media corporations, which means they control the flow of information. Whoever controls information controls society. Journalists will do anything to make a good headline that suits the agenda. They aren’t interested in truth, if they were, they’d allow opposing voices to be heard.
To blame weather events that have occurred many times before on man-made climate change is absurd. There is no sound science that suggests climate change had anything significant to do with this Arctic outbreak or energy grid failure in Texas. Blaming climate change is just a way for Democrats to avoid the real issues at hand — both wind energy itself and a lack of poor infrastructure — and waste billions of dollars in taxpayer money towards unsustainable, unreliable, and costly wind energy. It is also the fault of senators and representatives, largely Republican in base, from passing legislation that would improve infrastructure vulnerable to poor weather conditions.
Engineers need to be the ones making the decisions on power generation, not politicians. Having sustainable power sources to generate electricity is essential for our well-being and to prevent the collapse of civilization. Destabilizing the power grid by overreliance on renewable energy goes not make Texas more resilient to natural disasters or any possible effects of climate change that could come about. As Benjamin Franklin once wisely said, “By failing to prepare, you are preparing to fail.”
References Cited
[1] National Centers for Environmental Information (NCEI). “Data Tools: Daily Weather Records.” National Centers for Environmental Information (NCEI). Accessed March 9, 2021. https://www.ncdc.noaa.gov/cdo-web/datatools/records.
[2] “(Unofficial) Record-Breaking Temperatures across the Globe.” coolwx.com. Accessed March 9, 2021. http://coolwx.com/record/usamovie.month.php.
[3] Gold, David. “The Week The South Froze: Meteorological Context.” goldweather, February 21, 2021. Accessed March 9, 2021. https://goldweather.wordpress.com/2021/02/21/the-week-the-south-froze-meteorological-context/.
[4] xmACIS2. Accessed March 9, 2021. https://xmacis.rcc-acis.org/.
[5] Waugh, Darryn W., Adam H. Sobel, and Lorenzo M. Polvani. “What Is the Polar Vortex and How Does It Influence Weather?” Bulletin of the American Meteorological Society 98, no. 1 (January 1, 2017): 37–44. https://doi.org/10.1175/bams-d-15-00212.1.
[6] Brasefield, C. J. “WINDS AND TEMPERATURES IN THE LOWER STRATOSPHERE.” Journal of Meteorology 7, no. 1 (February 1, 1950): 66–69. <a href=”https://doi.org/10.1175/1520-0469(1950)007https://doi.org/10.1175/1520-0469(1950)007<0066:watitl>2.0.co;2.
[7] Palmer, Clarence E. “The Stratospheric Polar Vortex in Winter.” Journal of Geophysical Research 64, no. 7 (July 1959): 749–64. https://doi.org/10.1029/jz064i007p00749.
[8] Charney, J. G., and P. G. Drazin. “Propagation of Planetary-Scale Disturbances from the Lower into the Upper Atmosphere.” Journal of Geophysical Research 66, no. 1 (January 1961): 83–109. https://doi.org/10.1029/jz066i001p00083.
[9] Limpasuvan, Varavut, David W. Thompson, and Dennis L. Hartmann. “The Life Cycle of the Northern Hemisphere Sudden Stratospheric Warmings.” Journal of Climate 17, no. 13 (July 1, 2004): 2584–96. <a href=”https://doi.org/10.1175/1520-0442(2004)017https://doi.org/10.1175/1520-0442(2004)017<2584:tlcotn>2.0.co;2.
[10] “Cold Core High.” meteorologyman, January 11, 2014. Accessed March 9, 2021. https://meteorologyman.wordpress.com/2014/01/10/cold-core-high/.
[11] “Generation.” Electric Reliability Council of Texas (ERCOT). Accessed March 9, 2021. http://www.ercot.com/gridinfo/generation.
[12] “The Big Subsidy Steal: Texan Taxpayers Fork Out $80,000,000,000 to Wind Power Outfits.” STOP THESE THINGS, May 30, 2020. Accessed March 9, 2021. https://stopthesethings.com/2020/06/10/the-big-subsidy-steal-texan-taxpayers-fork-out-80000000000-to-wind-power-outfits/.
[13] Morey, Mark. “Extreme Winter Weather Is Disrupting Energy Supply and Demand, Particularly in Texas.” U.S. Energy Information Administration (EIA), February 19, 2021. Accessed March 9, 2021. https://www.eia.gov/todayinenergy/detail.php?id=46836.
[14] Douglas, Erin. “Texas Largely Relies on Natural Gas for Power. It Wasn’t Ready for the Extreme Cold.” The Texas Tribune, February 16, 2021. Accessed March 9, 2021. https://www.texastribune.org/2021/02/16/natural-gas-power-storm/.
[15] “Upper Air Temperature.” Remote Sensing Systems (RSS). Accessed March 9, 2021. http://www.remss.com/measurements/upper-air-temperature/.
[16] “If the Polar Vortex Is Due to Global Warming, Why Are U.S. Cold Waves Decreasing?” Roy Spencer, PhD, January 31, 2019. Accessed March 9, 2021. http://www.drroyspencer.com/2019/01/if-the-polar-vortex-is-due-to-global-warming-why-are-u-s-cold-waves-decreasing/.
[17] Jordan, Steve. Dr John Cristy at the American Geological Society, Shreveport 2018. YouTube. July 17, 2019. Accessed March 9, 2021. https://www.youtube.com/watch?v=ssE1c80BBmw.
[18] “Climate Change Indicators: High and Low Temperatures.” EPA. Environmental Protection Agency. Accessed March 9, 2021. https://www.epa.gov/climate-indicators/climate-change-indicators-high-and-low-temperatures.
[19] Dacre, H. F., M. K. Hawcroft, M. A. Stringer, and K. I. Hodges. “An Extratropical Cyclone Atlas: A Tool for Illustrating Cyclone Structure and Evolution Characteristics.” Bulletin of the American Meteorological Society 93, no. 10 (October 1, 2012): 1497–1502. https://doi.org/10.1175/bams-d-11-00164.1.
[20] Blackport, Russell, and James A. Screen. “Insignificant Effect of Arctic Amplification on the Amplitude of Midlatitude Atmospheric Waves.” Science Advances 6, no. 8 (February 19, 2020). https://doi.org/10.1126/sciadv.aay2880.
[21] Domeisen, Daniela I.V. “Estimating the Frequency of Sudden Stratospheric Warming Events From Surface Observations of the North Atlantic Oscillation.” Journal of Geophysical Research: Atmospheres 124, no. 6 (March 21, 2019): 3180–94. https://doi.org/10.1029/2018jd030077.
[22] L’Heureux, Michelle. “On the Sudden Stratospheric Warming and Polar Vortex of Early 2021.” NOAA Climate.gov, January 28, 2021. Accessed March 9, 2021. https://www.climate.gov/news-features/blogs/enso/sudden-stratospheric-warming-and-polar-vortex-early-2021.
Interesting discussion of meteorological mechanics. Beyond that, I’ve been in west Texas in December exactly once and it wasn’t this year. There was snow on the ground and the natives weren’t surprised while admitting that they had to be careful since they don’t prepare for this regular, infrequent occurrence. I still don’t know what they were thinking when planning grid supply except what the green government agencies were promoting through economic and coercive means.
Having watched my newspapers’ daily temperature histories, let’s just say that daily records by definition exist for every day and have occurred (both hot and cold) from the time records were started to the present day. Just not impressed by such daily records when an arctic blast (now scarily known as a polar vortex) goes through on a particular day or week.
I found out years ago west Texans cannot operate in a sand storm, somehow the never learned to follow the striping in low visibility. The day I had to drive through a sand storm the bridge abutments took a terrible toll. Having coming from windy western Minnesota and North Dakota with wind drive snow over half a year it was rather entertaining how a minor blocking of visibility lead to the carnage.
On Figures 12 and 13, are there measurement data from prior to 1895 for those stations? I’m guessing there are not, which means that the later years’ reduction in observed record cold may be due to the reducing likelihood of reaching a new record as more measurements are made.
“According to NOAA NCEI, a total of 8,632 daily record low temperatures…”
“Additionally, a whopping 693 monthly record lows were set, 199 of which were all-time record lows.”
“While no statewide records were broken…”
OK. So which is it?
Wondered about this too. Either whopping UHIE or something amiss in the data.
Agreed!
I had to read the paragraphs DHR refers to several times while trying to figure where I was missing what happened to state records and who tracked them.
It’s both. In Oklahoma as example, the statewide low of -30F was not broken during the same storm, but several cities and towns either came close to, or broke previous record lows for those locations.
All time record lows for the city in question.
Ok, so everyone in the South should take a look at what transpired in Texas and put physical fixes in place to not let it happen again. We here in North Carolina experienced a sub zero F blast in the 80’s and survived, although there were a lot of frozen pipes, wells and all the ligustrum hedges died (the tops, not the roots).
I would hope our grid suppliers here do a thorough examination and make any changes needed. We have a lot of solar, not that much wind and a nuclear plant about 25 miles from my house to fall back on.
Luckily for the Appalachian states about the only areas good for wind would be offshore so you have not been spending billions on unreliable wind generation although my nephew has been working on vast forest killing solar projects in VA south to SC for years.
Driving through the northeastern states you only see virtue signaling windmills here and there as along the Mass turnpike or I 90 in rural NY. Even when able to see over the forests from overpasses or from hilly areas, you rarely see more that 5 in a field.
Driving through the lower plains in 2018 and 2019 on interstate 40 the windmills, both operational and under construction, go on for hundreds of miles, from New Mexico through the Texas panhandle into Oklahoma. Of those visible from the highway in completed fields, I guestimate 2-5% were not operating. Rarely were all those visible at one time spinning, usually one or two were not, often not turned to the wind.
Of course my observations are anecdotal, but still better than climate science since I used actual observations of the physical world. My only use of a computer was to write this. I didn’t create a computer model to provide “data” to my expected outcomes. Obviously I am no scientist.
There are some wind fields below the I-40 in Arizona also.
“In Texas alone, both the local and federal government combined has collected over $80 billion in solar and wind subsidies over the last 15 years.”
Governments do not collect subsidies, they pay them. What are you trying to say?
Excellent question! I assumed the subsidies (tip of the iceberg – the real problems are 1) the preferential dispatch of and 2) the lack of make-whole penalties for non-performance to renewable energy sources) and accrued to the developers, but what do I know?
“Governments do not collect subsidies, they pay them.”
More accurately, since governments don’t actually produce anything, they can only force less favored entities (e.g., rate payers and other energy suppliers) to pay more favored entities (e.g., renewable energy suppliers). However, some government agents get paid for this service in the form of campaign contributions and other means of support.
Which in turn is why Texas energy bills have been increasing faster than anywhere in the US… or so I’ve been told by someone who lives there. Not as fast (yet) as in Germany, Netherlands, etc… but likely coming soon. Aaaargh.
I thought the price of electricity would skyrocket as I was sitting in the cold/dark with no water for 36 hours, but I checked “powertochose.org and right now, I can get a 36 month fixed rate for 8.1 cents/kwh in DFW which is about what it was 5-10 years ago.
I think every european pays more than 8.1 US cents per KWH.
Just don’t authorize auto-deduct or even credit card charge. Demand an actual paper bill. There have been horror stories of folks getting HUGE auto-deducts from 3rd party “providers”.
How long before the reach the price of energy in California?
Not disputing this, but since it’s your number, would you please link us to it’s documentation?
If true, then another coincidentally comparable value. It’s in the range of the oil and gas asset retirement costs, just in Texas, that will end up communized onto the rest of us. Channels the ~$1.9T COVID relief bill. Almost the same $ as the trickle up into mostly nonperforming, squirreled away, dividends, like for like acquisitions, stock buy backs, from the 2017 tax bill.
As Reagan said, “Well, there you go again” Bob.
Driving across I 80 through Ohio and Pennsylvania I was amazed by the THOUSANDS of very old oil rigs in corn fields. Maybe 1 in 10 were pumping but most were REALLY old. I do remember seeing several storage yards with 10 to 50 or more stored pumps. The funny thing is, Bob, that the corn fields were planted to within 10 to 15 feet of MOST of the rigs.
So what do you propose for decommissioning those wells? From an agricultural perspective the lost acreage for corn production is minimal and would be easily made up for by removing ethanol subsidies greatly reducing the need for so much corn, so you could just remove the power supply and, if truly shut down, the tank farms interspersed here and there beside RR tracks or main roads. From an ecological perspective, plug the well, remove the pump, put a 5 foot by 5 foot fence around the well head and plow the access road back into a corn field. The pipelines below the fields abandoned in place, no biggie. Minimal cost. I can’t say I saw any empty spots in the fields where the pumps must have been removed from so I don’t know what impact an abandoned wellhead actually has.
Now Bob, how much to decommission a solar or wind farm? What is the energy density of solar and wind compared to oil and gas, and to coal for that matter? If you abandon in place wind and solar, how much arable acreage will you remove from the biosphere? (Like that leftist sounding terminology?) And since the leftist will never force their leftist buddies to remove them in the first place, how long will I have to see the visual blight of wind and solar as I drive around this once beautiful country? I guess by my mother’s age, at least another 25 to 30 years, until my passing. Hell, they are still building more of the blight. I will never live to see them removed, just look at Tehachapi in California.
And you can also use the quote above back to me because I have similarly responded to your rubbish before. But you are a leftist fanatic and are unable to learn anything new, like that old dog. When hatred is the basis of your belief system, logic is lost on you but I enjoy writing of my travels and what I have seen of the country putting 55,000 miles on my Diesel truck since I bought it in July of 2019. 15.5 miles per gallon by the truck’s computer, mostly because much of that mileage was pulling my port-a-potty along for the ride.(did your head blow off Bob, not just an ICE but a diesel, and all those gallons) No commuter miles to speak of, 3 cross country trips and side trips to Washington state and Tucson for snowbirding. The only place I have intentionally avoided from my residences in Las Vegas and southern Utah is California.
Drake
“So what do you propose for decommissioning those wells?”
I propose that those currently responsible. P&A them using current API best practices, and leave them hydraulically competent. A Trumpian YUGE job, since many of them might be cable tool drilled, but still what was promised, way back when.
“Minimal cost.“
Obviously a non oilfielder. There’s both the tremendous number of wells, and the difficulty plugging generations old, non cemented well bores to not leak between intervals and/or to surface. Actually, I would like to be wrong here, but just the fact that states like Ohio still put up with these trash cans indicates I’m not. More likely the currently responsible parties are shuckin’ and jivin’ in the hopes of a bailout.
BTW, LOVE my 2018 Colorado, Z71, CCLB, 2.8 diesel. We’ve towed our 21′ Escape 5.0 5th wheel over 20K miles, at ~19 m/g. So, MOPAR to you on traveling. That’s not the problem here….
Bob, you clearly don’t know the back end of the oil & gas business. Operators are held liable to decommission and plug and abandon wells. Many are kept unplugged for possible redevelopment or as possible produced water disposal (sometimes an excuse to delay). Most of the old, abandoned and rusted oil & gas infrastructure you see is either leftover from pioneering development when there were no standards and technology was not advanced, or they are in rattlesnake and jackrabbit country (west of a line from Dallas to Austin to San Antonio). Going east, the hot and humid environment in Texas makes relatively quick work of abandoned oilfield equipment and contaminated sites. Any escaped hydrocarbons easily degrade and salts are washed away. The worst environmental contaminant from oil & gas production is salt, particularly in transitional water budget areas, where the land is agriculturally productive yet not wet enough to readily flush away spilled or leaked salt.
The Railroad Commission of Texas has jurisdiction over the industry and either require operators to properly close or they use state money to close truly abandoned wells and equipment (a viable operator can no longer be identified).
The landowners (surface owners) themselves are also part of this picture. They can or do have lease agreements with oil & gas operators to plug, abandon and remove systems that are no longer producing or operable. However, if they have mineral rights in a producing field, they earn royalties off of the minerals and sometimes allow surface resources (e.g., soils and water) to be damaged when that land has very little to no agricultural production or wildlife conservation value. So landowners are not innocent either if they allow their land to be damaged.
I hasten to add, wind energy has even worse environmental troubles in this regard. Landowners sell off their wind rights (probably for much lower royalties than would be earned from oil&gas), then they and the environment are left with horrendous ecological and environmental damage from both operating and abandoned wind infrastructure. We just don’t see the end of life problems yet with wind, because most of it has been built in only the last 10-20 years.
If city dwellers want wind power, the wind also blows in cities. Let them build a forest of wind turbines on high rise buildings and neighborhoods and be happy about it.
The government of Oklahoma is looking for old abandoned and deserted oil fields and strip mines. They come in and remove the old oilwell equipment and clean the place up.
There was a small coal strip mine not far from my house some years ago, and they strip mined the land for about two years, and then packed up and left, and before they left they restored the land back to its natural condition and you could walk out there now and would never know a bulldozer had worked that land over.
I imagine the coal mine operator had an agreement to clean up his mess after he was done and probably paid most of the costs, and then did a very good job of it. I must say I was surprised at the good job they did.
“Operators are held liable to decommission and plug and abandon wells.”
In your dreams. Bonds are a fraction of what is actually required, and the whole sequence of changing ownerships is largely catalyzed by a try at shirking these responsiblities. Your corporate PR lies are just that
“(sometimes an excuse to delay)”
A kernel of truth in a deluge of paid up pablum.
“Most of the old, abandoned and rusted oil & gas infrastructure you see is either leftover from pioneering development when there were no standards and technology was not advanced, or they are in rattlesnake and jackrabbit country (west of a line from Dallas to Austin to San Antonio).”
The promises they made in writing to their leaseholders has nothing to do with where they are situated. And the pollution that these trash cans can cause is unacceptable. To come up with this BS “It’s all out in the middle of nowhere” apologia is elitist BS.
“The Railroad Commission of Texas has jurisdiction over the industry and either require operators to properly close or they use state money to close truly abandoned wells and equipment (a viable operator can no longer be identified).”
Asleep at the switch. with a 75 year history of Ben Dover. Too easily bullied by private sector tech folks making twice as much, like me.
“The landowners (surface owners) themselves are also part of this picture.”
Unless they have subsurface rights, no. They get damages, period. You are outing yourself as a paid shill, with only a tiny knowledge of the biz you’re shilling for, with such nonsense.
“I hasten to add, wind energy has even worse environmental troubles in this regard. Landowners sell off their wind rights (probably for much lower royalties than would be earned from oil&gas), then they and the environment are left with horrendous ecological and environmental damage from both operating and abandoned wind infrastructure.”
Fact free, wishful thinking. NO documentation to back it up. The land owners here have MORE incentives to build long term relationships with their lessors. Their resource – the wind – can be harnessed for centuries, with many generations of machinery installed, removed, and replaced. Unlike the deplete and run off hydrocarbon extractors, the wind generators MUST satisfy the and owner.
BTW, since their is nothing to deplete, why would wind farms pay “royalties”? You have NO idea how these things actually work.
Corporate PR lies … paid shill … fact free. You are hilarious, Could-Be-Named-Bob (but probably not). Classic leftist ad hom.
You know nothing about me, and it matters not anyway. Let’s just say, like many commenting on WUWT, I don’t work for the energy industry and am not paid a dime for my views, but I do know of what I speak from 40+ years of up-close professional experience.
Windfarms pay royalties in the UK. Essentially, they are lease payments on the land or seabed they occupy. They are paid to the Crown Estate… royalty.
Only “back end” big oily know about is that back end of a pig.
Wind farms have been decommissioned.
Vindeby has been decommissioned since that article.
Wind farm costs are not viable.
Vindeby had a negative return on investment with costs to earnings at 1:1.
The only way renewables can achieve a positive ROI is to gouge citizens. To date, this gouging has only benefited big renewable investors.
Yes, I don’t doubt that a 25+ year old wind operation – one of the first of it’s kind, technically ancient and certainly installed more as prof of concept than money minter- might not make money. I’m happy to make wind farms put away cash proportionate with the expected life of the operation for their decommissioning. Also, oil and gas ops. Doh! If oil and gas ops had to do this, and actually had to PAY for the Trumpian YUGE liabilities from the old wells they have ignored for decades, NONE would turn another $ of profit.
Are you ready to rock on this generous tit for tat deal? Folks, I predict some combination of deflection and crickets from AtheoK…
It’s not just visual blight, although that’s bad enough. My brother bought a house and 40 acres out in the middle of nowhere in the Texas panhandle a few decades ago. Great location to live and raise a family. Within the last few years those big wind turbines have popped up on the land to the south — the closest turbine is about a half mile away. Ruins the view, and those turbines sound like a jet engine idling on the runway prior to takeoff. Can’t get away from the sound even inside the house with all the doors and windows closed.
Governments can not pay anything, unless they collect the subsidies from others first.
Subsidies are from:
All come at the expense of citizens. Government as the middleman keeps a substantial share of rebate funds.
re: The two coldest days were Monday, February 15 and Tuesday, February 16, where temperatures were some 40-50°F below average across Oklahoma and Texas.
I WONDER what the effect is that ‘cold’ has on turbine oil? (rhetorical question) You know, in a ‘peaker plant’ sized jet turbine engine …
“GE Gas Turbine Frame 7EA (Fundamental and Operation) 2 hr video”
https://www.youtube.com/watch?v=blo9uthcimc
Video covers: Starting System, Control system, Lube oil System, Hydraulic, Inlet Guide Van(IGV), Water injection, Closed Cooling, etc.
The extreme was (1) improbable, and (2) predictable. In risk talk, a low (but increasing) probability, high impact event. Texas chose not to be prepped for it. The least discounted cash flow solution would have been sizing, hardening, gas to electric infrastructure, along with simple electrical prioritization of that chain, and interconnection. MAYBE, add temperature resistance to the innards of some wind turbines, but don’t count on them. Coulda’ done it, but didn’t.
The forecasting back look is fascinating, but not part of any point forward solution.
Bigboob, Obviously, you didn’t understand the article. It clearly established that the probability of extreme cold is NOT increasing. Try reading it again, even the big words.
I do agree that this event was predictable, 10 similar events have happened in the last 50 years, the prior one in 2011. Winterization alone is insufficient -Natural Gas demand exceeded supply in the 2011 event resulting in whole towns in NM having their NG shut off. The problem is simple, Texas hasn’t built/maintained sufficient reliable power generation with fuel storage (nuclear, coal) to keep up with their increase in demand. They spent much too much building unreliable wind and solar and too little on sources that you can count on.
Had the average temperature been a couple of degrees warmer, the problems would have been less.
Less demand from residences for heat, and quite possibly not as many fossil fuel and nuclear plants dropping out from problems with the cold. At the least, they could have provided power for a little longer before being forced to drop out.
Most of the drop outs were caused by grid phase disruption something the solar and wind cannot make up for. Their dropout are if not total but also come with a great shift in phase and frequency. All fossil fuel and nuclear power plants will shed the load at once! That is a lot better than watching a multiple million dollar turbine going through the roof, which is not a good thing.
“ It clearly established that the probability of extreme cold is NOT increasing.”
Sorry Meab, let’s use our NUMBERS.
https://www.ncdc.noaa.gov/extremes/cei/graph/sw/01-12/2c
Since 1980 – a good starting point since it is both a statistically significant sample, and aligns with the end of the mid 20th century aerosol era – the fraction of southwest US extreme minimum temperature events has been increasing at ~1.35%/year, with a standard error of that trend of ~0.35%/year. Get someone to do the arithmetic for you. Yes, there’s a CHANCE that your fact free prejudgment is correct. But that CHANCE is ~0.00644%. Keep hope alive, Meab….
Cold increases during the cold half of the AMO. That’s assuming the highly massaged numbers accurately reflect reality.
Only a climate alarmist would be surprised.
“Cold increases during the cold half of the AMO.”
Find an AMO that had anything approaching these increases, before the onset of AGW, in almost EVERY extreme, in almost EVERY region, and in the CONUS as a whole. Sorry Mark W., the AMO is much too weak to explain any of this. Even trying to put together natural widgits, Scaffetta style, you still come up way short.
Folks, here it comes. “Bbbbbuttt, the weather can’t be measured well, back then.” When it meets your prejudgments it sure can. But only then….
It really is sad the way bob ridicules basic science.
It’s almost as if he knows he’s lying so he has no choice.
Why do you believe the AMO is too weak to play a role in this?
Do you have any actual proof, or is that just the assumption you are forced to make in order to protect your belief system.
In any regards, the quality of weather data does degrade rapidly as you go back in time. I know your pay masters have instructed you to believe otherwise, but it remains the truth.
“Why do you believe the AMO is too weak to play a role in this?”
Because all above ground calculations of it say so. But you are shirking your responsibility here. Since YOU claim that the AMO is strong enough to result in these trends – in spite of your lack of proof that they ever have in the past, it’s up to YOU to document this.
Christopher Hitchens got it right.
“That which can be asserted without evidence, can be dismissed without evidence.”
What above ground calculations?
AMO is enough to impact global temperatures by several tenths of a degree, that’s an order of magnitude more than CO2 has been able to do.
All I did was point out that your claim of the climate getting cooler completely coincided with the negative phase of the AMO. Do you care to challenge that, or are you going to once again change the subject?
Even the P10 TCS calculations show that. THOSE above ground calculations. OTOH, you’ve got your blythe pronouncement on the aMO, backed up by what?
https://journals.ametsoc.org/view/journals/clim/24/21/2011jcli3989.1.xml
https://www.nature.com/articles/ngeo2670?message-global=remove
https://mpimet.mpg.de/fileadmin/atmosphaere/WCRP_Grand_Challenge_Workshop/Ringberg_2015/ClimSens_Mar2015.pdf
And here’s the relatively tiny, transient AMO effect.
http://ossfoundation.us/projects/environment/global-warming/atlantic-multidecadal-oscillation-amo
You mean WARMING by human released atmospheric CO2 ?
Sorry blob, but the effects of the AMO are evident in MANY MANY places
DENIAL is all you have left !
Ignorance, YET AGAIN, hey greasy slimo.
AMO has caused major Arctic sea ice fluctuation even through the LIA.
And of course , you have ABSOLUTELY NO EVIDENCE of warming by human released atmospheric CO2.
1… Do you have any empirical scientific evidence for warming by atmospheric CO2?
2… In what ways has the global climate changed in the last 50 years , that can be scientifically proven to be of human released CO2 causation?
Let’s see your yapping chihuahua act again, slimy oily one.
Leave it up to you, BigBoob, to link to data that refutes your ridiculous claim and not even know it. These extreme cold events only happen in the winter, so you have to choose “winter” in the plotter. When you do that, you’ll see that the smoothed probability of extreme cold has been hovering near constant but has actually declined in the last few years.
You routinely resort to lying but you seem to be so stupid that you can’t recognize that you’re lying.
From your link oilyboob:
That they computed percentages tells immediately that their base data did not support the chosen conclusions, or they would have referenced base data directly.
In simple terms, statistical abuse.
“That they computed percentages tells immediately that their base data did not support the chosen conclusions, or they would have referenced base data directly.”
The data WAS “referenced” correctly. The conversion of it to %age of time does nothing to to separate it from the “base data”. Where do you get this nonsense?
Again big oily shows e ins incapable of basic comprehension to do with anything to do with numbers
Really is a slop-stick clown show. !
Falsehoods and specious claims.
Wow! That’s a lot of data presented in useable format. The Reality Check of renewable energy failure, record low temperatures, and extreme weather is normal comments, will not survive the torturing of the data that is underway right now. The greenies will write their side of the story, and it will be loaded with weasel words, and the tortured data will appear, to their believers, to emphasize climate change. Wait for it.
Michael Mann has turned the media into Pavlov’s dog. Any time weather happens, the media
salivatesscreams “climate change!”The only thing I would pickup on is
“the blades become significantly heavier and there isn’t enough lift to spin them.”
I don’t think the weight will have anything to do with it, just loss of aerofoil profile reducing lift/torque.
A key part of the wind story is that Texas ended up with no wind to power the turbines right when the weather was at its coldest and demand would have been at its highest if it had been met. Winterising them would not have helped. Here’s the wind over Texas at 9 p.m. CST on 15th February (0300Z 16th)
Nice !
Thanks, that was the missing piece of the situation.
A nice graph of average and gust wind speeds vs time over the week of the crisis would help determine of wind had a chance to perform if the icing were not the problem.
Wind speeds can be to low to generate much power, and they can be to high where turbines must be shut down to prevent damage. Did either of these cases happen?
Exactly right. Icing of the turbines really didn’t matter. There was no wind when power was desperately needed.
The same is true in the hottest months, wind often drops off at the end of the day as power demand ramps up.
Thank you, Itdoesn’t add up, that was the missing element in my understanding of what happened in Texas: There wasn’t any wind! Looking at the graph, essentially there was NO WIND from the Texas-Okla panhandles to Corpus Christi. No wind; no energy, grid in “trouble”…
Another key part of the story is that Texas was in fact depending on gas in storage. This map gives a good guide to where the storage is located and shows how full it was at the end of November, ahead of the normal winter drawdowns.
https://datawrapper.dwcdn.net/66IkX/1/
Storage provided 156bcf to the South Central US during the week of 12-19th February. Being processed, dry gas, there were no problems with hydrate formation from using it: it replaced the missing production and more. Supply only fell when power cuts to compressors reduced pressures, causing a number of power stations to turn down or shut down for lack of fuel. Those power cuts were a result of inadequate planning on how to ration power cuts out.
Ultimately, the problem was having insufficient dispatchable capacity to meet demand that ERCOT estimated would have reached more than 75GW. 67GW dispatchable doesn’t cut it: it means power cuts were inevitable.
A big part of the problem of the gas supply infrastructure shutting down was loss of electric supply. At one time the gas infructure generated its own electrical supply from gas. They were forced unto the grid shutting their own generation.
“Depending on gas in storage” where? According to your link, on 30 November 2020, Harris County was the only major urban county in Texas that had ANY gas in storage of any kind. Of the other counties showing gas storage on that date, a number of them (mainly the border counties in East Texas) are not even on the ERCOT grid (look at the EIA’s beta app regarding the national grid operation map to see what I mean). So I am not sure the map actually makes the point you are trying to make. I think nickc has a better idea as to one of the many essential causes of Texas’s problems from February 14 – 17.
I think you should look at the map again. If you add it all up, you will find 827bcf in storage across the state. ERCOT has nothing to do with gas. Its availability to power stations depends on pipeline links between storage and power stations. There are lots of pipelines.
https://pvnpms.phmsa.dot.gov/PublicViewer/
“…. climate models projected that the stratosphere would cool in response to tropospheric warming through both heat retainment in the troposphere and ozone depletion in the stratosphere. Scientists touted this for decades as the undeniable human fingerprint of man-made global warming, and rightfully so, as satellite observations of lower stratospheric temperatures confirm long-term cooling since measurements began in 1979…”
I was interested in this comment, as I recall from a long time ago that the existence of a ‘Tropospheric Hot-Spot’ was regularly debated, with assertions that no such phenomenon existed, and that weather balloons could not detect it.
Is it now the case that it has been unequivocally detected? If so, I would expect it to occur in more than one dataset.
I’m also confused, but that isn’t unusual.
The ‘hot spot’ was supposedly caused by increased tropospheric water vapour over the tropics due to warming whatever the cause, water vapour being another ‘greenhouse’ gas.
If stratospheric cooling is a response to tropospheric warming I don’t see how stratospheric cooling is specifically a ‘human fingerprint’ rather than a response to any warming.
I recall my late Uncle Wayne telling about working in the Texas gas fields. He and another guy drove the gas pipelines and emptied the water traps. Told about freezing the rattle snakes that would use the pipe/traps for shade, The nat gas would escape after the water was drained.
I guess the traps still had water in them when the cold hit and stopped the gas flow.
I don’t know whether it’s true, but I also heard claims that they switched from burning gas to power pumps to using ‘clean, green’ electricity. So they had to get gas through the pipes to produce the electricity to power the pumps that moved gas through the pipes. Lose the electricity, you lose the gas, and you can’t get the electricity back from gas-fired power stations because there’s no electricity to pump it.
Nice bit of solipsistic reasoning!
Cheers
Mike
Just as hard-learned lessons in medicine have now required surgeons to spell out ALL the risks to patients before they commit to surgery or treatments, wouldn’t it be reasonable to now require power authorities to apply the hard-learned lessons from Texas and spell out ALL the risks to communities before they commit to introducing “progressive” power sources?
Wouldn’t matter when pretty much all politicians are in favor of destroy reliable power infrastructure.
Along those lines, I have suggested that those who sign up for green energy, (in Texas you choose your supplier and a number of cities and individuals have signed up for green energy) be the first cut off when wind power fails. I’m willing, as a supporter of coal, nuclear and natural gas to take a hit if those sources fail. So every time wind power drops, those with green energy contracts lose power. The problem, like so many government systems today, is that those supporting bad policies and making poor decisions don’t suffer the consequences.
Can’t get fairer than that approach Patrick.
Would you rather rely on fossil fuel and live or rely on wind power and freeze to death? Ben Franklin’s quote is quite telling and so is God’s quote: I place before you life and death, I suggest you choose life.
To be sarcastic and that is what free speech of all about, If climate change is man made and is causing colder weather the problem can be found in archeology and mining. Digging deeper to find the cause of the ice ages that lasted a long time and how man caused it.
Those who believe in climate change as man made should not look at the Sun or the change in tile of the Earth. Maybe 30 years is not long enough to determine climate.
This is an excellent article and should be read by politicians but it won’t be because they seldom read the bills they impose on the rest of us.
“pipes inside homes and businesses froze, contracted, and burst to release pressure, flooding buildings with insane amounts of water”
Don’t most buildings have a master valve to shut off water entering the building? I’m just guessing as I have no clue but I’ve owned several houses and they all have/had such valves. I should think if that valve is shut- flooding would be minimal.
You would be amazed how many homeowners don’t know what a shut off valve is. (Probably don’t have a wrench big enough to turn it, even if they knew where it was.)
If you have natural gas, it’s even more important to know where that shut off valve is.
Amen! Homeowners needed to do their part in preparations too.
Here is South Central Texas where I live, I happen to be outside for a few minutes on Wednesday afternoon, 2/17/21, when I heard someone talking. Turns out my across-the-street neighbor (a middle aged single woman) had a pipe break (fortunately an outside faucet) and was talking on the phone with her handyman as he attempted to tell her how to shut off the water at the meter. I told her to wait a minute, and went and got my water meter shutoff wrench that I keep just inside my garage door, and shut off her water.
I told her the universe was really looking out for her.
When the water in a pipe freezes, it expands. That’s what cracks the pipes.
If you’re expecting a cold night, open the doors of the cabinets in your kitchen and bathrooms to let the house’s heat keep your pipes from freezing. (You can also let the faucet drip.)
If you are also experiencing a power outage that becomes extended, after you’ve shut off the water main, open the highest faucets (hot and cold) and the lowest faucets (hot and cold) in your house to drain the lines. (If that might result in draining your hot water heater, throw the breaker an/or turn of the gas to it until it is refilled.)
And from the NOT skeptical, skeptical science web site:
Why renewable energy was not to blame for the Texas blackouts
https://skepticalscience.com/texas-cant-blame-renewables.html
Hey, it really bugs me that the site’s motto is “getting skeptical of global warming skepticism”. So I asked there once- if it’s OK to be skeptical of people who are skeptical of global warming skepticism- and for that I was told one more comment like that and I’d be locked out.
They can’t stand criticism. It’s pathetic. They run and hide. Banning you from their conversation is them “running and hiding”.
You should’t try reasoning with them because, as you can see, they are not reasonable people. They are fearful people, fearful their worldview is not the correct one. If they don’t delve into the subject, then they can continue to live in the false reality they have created for themselves, or have had created for them by others with regard to CO2.
People don’t like their worldview being turned upside down. So they resist that happening to them by mentally blocking out things that don’t fit with their worldview. It’s a common human habit which everyone does to one degree or another, but it’s on steriods when it comes to climate alarmism. They hang on to that CO2 boogey man for dear life!
I’m going to have to write “The Psychology of Alarmist Climate Science” one of these days. It’s really convoluted. Their psychology, not the future book.
When I talk to climate alarmists- it’s exactly like, decades ago, I often, for the fun of it, would debate with hard core fundamentalist bible thumpers who tried to convince me there really was a Great Flood and Adam and Eve. The Great Flood should be seen as the first of the climate emergency fantasies- showing how the climate thing has so many comparisons to religion. Recently, Greta Thunberg and a few “climate scientists” met with the Dalai Lama to get his blessing. Yes, the climate “emergency” is the latest and most fanatic of all religions.
I guess that book on the psychology of alarmists has already been written. It is titled, “The Madness of Crowds . . .”
First Texas has far and away more wind generation than any state in the Union, then comes CA, and Oklahoma is third, according to the EIA.
Rick Perry, former Sec of Energy and Gov of Texas, lays much of the blame for the failure of natural gas on Obama’s mandate that compressor stations move from powering their compressors with electricity, and away from natural gas. I assume this was for climate mitigation. They of course shut down when the grid began to falter causing a multiplicative effect.
Takes two to tango – is there any record that Perry or Texas resisted the mandate?
Good question.
In 2016, the EPA issued a ‘strong recommendation’ that pipeline operators convert to electric compressors. It’s unlikely that many conversions have been made, but even so, I don’t know if Texas has any electric gas compressors in operation.
Meredith Angwin is an expert in electric power grid oversight and governance. For four years, she served on the Coordinating Committee for the Consumer Liaison Group associated with ISO-NE, her local grid operator. She teaches courses and presents workshops on the electric grid.
Her recent article concerning the Texas blackouts appears on Rod Adam’s Atomic Insights blog:
Five Myths about the Lone Star Blackout
https://atomicinsights.com/five-myths-about-the-lone-star-blackout/
She is also the author of:
Shorting the Grid: The Hidden Fragility of Our Electric Grid.
https://www.amazon.com/Shorting-Grid-Hidden-Fragility-Electric-ebook/dp/B08KZ51SDP
The Amazon blurb for her book reads:
“When rolling blackouts come to the electric grid, they will be old news to the grid insiders. Only the electricity customers will be surprised. Grid insiders know how fragile the grid is becoming. Unfortunately, they have no incentive to solve the problems because near-misses increase their profits. Meredith Angwin describes how closed meetings, arcane auction rules, and five-minute planning horizons will topple the reliability of our electric grid. Shorting the Grid shines light on our vulnerable grid. It also suggests actions that can support the grid that supports all of us.”
Texas regulator warns lawmakers against rollback in storm power prices
https://mobile.reuters.com/article/amp/idUSKBN2B324R?__twitter_impression=true
Governor Greg Abbott named Arthur D’Andrea as chair of the Public Utility Commission on March 3, 2021. Chairman D’Andrea was first appointed to the Commission on November 14, 2017, for a term set to expire on September 1, 2023.
https://www.puc.texas.gov/agency/about/commissioners/dandrea/Biography.aspx
This “regulator” has been on the job for only a week..
Unless I missread, the author seems all in on human caused “climate change”. We are still warming from the LIA. Like to read his thoughts on that.
Hopefully, natural gas producers in Texas will learn their lesson and start winterizing their pipes, pumps, and other processing facilities, so that the gas supply will be there at the time of maximum demand. There are also natural gas wells in PA and OH that don’t stop producing during snowstorms, because snow is routine in those states, and the producers are prepared for it.
As for wind turbines, an article on this site from a few days ago showed that ice accumulation during a snowstorm or freezing-rain storm tends to be heaviest at the far end of the blades. If a raindrop strikes a rotating turbine blade, gravity and centrifugal force act in opposite directions when the blade is at the top of its rotation, but act in the same direction when the blade is at the bottom of its rotation, so that a raindrop will flow outward more at the bottom then it will flow inward at the top, resulting in water (and ice, if the temperature is below freezing) accumulating most at the end of the blades.
This not only disrupts the airfoil shape of the blade and reduces “lift” (driving force), but ice accumulation at the ends also increases the angular moment of inertia of the turbine (integral of mass * radius squared), so that more torque is needed to keep the turbine rotating. With less driving force and a higher moment of inertia, this causes the turbine to turn more slowly for the same wind speed.
All true enough. But they don’t turn at all unless the wind is strong enough.
In Central Florida, it Occasionally freezes. When Texas-style below average temperatures shut off my water by freezing the well-head, I learned to pile straw around it the next time.
Up North, heat-tape will do the same thing, even on a Natural Gas well. Or you could just use a gas-powered Radiant heater!
The assertions that the cold was due to global warming, followed by a hand waving explanation, is a part of science – not science. The proto postulate gets mulled on a bit then becomes a postulate, then a testable hypothesis etc. Then, maybe, a scientific fact.
The new paradigm is that it’s science if a scientist says it on CNN.
Damn stupid.