Last month we introduced you to the new reference site EverythingClimate.org
We would like to take advantage of the brain trust in our audience to refine and harden the articles on the site, one article at a time.
We want input to improve and tighten up both the Pro and Con sections, (Calling on Nick Stokes, etc.)
We will start with one article at at time and if this works well, it will become a regular feature.
So here’s the first one. Please give us your input. If you wish to email marked up word or PDF documents, use the information on this page to submit.
Measuring the Earth’s Global Average Temperature is a Scientific and Objective Process

Pro: Surface Temperature Measurements are Accurate
A new assessment of NASA’s record of global temperatures revealed that the agency’s estimate of Earth’s long-term temperature rise in recent decades is accurate to within less than a tenth of a degree Fahrenheit, providing confidence that past and future research is correctly capturing rising surface temperatures.
….
Another recent study evaluated US NASA Goddard’s Global Surface Temperature Analysis, (GISTEMP) in a different way that also added confidence to its estimate of long-term warming. A paper published in March 2019, led by Joel Susskind of NASA’s Goddard Space Flight Center, compared GISTEMP data with that of the Atmospheric Infrared Sounder (AIRS), onboard NASA’s Aqua satellite.
GISTEMP uses air temperature recorded with thermometers slightly above the ground or sea, while AIRS uses infrared sensing to measure the temperature right at the Earth’s surface (or “skin temperature”) from space. The AIRS record of temperature change since 2003 (which begins when Aqua launched) closely matched the GISTEMP record.
Comparing two measurements that were similar but recorded in very different ways ensured that they were independent of each other, Schmidt said. One difference was that AIRS showed more warming in the northernmost latitudes.
“The Arctic is one of the places we already detected was warming the most. The AIRS data suggests that it’s warming even faster than we thought,” said Schmidt, who was also a co-author on the Susskind paper.
Taken together, Schmidt said, the two studies help establish GISTEMP as a reliable index for current and future climate research.
“Each of those is a way in which you can try and provide evidence that what you’re doing is real,” Schmidt said. “We’re testing the robustness of the method itself, the robustness of the assumptions, and of the final result against a totally independent data set.”
https://climate.nasa.gov/news/2876/new-studies-increase-confidence-in-nasas-measure-of-earths-temperature/
Con: Surface Temperature Records are Distorted
Global warming is made artificially warmer by manufacturing climate data where there isn’t any.
The following quotes are from the [peer reviewed] research, A Critical Review of Global Surface Temperature Data, published in Social Science Research Network (SSRN) by Ross McKitrick, Ph.D. Professor of Economics at the University of Guelph, Guelph Ontario Canada.
“There are three main global temperature histories: the United Kingdom’s University of East Anglia’s Climate Research Unit (CRU-Hadley record (HADCRU), the US NASA Goddard’s Global Surface Temperature Analysis (GISTEMP) record, and the US National Oceanic and Atmospheric Administration (NOAA) record. All three global averages depend on the same underlying land data archive, the US Global Historical Climatology Network (GHCN). CRU and GISS supplement it with a small amount of additional data. Because of this reliance on GHCN, its quality deficiencies will constrain the quality of all derived products.”
As you can imagine, there were very few air temperature monitoring stations around the world in 1880. In fact, prior to 1950, the US had by far the most comprehensive set of temperature stations. Europe, Southern Canada, the coast of China, the coast of Australia and Southern Canada had a considerable number of stations prior to 1950. Vast land regions of the world had virtually no air temperature stations. To this day, Antarctica, Greenland, Siberia, Sahara, Amazon, Northern Canada, the Himalayas have extremely sparce if not virtually non-existent air temperature stations and records.

“While GHCN v2 has at least some data from most places in the world, continuous coverage for the whole of the 20th century is largely limited to the US, southern Canada, Europe and a few other locations.”

Top panel: locations with at least partial mean temperature records in GHCN v2 available in 2010.
Bottom panel: locations with a mean temperature record available in 1900.
With respect to the oceans, seas and lakes of the world, covering 71% of the surface area of the globe, there are only inconsistent and poor-quality air temperature and sea surface temperature (SST) data collected as ships plied mostly established sea lanes across all the oceans, seas and lakes of the world. These temperature readings were made at differing times of day, using disparate equipment and methods. Air temperature measurements were taken at inconsistent altitudes above sea level and SSTs were taken at varying depths. GHCN uses SSTs to extrapolate air temperatures. Scientist literally must make millions of adjustments to this data to calibrate all of these records so that they can be combined and used to determine the GHCN data set. These records and adjustments cannot possibly provide the quality of measurements needed to determine an accurate historical record of average global temperature. The potential errors in interpreting this data far exceed the amount of temperature variance.

“Oceanic data are based on sea surface temperature (SST) rather than marine air temperature (MAT). All three global products rely on SST series derived from the International Comprehensive Ocean-Atmosphere Data Set (ICOADS) archive, though the Hadley Centre switched to a real time network source after 1998, which may have caused a jump in that series. ICOADS observations were primarily obtained from ships that voluntarily monitored sea surface temperatures (SST). Prior to the post-war era, coverage of the southern oceans and polar regions was very thin.”
“The shipping data upon which ICOADS relied exclusively until the late 1970s, and continues to use for about 10 percent of its observations, are bedeviled by the fact that two different types of data are mixed together. The older method for measuring SST was to draw a bucket of water from the sea surface to the deck of the ship and insert a thermometer. Different kinds of buckets (wooden or Met Office-issued canvas buckets, for instance) could generate different readings, and were often biased cool relative to the actual temperature (Thompson et al. 2008).”
“Beginning in the 20th century, as wind-propulsion gave way to engines, readings began to come from sensors monitoring the temperature of water drawn into the engine cooling system. These readings typically have a warm bias compared to the actual SST (Thompson et al. 2008). US vessels are believed to have switched to engine intake readings fairly quickly, whereas UK ships retained the bucket approach much longer. More recently some ships have reported temperatures using hull sensors. In addition, changing ship size introduced artificial trends into ICOADS data (Kent et al. 2007).”
More recently, the temperature stations comprising the set of stations providing measurements used in the GHCN have undergone dramatic changes.
“The number of weather stations providing data to GHCN plunged in 1990 and again in 2005. The sample size has fallen by over 75% from its peak in the early 1970s, and is now smaller than at any time since 1919. The collapse in sample size has not been spatially uniform. It has increased the relative fraction of data coming from airports to about 50 percent (up from about 30 percent in the 1970s). It has also reduced the average latitude of source data and removed relatively more high-altitude monitoring sites. GHCN applies adjustments to try and correct for sampling discontinuities. These have tended to increase the warming trend over the 20th century. After 1990 the magnitude of the adjustments (positive and negative) gets implausibly large. CRU has stated that about 98 percent of its input data are from GHCN. GISS also relies on GHCN with some additional US data from the USHCN network, and some additional Antarctic data sources. NOAA relies entirely on the GHCN network.”

To compensate for this tremendous lack of air temperature data, in order to get a global temperature average, scientists interpolate data from surrounding areas that have data. When such interpolation is done, the measured global temperature actually increases.
NASA Goddard Institute for Space Studies (GISS) is the world’s authority on climate change data. Yet, much of their warming signal is manufactured in statistical methods visible on their own website, as illustrated by how data smoothing creates a warming signal where there isn’t any temperature data.
When station data is used to extrapolate over distance, any errors in the source data will get magnified and spread over a large area2. For example, in Africa there is very little climate data. Say the nearest active data station from the center of the African Savannah is 400 miles (644km) away, at an airport in a city. But, to cover that area without data, they use that city temperature data to extrapolate for the African Savannah. In doing so They are adding the Urban Heat Island of the city to a wide area of the Savanah through the interpolation process, and in turn that raises the global temperature average.
As an illustration, NASA GISS published a July 2019 temperature map with 250 KM ‘smoothing radius’ and also one with 1200 KM ‘smoothing radius.3’ The first map does not extrapolate temperature data over the Savanah (where no real data exists) and results in a global temperature anomaly of 0.88 C. The second, which extends over the Savanah results in a warmer global temperature anomaly of 0.92 C.
This kind of statistically induced warming is not real.


References:
- Systematic Error in Climate Measurements: The surface air temperature record. Pat Frank, April 19, 2016. https://wattsupwiththat.com/2016/04/19/systematic-error-in-climate-measurements-the-surface-air-temperature-record/
- A Critical Review of Global Surface Temperature Data, published in Social Science Research Network (SSRN) by Ross McKitrick, Ph.D. Professor of Economics at the University of Guelph, Guelph Ontario Canada. https://papers.ssrn.com/sol3/papers.cfm?abstract_id=1653928
- NASA GISS Surface Temperature Analysis (v4) – Global Maps https://data.giss.nasa.gov/gistemp/maps/index_v4.html
I think it is manifestly ludicrous to make claims of changes of temperature of a tenth or hundredth of a degree in a record kept to the nearest whole degree. This is not measuring the same thing multiple times, where averaging is reasonable, but measurements of different things multiple times, where the dice have no memory.
I agree, and would add the following observation – the calibration of the thermometers used, both accuracy and precision needs to be taken into account. For example, in the 1800s, little is known about the thermometers actually used in the bucket measurements of seawater temperature thus a potential error of several degrees must be added to the data unless both precision and accuracy can be demonstrated (ie calibration records traceable back to the standards in the UK of other national standards). If we don’t KNOW the ‘exact’ temperature to within one degree it is very hard to make an argument that the average is ‘better’ [see Tom’s comment] and it is impossible to use that data to argue that the temperature has risen – or lowered unless the uncertainty figure is exceeded.
This is blindingly obvious to any physical scientist, but apparently not to Climate “Scientists”.
We might be better using the ‘Koppen’ climate classification whereby those areas of the world with similar climate are grouped together and not with those climatic regions that have little relevance to them
Köppen Climate Classification System | National Geographic Society
tonyb
I couldn’t agree more. The Koppen scheme (sorry, can’t render the umlaut) is simple, intuitive, and rooted (pun!) in the real, observable world of plants and Earth, rather than in fictions like global temperature.
Glass tube thermometers made today, with what I would assume would be tighter manufacturing tolerances than were available 150+ years ago, are not accurate enough to give anything more than an indication of temperature. The “calibration” method shown in this video only require that the distance between the hot and cold marks falls within a range of a pre-printed scale, of which there are many. Add in the complication of different manufacturers, hand-written records and the possible misreading of those records by a dyslexic collator and I’m pretty sure that any claim of historic records being accurate to 1/10th of a degree are dubious to say the least.
nw sage.
I agree.
I know that I and my colleagues were trying our best when we took sea water surface temperatures from ships, but the instruments [calibrated by the Met Office on the ships i sailed on, and later was responsible for] were used in a bucket of sea water that may have come from anywhere in the top meter or so of the ocean.
And the readings were sometimes taken in the dark, or in rougher weather.
Also it is important to be aware of the size of the oceans of the world.
They cover some 120 million square miles.
So, even 4,000 Argo floats are each covering about 30,000 square miles.- a quarter more than West Virginia, or about the same area as Armenia, for each reading.
The volume of the world’s oceans can be approximated to 1000 million cubic kilometres [not precise, but of the close order].
Satellites, I understand, measure the surface temperature. Argo floats – one per quarter of a million cubic kilometres – do give a sense of temperatures below the surface.
But when calculating the mass of an oil cargo, a tank of ten thousand cubic meters will have two or three temperatures taken – more these days on modern ships – yet the oceans are assumed to be accurately measured with one temperature profile, on one occasion, for twenty five million times that.
It all suggests to me that conclusions are based in little data, some, perhaps, not terribly good.
Auto
I think William Shakespeare had the right thoughts about this whole discussion, in the title of his play, “Much Ado about Nothing”. What difference does it make when WE can’t do anything about it? The only thing we can do is screw it up with a “nuclear winter”, and hopefully we won’t be that stupid. “Glow bull warming” is just another scam to move money around, from the poor to the rich. Mankind is just a speck on the “elephants butt” in relation to the the planet Earth. The greening of the Earth from more CO2 is a benefit, not a problem.
I am old enough to remember when the Turco, Toon, Ackerman, Pollock, and Sagan study came out, and as it was one of the first climate computer models, it was largely a crock, but highly influential.
As I sit here writing this I look out over the Blue Ridge mountains of Virginia, that look pretty and soft from the trees covering them. Get out the binoculars, and look at the bare spots where nothing grows and you realize that you are looking at a rock pile of limestone that once laid on the bottom of an ocean, and now eons later have been pushed up into mountains, covered with a thin patina of trees. The whole idea that mankind can control the climate of the Earth is as absurd, as trying to change the tectonic forces that made those mountains.
Don’t worry. Once we have stopped climate from changing we will have gained enough experience to move to the next level and stop tectonic change.
A great line from the movie Jurassic Park:
Malcolm:
“Yeah, but your scientists were so preoccupied with whether or not they could, they didn’t stop to think if they should.”
Why are we trying to calculate an average temperature in order to study climate. Memory and processing power should be sufficient to study daily highs and lows. We could still calculate anomalies from the highs and lows and do global averages of the anomalies. I am more interested in my regional climate and I define that climate by the range in this region. Just imagine an average of 25C could mean an average range of 25C to 30C or a range of 0C to 50C. Two much different climates wit the same average. Also by using daily highs and lows there should be fewer corrections needed.
Instead of presenting averages of mid-range values, the anomalies should be calculated for the highs and lows, and then averages of the high/low monthly values presented. Averages can hide a multitude of sins, especially when the highs and lows have different long-term behaviors.
Absolutely!! Global is a meaningless term. We should strictly view climate changes in defined regions. For example, how has the climate changed in the NE United States, the SE United States, the SW United Stated, the Great Plains, the Arctic, the Sahara Dessert, ETC … We all know that the “global” average is being driven by Arctic changes. Changes in the arctic with no change somewhere else is meaningless to somewhere else.
Completely absurd. There is no such thing as “Adjusted Data.” Read the instrument, write it down, end of story.
Michael,
The opposite is true. There is no such thing as raw data. Everything is processed or adjusted to some extent. Take a simple thermometer, is the raw data the height of the mercury in the tube or is it the adjusted data that converts that height into Celsius. More modern instruments count the flow of electrons across a resistor but then adjust that so that all you see on the screen is a temperature.
Thanks for CONFIRMING that surface measurements an all the calculations are RIDDLED with erros of MANY TYPES and anyone thinking they can “average” them to even 1/10 degree is talking absolute BS
You know, like YOU do all the time.
What utter nonsense. The fact that you’d even write such a thing to present company is an indication of just how out of touch you are with reality. It’s a question of accuracy and precision. The trick is to make consistent, reliable tools able to measure to the true value with the greatest accuracy … then have everyone use the same instrument in the same way (precision).
You really don’t understand the scientific method, do you?
Don’t forget repeatability.
Accuracy, precision (scale increment), and repeatability.
If an instrument has high repeatability, even though it is out of cal and not accurate, by knowing the offset, you can reliably adjust the data.
If it has low repeatability, it will read a different value for the same value of temperature (within the accuracy tolerance). In this case the actual temperature should be shown with error bars.
It does seem that folks are trying to ascribe greater precision, 1/10th of a degree when the thermometers had a scale reading of 1 or 2 degrees.
In the Navy we were allowed to record measurements no smaller than 1/2 the scale increment. Most gages were big enough that this could be done.
We all knew you were an idiot, but thanks so much for confirming it.
You get dumber and dumber with each post.
What? No such thing as raw data? How totally ignorant to say such a thing. As someone who has participated in the collection of raw data on sea levels, I know whereof I speak! You, sir, are a buffoon, to make such a foolish statement.
True conversion is not adjustment. To conflate the two shows your ignorance. But then maybe you are a post-modernist, in which case you aren’t worth debating.
Paul,
I do not think you realise the amount of data processing and conversion that goes on to make even a simple measurement. Suppose for example I want to measure the length of a room. I can go out and buy a laser distance meter for about $100 that has an accuracy of about 10^-4 and a digital display that gives an almost instant reading.
Now ask what is the device actually doing? Well it works by sending out a frequency modulated laser beam and then comparing the frequency of the returned signal to the current frequency. It does this by interfering the two on a photodetector and looking at the instantaneous frequency of the resulting current. A similar issue arises with how the device measures time — there is a quartz crystal inside vibrating at some frequency which again is recorded as a voltage across a resistor. Finally because all the signals are noisey there is a lot of averaging and data processing inside the device to produce a sensible signal.
So what is the raw data? Is it the frequency of the returned laser signal? Is it the
number of electrons that passing through a particular resistor? Is it the difference frequency between the returned beam and the current one? Or are you going to say that all of that is irrelevant since it happens inside a cheap piece of kit and the raw data is whatever is output on the screen?
Go read the GUM and attempt to educate yourself.
Mr. Walton;
Even though there are the details of how an electronic measurement is taken, such devices are calibrated so that the final output reads what is intended. They have a resolution (or precision), and ratings for accuracy and repeatability. In some cases the accuracy is less than the precision.
For instance: Calipers that measure length to +/- .0005 are a classic example. The accuracy is stated as +/- .001. However, when you use them to measure the same gage block (accuracy to .0002 or better) you will find that the calipers read the same measurement each time you take a reading (repeatability).
The “raw data” as you describe, is the value output by the instrument.
If an instrument is out of cal the next time it is calibrated, that calls in to question all measurements between this calibration and the previous one. You don’t really know when the instrument began to drift from the accurate measurement. If the instrument is impacted somehow and there is a step jump in the record where you can tell when the data was corrupted, then you may be able to adjust the data with a larger degree of confidence.
Think of a micrometer. How “tight” do you screw it against what is being measured? Not quite touching? So tight you can’t move anything (e.g. around a journal)? That affects accuracy and repeatability but not precision. Some of the high priced micrometers have a torque break in them so the tightness is more precise. This helps accuracy and repeatability but doesn’t impact precision. (it helps accuracy and repeatability but it doesn’t cure it. the torque trigger can wear for instance)
Right over their heads, Mr. Walton…..
Does one “count the flow of electrons across a resistor,” or measure the electromotive force between the ends of the resistor?
Often times there is no way to make a direct measurement of a physical parameter, so a proxy measurement is used, and converted to the desired one with a mathematical transform, such as Ohm’s Law. The point is, the ‘raw data’ are what can be obtained with some instrument that is immediately sensing or measuring the parameter of interest. Even if it is a proxy or indirect measurement, it has not experienced subsequent adjustments beyond the necessary mathematical transform, which may displayed in the desired units.
It strikes me that the people who make really ignorant claims are the very one’s who think that skeptics are fools. What does that indicate?
“Read the instrument, write it down, end of story.”
It isn’t the end of the story. The topic here is the global average temperature. There is no instrument you can read to tell you that. Instead you have to, from the station data, estimate the temperature of various regions of the Earth, and then put them together in an unbiased way. That is where the adjustment comes in.
The real story is that the “global average temperature” is a completely meaningless and ill-defined quantity, regardless of whatever input data are used.
Oh, and “estimation” really means extrapolation.
I don’t believe in the man-made global warming story, but I think it is bad to throw out this lame concept that there is no such thing as global average temperature.
A “mean” is the value you would expect for some observation, given no other information. Given no other information, if you were to guess the height of the next adult male and female to walk through the door, your best guess – meaning the guess with the smallest error trial after trial, would ber the mean.
If you go on a cruise to the Caribbean, I can tell you how to pack. That will be different from how I would tell you to pack if you are taking a cruise to Alaska.
An alien deciding whether to vacation on Earth or Venus could benefit from knowing the mean planet temperature.
Let’s quit leaning on this one dumb idea that “there is no such thing as average global temp.”
The “global average temperature” exists purely as a mathematical calculation. It isn’t the measurement of an actual thing. People pretend to predict the effect that changes in the global average temperature will have on living things, even though no living thing on Earth can actually sense the “global average temperature” and therefore has no means of responding to it. Living things can only respond to actual local temperatures that they can sense. Knowing where the GAT is going tells one nothing about what might happen locally. It is no more meaningful than calculating the global average length of rope, which can also be done in a “scientific and objective process.”
You remind me of the guy with one hand in boiling water and the other in ice water. On average, his hands feel fine. Seriously, the global average temperature doesn’t tell you anything about whether there is a problem or not.
In addition, the computed average is entirely dependent on the distribution of temperature stations, you get a different answer if the distribution changes; are more stations on top of mountains or in low laying deserts? Are more in populated areas or out on the ocean? Are more in the tropics or in Antarctica? Since the global coverage cannot be uniform, the average relies on extrapolation, interpolation, or area averages – all with unavoidable gross errors.
If we could measure the exact energy content of every single molecule in the atmosphere, then we could calculate a highly accurate average temperature for the entire atmosphere with complete precision.
If we could measure the energy content of every single molecule in the atmosphere with a small margin of error, then we could calculate the average temperature for the entire atmosphere with that same margin of error.
If we could measure the energy content of every other molecule in the atmosphere with a small margin of error, then we could still calculate an average, but to the margin of error from the measurements, we would have to add an extra margin of error to account for the fact that we can only estimate what the energy in the unmeasured molecules is.
As the percentage of molecules that we are measuring goes down, the instrument error stays the same, but the factor to account for the unmeasured molecules goes up.
When we get to the point where we only have a few hundred, non-uniformly distributed instruments trying the measure the temperature of the atmosphere, the second error gets huge.
With multiple measurements, assuming your errors are randomly distributed around the true temperature, you can reduce the portion of the error that comes from instrument error. But no amount of remeasuring will reduce the error that comes from the low sampling rate.
Generating data, by assuming that the unmeasured point has a relationship with surrounding points, may make it easier for your algorithms to process the data, but it does nothing to reduce these errors.
Nice explanation, Mark. I would only say that temperature alone means nothing when measuring the atmosphere. When you speak of “energy” you are speaking of the heat content of the atmosphere – enthalpy. And the enthalpy depends on more factors than temperature. Pressure (altitude) and specific humidity must also be known to calculate enthalpy.
The use of temperature by so-called climate scientists as a proxy for enthalpy is a basic mistake in physics. Since around 1980 most modern weather stations give you enough data to calculate enthalpy – that’s 40 years worth of data. Why don’t the so-called climate scientists, modelers, and mathematicians convert to using enthalpy in their studies and CGM models?
(hint: money)
Knowing the enthalpy of the atmosphere tells us nothing about the thermal equilibrium of the planet with outer space. Knowing the temperature does.
For gases the temperature is directly related to enthalpy. ∆H = Cp∆T
We know the heat capacities of all the gases so we can easily work out the enthalpy of the atmosphere if we want to (which we don’t). Moreover the change in T tells us the change in enthalpy. So stop trying to over-complicate it. Using temperature is far easier and more informative.
Temperature tells you nothing about the thermal equilibrium of the planet either. It is *heat content* that establishes that equilibrium and heat content is enthalpy, not temperature.
Your equation is based on ∆H and ∆T, not on H and T.
∆T can be from any temp to any temp.
For moist air, enthalpy is
h = h_a + (m_v/m_a)h_g
and h_a = (C_pa)T
Utter garbage again from Tim. Go away and learn some thermodynamics.
Zeroth law of thermodynamics:
“If two thermodynamic systems are each in thermal equilibrium with a third one, then they are in thermal equilibrium with each other.”
What determines thermal equilibrium? The TEMPERATURE DIFFERENCE. Not enthalpy or specific enthalpy or even the Gibb’s free energy. Heat flows from hot objects to cold ones. The hot ones are not the ones with the most enthalpy, they are the ones with the highest temperature.
What determines the amount of heat the planet radiates? TEMPERATURE.
In particular the Stefan-Boltzmann equation which depends ONLY on temperature.
“What determines thermal equilibrium? The TEMPERATURE DIFFERENCE.”
As with so many in climate science, enthalpy of the air is ignored as is the latent heat. Those determine much of the thermal equilibrium of the atmosphere and therefore Earth. You talked about thermal heat transferred to space. That really makes no sense.The Zeroth Law speaks to *thermal* equilbirium. Space is nothing, you cannot transfer heat to space via conduction so how does the atmosphere get in thermal equilibrium with space?
Heat flows from hot to cold *thermally*, but not if there is a vacuum in between.
Radiative equilibrium is NOT thermal equilibrium. You mentioned only thermal equilibrium. Stop moving the goal posts.
I’m not surprised you have now moved the goal post to radiative equilibrium.
Do you have any qualifications in physics?
If you do then you should know that outer space has a temperature of 3K even though it is a vacuum. Ever heard of the cosmic microwave background (CMB)?
“…how does the atmosphere get in thermal equilibrium with space? “
It gives off infrared radiation and absorbs solar radiation from the Sun.
“Heat flows from hot to cold *thermally*, but not if there is a vacuum in between. “
How do you think heat/energy gets from the Sun to Earth?
If it is unbiased, why is it that every alteration makes the imagined “problem” worse?
Why does it never happen that some work is done, and the result is that “it is nowhere near as bad as we thought”?
Use satellite and radiosonde-estimated temperatures and get away from all this bickering about the past.
Yes, Nick the combining and whim driven “adjustment , infilling of missing data, smearing of urban temperatures of huge areas where they don’t belong
You KNOW the surface data fabrications are a complete and absolute FARCE,
STOP trying to defend the idiotically indefensible.. !
“and then put them together in an unbiased way”
.
ROFLMAO..
Do you REALLY BELIEVE that is what happens, Nick
WOW, you really are living in a little fantasy land of your own, aren’t you , Nick !!
Is it those tablets you take to keep you awake ???
Fred, these sort of comments don’t help…they just make WUWT look silly. We may well not agree with everything Nick says but let him have his say. It just makes us look childish by ridiculing him in the manner you have done in these two comments. WUWT has higher standards than that.
Alastair, if you want to protect and namby-pamby those that want to destroy western society…….. That’s up to you.
Nick deserves absolute ridicule he for supporting this scam.
Do YOU really believe the scammers that put together the farcical “global land temperatures ” are NOT extremely biased ? !!!
Nick could end the ridicule by stopping the ridiculous claims.
Mmmmm … well, yes it is the end of story. It’s a question of accuracy and precision. The trick is to make consistent, reliable tools able to measure to the true value with the greatest accuracy … then have everyone use the same instrument in the same way (precision). The Victorian scientists, engineers and tool makers accomplished that, often with great beauty. That’s why older measurement are often superior to the modern data sets … too much post measurement manipulation of the data.
In any event, “the global average temperature” really has no importance at all. It’s an artificial number intended to be used politically. It has no more to do with science than discussing the Earth’s climate. There is no “climate” in the singular.
“It has no more to do with science than discussing the Earth’s climate. There is no “climate” in the singular.”
Yeah there is, we in an icehouse climate.
And we are in Ice Age due to our cold ocean.
The average temperature of entire ocean is one number that indicates
global climate. The present average volume temperature of our ocean is about 3.5 C.
Our ocean temperature would have to exceed 5 C before one could imagine we might be leaving our Ice Age.
Or before Earth entered our icehouse climate, the Earth oceans were somewhere around 10 C.
Would love to know where you got those temperatures. All I know is that the surface sea temperatures rarely if ever get above 30C and there are good thermodynamic reasons for that when you delve into the properties of water. How one measures the volume temperature beats me.
It’s commonly said that 90% of ocean is 3 C or colder. Here something:
“The deep ocean is all the seawater that is colder (generally 0-3°C or 32-37.4°F), and thus more dense, than mixed layer waters. Here, waters are deep enough to be away from the influence of winds. In general, deep ocean waters, which make up approximately 90% of the waters in the ocean, are homogenous (they are relatively constant in temperature and salinity from place to place) and non-turbulent.”
https://timescavengers.blog/climate-change/ocean-layers-mixing/
But 3.5 C number I seen in few times. I just google: Average volume temperature of ocean of Earth ocean 3.5 C:
Jan 4, 2018 — The study determined that the average global ocean temperature at the peak of the most recent ice age was 0.9 degrees Celsius and the modern ocean’s average temperature is 3.5 degrees Celsius.
https://economictimes.indiatimes.com/news/science/oceans-average-temperature-is-3-5-degree-celsius/articleshow/62363696.cms
And next is:
https://manoa.hawaii.edu/exploringourfluidearth/physical/density-effects/ocean-temperature-profiles
Few more down is:
https://manoa.hawaii.edu/exploringourfluidearth/physical/density-effects/ocean-temperature-profiles
Nope. The planet is enjoying a warm, interglacial period of the present Quaternary ice age known as the Holocene.
The rest of your post has nothing to do with my statement (non sequitur).
This Quaternary Ice Age has been the coldest Ice Age within the last 34 million years of our global Icehouse Climate.
Climate is the average weather @ur momisugly a particular location over time. What part of LOCATION do you not understand? Our planet doesn’t have a climate in any meaningful way. Even when the planet was mostly frozen there were always zones different from the others.
In Victorian times, clowns like Michael Mann would have been drummed out of polite society for their dishonesty and incompetence. Can you imagine the great engineers and scientists of that era like Brunel and Kelvin fiddling their data?
There would have been letters written to The Times, by gawd!
I’m sorry, did you just say “estimate”? I’m hoping that was a slip of the keyboard, but otherwise, I’ll take direct measurements over “estimates” any day of the week.
Wearily, again, there is no instrument that measures global surface temperature. That doesn’t mean we know nothing about it.
You still genuinely believe one can average an intensive variable like temperature?
You can carry out the calculation, but the result has very limited usefulness. It certainly can’t tell you anything useful about the energy gain/loss of a large volume of gas.
It’s rather like averaging phone numbers or more appropriately, street addresses. Sure you get a number, but what does it mean. It certainly fools the masses, though.
If your goal is to look at change of temperature – then there is absolutely no need to adjust the data from a homogenous data series. The only reason anyone would adjust the data and average it, is if they can’t get the biased result they want from doing it properly.
Winner, Winner, Chicken Dinner!
The problem is that climate scientists believe that making up missing data, makes all of the data better.
“It isn’t the end of the story. The topic here is the global average temperature. There is no instrument you can read to tell you that. Instead you have to, from the station data, estimate the temperature of various regions of the Earth, and then put them together in an unbiased way. That is where the adjustment comes in.”
Why do we need an “average” global temperature at all?
The only benefit it seems is to allow unscrupulous Data Manipulators to create a temperature profile made up out of thin air that promotes the Human-caused Climate Change scam, but does not match any regional surface temperature profile anywhere on Earth.
In fact, the global temperature profile is the opposite of the actual regional surface temperature readings. The global temperature profile shows a climate that is getting hotter and hotter and is now the hottest in human history.
But the regional surface temperature charts show the opposite. They show that it was just as warm in the Early Twentieth Century as it is today and there is no unprecedented warming, which means CO2 is a minor player in the Earth’s atmosphere.
Quite a contrast of views of reality, I would say. One, the global temperature profile shows we are in danger of overheating. The other, the regional surface temperature charts show we are *not* in danger of overheating.
I’ll go with the numerous regional surface temperature charts which show the same temperature profile for nations around the globe, and show the Earth is not in dangr from CO2, and will reject the global surface temperature profile as Science Fiction created by computer manipulation for poltical and personal gain.
Regions shouldn’t make decisions based on some kind of a “global” metric that is uncertain at best, decidedly wrong at worst. Each region should make decisions based on what they know about their own region. If there is a region that can show it is warming and can show, without question, why it is so then they can work with the other regions to address the issue.
Nick,
The “global average temperature” is a worthless value. If you want to show that the planet is accumulating extra energy in the atmosphere due to CO2, then what you want is the total energy content of the atmosphere. That is not possible to measure directly, and the relationship between total energy of a volume of gas and the average temperature is too complex in a system as large as the Earth’s atmosphere to use temperature as a proxy. And it doesn’t matter if the temperature is all we’ve got, it isn’t suitable for the purpose. Sometimes, if one is honest, one has to just admit that they don’t know.
And that statement is the winner!
Paul,
” If you want to show that the planet is accumulating extra energy in the atmosphere due to CO2, then what you want is the total energy content of the atmosphere.”
You should take that up with your local TV station. They report and forecast temperatures, and lots of people think that is what they want to know. They never report the energy content of the air, and no-one complains of the lack. Temperature is what affects us. It scorches crops, freezes pipes (and toes), enrages bushfires. It is the consequence of heat that matters to us. The reason is that it is the potential. It determines how much of the heat will be transferred to us or things we care about.
TV stations make weather reports for ordinary people, not meteorologists or atmospheric physicists. Internal energy content (enthalpy) doesn’t mean much to most people – temperatures are much easier to grasp. The calculations used to make the forecasts certainly use enthalpy and not just temperature, though.
Here’s a question for you: a blacksmith’s anvil is in thermal equilibrium at 300K. Its “average” temperature is therefore 300K. A white-hot drop of molten iron lands on it. What is its “average” temperature now?
They are forecasting LOCAL WEATHER, not global temperature averages!
“It is the consequence of heat that matters to us. ”
Temperature is *NOT* heat! They are two different things!
BTW, the temperature in a bushfire is not driven by the atmosphere or the earth itself, it is driven by the fuel being consumed in the fire.
“There is no instrument you can read to tell you that. Instead you have to, from the station data, estimate the temperature of various regions of the Earth, and then put them together in an unbiased way.”
That is the BIG issue : bias. Everyone is prone to bias. That is why you should always test your experimental processes against a set of controls. You can only address this if you try different methodologies as I have suggested to you here.
https://wattsupwiththat.com/2021/02/24/crowd-sourcing-a-crucible/#comment-3195430
Given the subjective nature of the appropriateness of so many of the statistical methods used, these all need to be tested against the control method of not using them. Where is that data or evidence?
“That is where the adjustment comes in.”
So far nobody on this comment site has really addressed the issue of adjustments, but they are the real problem. If you want an example just look at Texas. See
https://climatescienceinvestigations.blogspot.com/2021/02/52-texas-temperature-trends.html
If you average the temperature anomalies without breakpoint (or changepoint) adjustments, there is no warming. The trend is flat since 1840. But when Berkeley Earth add adjustments to the data, that changes the trend to a positive warming trend of +0.6 °C per century (see Fig. 52.4 on my blog page link above). And when you look at the individual stations the situation is even worse.
Of the 220 longest temperature records in Texas, which all have over 720 months of data, 70% have stable temperatures or a negative trend. For the 60 or so stations with over 1200 months of data this rises to 80%. After adjustment, most of these trends change to strong positive ones.
So how can anyone justify adjusting 70% of the data to give a result that is totally at odds with that produced by the mean of the raw data? I can accept making adjustments to a few outlier temperature readings in an individual station record, and I can accept the need to make adjustments to one or two rogue stations trends that are in complete disagreement with all their neighbours, but not 70%. That is the problem I have with the GAT and climate science.
How do they calibrate the satellite sensing, and how often. Obviously if you keep calibrating a tool to match your land temperature data then the satellite is going to agree with a “high degree of precision.
Also, if I remember right, the satellite’s are not measuring “near to the ground” but some distance above it. They then probably “adjust the data” to take that into account. Every adjustment is another chance to bias the data.
The satellites don’t actually measure temperature. They measure radiance at different wavelengths. Temperature is then inferred from those readings. All kinds of things add into the uncertainty of these readings. The readings are not all taken by the same satellite, they are a conglomeration of readings from several satellites. Thus the sensors in each satellite may be different with different aging drift. The time consistency between the satellites can differ. Anything that changes the transparency of the atmosphere to a certain wavelength can affect the radiance reading, e.g. clouds (thick or thin, perhaps even too thin to see) or dust, etc).
Therefore there is a *LOT* of adjustments, calculations, calculation methods that get used to turn this into a temperature. It’s your guess what the uncertainty of those temperature readings are, I’ve never seen it stated (but I’ve never actually gone looking for it either).
In the case of the UAH satellite measurements, they have been matched and confirmed with the weather balloon data, both of which measure from the ground to the upper atmosphere.
“We would like to take advantage of the brain trust in our audience…”
=========
I guess you can count me out.
My brain doesn’t trust me anymore 🙂
I cannot hear this phrase (or read it) without thinking of the movie “Oh, brother, where art thou?”
From now on, these here boys are gonna be my brain trust!
I don’t have additional information to help with above subject, however, I’ve often thought of creating a list of “accredited” colleges that practice rational climate science. As an alum of PSU, I keep telling them that I’ll only donate after hockey-stick Michael Mann leaves — so they’re off the list. Same goes for Texas A&M and climate alarmist Andrew Dressler — especially after he told Texans to “get used to it” regarding rapidly increasing global warming. I’m sure there are other Alums out there with knowledge about their schools.
How do Airs , R S S, UAH compare with each other, and with terrestrial measurements. What about Argo data
I show an interactive graph here where you can compare many global indices, including satellite (but not reanalysis):
https://moyhu.blogspot.com/p/latest-ice-and-temperature-data.html#Drag
They are on a common anomaly baseline.
And the world is cooling as CO2 levels continue to rise. While the estimates only over a short period of time, the world has not warmed appreciably during the 21st Century, contrary to UN IPCC computer models. People need to be reaching to check if their wallets are still there.
ROFMLAO
That propaganda moe-who ?
Moe was one of the 3 Stooges, you do know that don’t you. !!
Why doesn’t your little graph start in 1979 ?
A 3 year period is MEANINGLESS.
Read the instructions. It is an interactive graph, and starts in 1850.
The stated uncertainty in Argo temperature readings is +/- 0.5C. Take it for what its’ worth.
NoNo, its much better now that it was adjusted to agree with ships intake water measurements.
“How do Airs , R S S, UAH compare with each other, and with terrestrial measurements.”
VERIFYING THE ACCURACY OF MSU MEASUREMENTS
http://www.cgd.ucar.edu/cas/catalog/satellite/msu/comments.html
“A recent comparison (1) of temperature readings from two major climate monitoring systems – microwave sounding units on satellites and thermometers suspended below helium balloons – found a “remarkable” level of agreement between the two.
To verify the accuracy of temperature data collected by microwave sounding units, John Christy compared temperature readings recorded by “radiosonde” thermometers to temperatures reported by the satellites as they orbited over the balloon launch sites.
He found a 97 percent correlation over the 16-year period of the study. The overall composite temperature trends at those sites agreed to within 0.03 degrees Celsius (about 0.054° Fahrenheit) per decade. The same results were found when considering only stations in the polar or arctic regions.”
the problem with a red team blue team approach has always been: who picks the teams?
Like choosing jurors for a court case, let both sides have input on what team members are acceptable. Both sides should be able to dismiss a potential team member without stating cause.
Now lets have a red-blue team debate on when Trump last hit his wife.
The whole question is skewed by asking about “global average temperature”! That presupposes a way of handling the data and looking at the issue. it also conveniently ignores all the data we have showing how climate changed before whatever arbitrary date they set to start the “global temperature” based on picking the heigh of the little ice-age.
Instead the question should be: “what indicators are there & how reliable are they that there has been long temperature change”. Now the focus is on proving or indicating long term change, not creating a totally incredible “global temperature” and then claiming that shows change (when all it shows is change in the adjustments used to fabricate the bogus global temperature).
Small quibble
McKittrick mentioned southern Canada twice in same paragraph listing of areas with good thermometer coverage, probably because he is a hoser.
Other than that, this post is all about global average “mean” temperature and isn’t that all about hiding what is really happening?
If the meme is runaway heat then we should be discussing Tmax
And Tmin, and then use both to clarify where the supposed increasing average mean comes from
And why it’s not a problem
Regional Tmax charts all show CO2 is not a problem because today’s temperatures are no warmer than they were in the recent past.
That’s why climate alarmists don’t use Tmax charts. Tmax charts put the lie to the climate alarmists’ claims that the Earth is overheating to unprecedented temperatures.
I agree totally with Tom Halla. I have spent most of my working life in research and testing laboratories where decisions are made on the suitability of materials for construction. A major problem often arises when two laboratories are asked to test the same material and it is usually found that there will be differences in the test results. This is irrespective of the fact that each laboratory is following the same standard procedure and using same sourced calibration materials. Indeed in one of my early jobs, I was tasked to analyse the results of an annual coordination test where samples of a material were homogenised by extensive mixing and then sent to 12 or so laboratories for physical testing and chemical analysis. The results of this testing were forwarded to me and I tabulated and analysed the differences. While most test results for each test tended be around a consensus mean there was always a wide range of results around the mean and always a one or two outsiders well outside the 2 sigma limit. This result derived under well controlled conditions where one would expect reasonable agreement but it was not always found.
For climate temperature measurements the situation is most unclear. Not only are the measurements over time subject to inconsistencies of location of the sensors, changes in sensors response time and accuracy of results but the temperatures measured are not necessarily under the same conditions. For example, I believe that most of the temperature are the maximum and minimum measured at a location during one 24 hour period. However, I have seen one dataset from Australia that measured the temperature at 4 times during the day. So taking these matters together (leaving aside the arrogance of attempting to correct measurements that may have been made a century ago), I fail to see how it is possible to align historic measurements with those of today particularly to an accuracy of a fraction of a degree.
I also wonder if any of those “correcting” the temperature have actually been outside to see just how much the temperature can vary from place to place a very short distance apart. A walk on a cool morning will soon show that temperatures are very much dependent on locale with small hollows in the ground often being cooler than surrounding higher ground. The assumption in temperature homogenisation that there will be a smooth change in temperature from one location to another so it is possible to fill in the gaps is quite ludicrous in my view if only because the terrain is not smooth. Temperature is not homogenous to that degree and when the gap between measurement points may be hundreds of kilometres surely even the time of day becomes important because there may be time differences as well as distance between the locations. It was recently reported that temperature had been interpolated in Northern Tasmania using temperature data from southern Australia a distance of about 350km over open ocean. How accurate would this be?
To me it is not possible to determine temperature trends by measuring temperatures to 1 degree and calculating averages to fractions of a degree even assuming that the temperature set is determined in a standard fashion. I am also suspicious there seem to be no publicly available procedures for recording of temperatures that can be reviewed. I would be surprised if all of the publishers of temperature use the same protocols for gathering their data or indeed if their protocols have remained the same over time.
That is most evidently not true when a cold front is moving across the continent.
Low lying areas where snow or water may accumulate can differ from the surrounding areas for weeks or months at a time. Then when the snow has melted or the water has dried, that area will start to track more closely to the surrounding areas.
The Sacramento Valley in California is renowned for its Tule Fogs. It can be socked in with dense fog just above 32 deg F, with an inversion at about 1,500′ elevation. One can drive through the valley in January with temperatures close to freezing, climb up into the Mother Lode foothills and look out onto a sea of grey fog that looks like the Pacific Ocean, while basking in sunlight and 70 degrees F! The temperature boundary is at the elevation of the inversion, and is quite sharp. Smooth interpolation between Sacramento and and most of the Mother Lode towns along Highway 49 would result in almost all temperatures being wrong except the two end points!
Before I retired, I always walked to work. On many still mornings in the Fall and Spring, it will be in the low 40’s F at our home situated on a 70 ft. high bluff. Two-thirds of the way along the trail that goes down the bluff, frost will appear on the grass and weeds. — a drop of around 10 degrees F within a drop of 45 feet in elevation.
The effect you describe is real, but .. did you measure the ground temperature at your home?
It could be from cold air settling on a still night.
On these occasions, my thermometer registers around 42 degrees F at 5-feet above the grass and in shade. I have not measured the temperature at ground level, but there is no frost on the ground — just dew. Next time I will measure the temp around 2-inches above the ground to see what the difference is.
I have watched as the snow fell in the park across the street, while 100 feet away on my front porch it was raining cats and dogs. There are far too many wrong, but convenient assumptions made in the name of the AGW fraud. All these little tricks and ‘sciency” sounding methods are intended to confuse the masses.
I have driven under torrential downpour only to cross an interaction and it’s dry as a bone.
Bingo!
Dear CR,
Some thoughts. This EC article is about measuring global temps. It discusses first the dearth of stations both today and historically. Then it discusses the unreliability of ocean air temps (proxy by SSTs). It does not mention the unreliability of land temps, which are discussed in another article:
https://everythingclimate.org/the-us-surface-temperature-record-is-unreliable/
Then it discusses some problems with interpolation.
I agree that tightening is needed. An opening paragraph that summarizes the rest of the Con section would help. The McKitrick quote does not do that. First state what you are going to say, then say it, then tell the reader what you said.
Emphasize the unreliability of the measurements, land and sea: not enough stations, poor station siting, error-filled measurements at the stations, manipulation of older data. If interpolation is to be discussed, state the problems clearly (a different McKitrick quote or citation would work there). Note also that the globe does not have a single temperature. The Pro section discusses various climes; counter that directly, i.e. rebut the Pro point by point.
N.B. — All the articles have a “like this” button at the bottom. Only registered WP users can click it. Almost nobody is doing so. That’s a poor signal. Probably best to drop that feature.
PS — Schmidt is quoted in the Pro section without giving his first name or association. Fair is fair. Give the man his due or else don’t mention him.
Then why does NASA imply a precision of +/- 0.0005 degrees in its tabulations of monthly anomalies when “long-term temperature rise” is only accurate to about to about 0.1 degree? The basic rules of handling calculations with different significant figures are routinely ignored, and error bars seem to be a novel concept to NASA.
This is surprising because it is obvious that air temperatures can be below freezing at the elevation of a weather station, yet snow and ice can be melting, if in the sun. Dark pavement can sometimes be hot enough to literally fry an egg, yet the air being breathed by the ‘cook’ is not nearly that hot! As is too often the case, “closely” is not defined or quantified.
Recording temperatures in very different ways almost guarantees that they will be different, even if they are similar. What one wants, in order to justify the claims of precision, is that the temperatures be nearly identical, that is, virtually indistinguishable.
What is happening in the other Köppen climate regions? To really understand what is happening on Earth, and be able to make defensible statements about any particular region, one should be able to characterize all the regions and recognize differences and similarities.
“Then why does NASA imply a precision of +/- 0.0005 degrees in its tabulations of monthly anomalies”
It doesn’t.
Do a formal uncertainty analysis of a single “anomaly” point, I dare you.
3 decimal points is an implied precision of +/- 0.0005 degrees
So yes.. It does.
No, it doesn’t. GISS does not post 3 decimal points.
Fred250 never mentioned GISS.
Nick has perfected the art of distraction.
“Fred250 never mentioned GISS.”
Fred250 mentioned NASA. They use GISS data.
It does something even more absurd. In locations with few reporting stations (like polar regions and N. Canada, Russia, etc) it averages the product of interpolated numbers and pretends it’s “data”. Needless to say they get to choose which empirical data they “average”.
Stokes
I have seen the tables of monthly anomalies with my own eyes on the NASA website, showing averages with three significant figures to the right of the decimal point.
See the table of NASA anomalies under the heading Warmest Decades at
https://en.wikipedia.org/wiki/Instrumental_temperature_record
Stokes
Incidentally, the table I linked to does not have any explicit uncertainties or standard deviations associated with the anomalies. Therefore, the implied precision is as I stated.
That reinforces my claim that error bars are a novelty to NASA.
You might want to read my analysis at
https://wattsupwiththat.com/2017/04/23/the-meaning-and-utility-of-averages-as-it-applies-to-climate/
Here is the regular table of anomalies produced by GISS
https://data.giss.nasa.gov/gistemp/tabledata_v4/GLB.Ts+dSST.txt
It is given in units of 0.01C, to whole numbers.
The table you link from Wiki is somebody else doing calculations from GISS data.
Right there is the problem. How do you get anomalies calculated to the hundredths digit when the temperatures from which the anomalies are calculated are only good to the tenths digit?
You have artificially expanded the accuracy of the anomalies by using a baseline that has had its accuracy artificially expanded past the tenth’s digit through unrounded or unterminated average calculations.
This kind of so-called “science” totally ignores the tenets of physical science. It’s what is done by mathematicians and computer programmers that have no concept of uncertainty, acceptable magnitudes of stated values, and propagation of significant digits through calculations. To them a repeating decimal is infinitely accurate!
“How do you get anomalies calculated to the hundredths digit when the temperatures from which the anomalies are calculated are only good to the tenths digit?”
You don’t. No-one claims the individual anomalies are more accurate than the readings. What can be stated with greater precision is the global average. A quite different thing.
Averages should have their last significant digit of the same magnitude as the components of the average.
YOU CANNOT EXTEND ACCURACY THROUGH ARTIFICIAL MEANS – e.g. calculating averages!
If the anomalies are calculated to the tenths digit then the averages, including the global average, should only be stated out to the tenths digit.
You just violated every tenet of the use of data in physical science!
Stokes
It does appear that the Wiki’ article presents a derivative of NASA data without making that clear. The links to the original data are not working.
In an article I previously wrote here, I stated that the NASA table of anomalies reported three significant figures to the right of the decimal point. I would not have made that claim if it wasn’t the case. It appears to me that the table [ https://data.giss.nasa.gov/gistemp/tabledata_v3/GLB.Ts+dSST.txt ] has been changed. There is no embedded metadata to reflect when it was created or last updated. You are correct that the current v3 and v4 are only showing 2 significant figures.
Stokes
The article I wrote with the link to NASA anomaly temperatures was written in 2017.
Doing some searching, I discovered that NASA has written some R-code to do an updated uncertainty analysis. That apparently took place in 2019.
https://data.giss.nasa.gov/gistemp/uncertainty/
The GISS table has been the same format since forever. Here is a Wayback version from 2005
https://web.archive.org/web/20051227031241/https://data.giss.nasa.gov/gistemp/tabledata/GLB.Ts+dSST.txt
Stokes
Since I can’t produce evidence supporting my claim, and you have shown evidence that I was apparently wrong, I’ll have to concede and acknowledge that NASA only reports anomalies to 2 significant figures to the right of the decimal point.
Stokes
However, with respect to my opinion that NASA is cavalier with the use of significant figures, the link that you provided shows that ALL the anomaly temperatures are displayed with two significant figures, including the older data, which reaches an uncertainty 3X that of modern data.
The link on uncertainty analysis I provided declares that the 2 sigma uncertainty for the last 50 years is +/- 0.05 deg C, implying that anomalies should be reported as 0.x +/- 0.05 (which is implicit and not necessary to explicitly state), not 0.xx!
Older data should be reported as 0.x +/- 0.2 deg C.
two significant figures is *still* one too many. When temperature uncertainties are only significant to the tenth digit then the temperatures should only be stated to the tenth digit. That also means that anything using those temperatures should only be stated to the tenths digit.
If CO2 is driving climate, then all dry places should be warming more than all places with lots of water in the air.
Yes, that is the implication. However, I haven’t seen any research confirming that. I suppose part of the reason is that people are likely to become more emotional about threats to polar bears than to the Saharan silver ant, so the Arctic is emphasized.
“Building a crucible”. If only the climastrologists were so interested in honesty! In the end, it is all moot, unless everybody starts using the same instrument with the same methodology at the same standard. While this here quest is indeed a noble one, we are trying to argue with people who “adjust” data, it is like arguing politics with a Bolshevik; every time you start winning, they will just change the rules.
In other words, the best we can do, is critisize their methodologies, which is not really constructive, whereas their methodologies are positively destructive.
All current measurements are a waste of time, money and effort. All way too noisy to be useful.
The best indicators of global temperature are the latitude of the sea ice/water interface and the persistence (extent and time) of the tropical warm pools that control to 30C. Right now Atlantic is energy deficient with no warm pool regulating at 30C.
The tell-tale for global warming is sea ice/water interface moving to higher latitudes and greater persistence or extent of the tropics warm pools.
The ice is observable by satellite. The warm pools are measurable with moored buoys. There are reliable measurements of the Earth’s temperature because both these extremes are thermostatically controlled. You have more or less sea ice with interface at -2C and more or less warm pools controlled to 30C.
Most humans live on land that to the best of our knowledge averages 14C but the range is from 6C to 20C in any year. Trying to discern a trend amongst this mess is hopeless.
The use of anomalies is just a way of hiding reality.
In my humble opinion, the work that Rick Will is developing is well worth the consideration of all WUWT denizens. Geoff S
“Most humans live on land that to the best of our knowledge averages 14C but the range is from 6C to 20C in any year.” That favors China over Indonesia.
I would start with the question: Is there any single measurement that can be made that actually measures “climate”? Temperature; local, regional global, maximum, minimum, average, daily, monthly, annual, all seem to be far from adequate to characterize climate. What about rain, snow, wind (speed, direction), storms, humidity, heating degree days, cooling degree days, UV index, cloudiness, etc. I can go to various sources and look up weather data for all of these parameters for a specific location. Traditional climate zones are defined primarily by what species of plants will survive in a specific region. Can climate change prognosticators tell me if and when I’ll be able to grow oranges in Wisconsin? If climate change means more useful plants will be able to grow over more area can that be a bad thing? If the average global temperature goes up 2 or 3 or 5 C but mainly because it doesn’t get as cold in the winter and stays warmer over night, so what? It won’t make anyone less comfortable.
Frankly, I find “global average annual temperature anomaly” to be completely useless metric. In the practice of metrology we always start with a clear definition of exactly what we are going to measure (the “measurand”). Once defined, we then select appropriate instruments and create a detailed procedure to carry out the measurement. That would typically include a sampling plan and appropriate measurement frequency if we’re dealing with a large system and looking to determine change over time. But climate science seems to have a fixation on trying to construct a single number global temperature metric is based on an undefined nebulous concept using poor quality data and ad hoc procedures. No one who has at least a basic understanding of scientific measurement procedures would accept the claim that a difference in global temperatures made 50 to 100 years ago and measurements made in the last 30 years are meaningful measures of a real change. It can not even be claimed that the older measurements are of the same measurand as more recent measurements because there is no clear definition of what was being measured in either period. It’s all just Cargo Cult science.
To be taken seriously, the climate change alarmists should be able to clearly answer two question:
If they can’t answer the first, there’s no point is asking the second.
I don’t think they really want to measure the temperature of the surface of the earth as such a concept is absurd for a factor that changes continuously over multiple spatial and topographical influences. What we really want is a proxy for the earth’s temperature (much like a Stevenson screen temperature is a proxy for ground level air temperature) that is highly reproducible and so capable of detecting small changes. The main point is not that it accurately represent the Earth’s surface temperature, whatever that means, but is that it needs to be reproducible and to behave consistently from day to day and over a wide range of weather conditions. Numerous people have now demonstrated that using a subset of the best sites gives a different number than what comes from adjusted data from larger arrays of sites. Since there is an almost infinite variety of ways that sites can be compromised it is unlikely that any complex array of adjustments will be able to create consistency out of variation that derives from poor siting (one day it’s a jet engine blowing on the thermometer, the next day it’s the exhaust from a bus parked by the station). As in all complex sampling problems, the goal needs to be to select multiple subsets of reliable sites and use those to determine multiple temperature anomalies so that they can be compared to each other to determine trends that are consistent across all datasets. Similarly with historical data, it is not possible to adjust for poorly documented influences that happened in the past so the best that can be done is to use the longest running samples with the most standard protocols. Trying to develop a good proxy for Earth surface temperature from the period of early thermometer records seems to be more of a political than scientific goal. Since theory suggests that temperatures could not have been influenced by man until the recent past, we need to let the early thermometer record rest in peace and rely on other types of proxies for that period.
The actual quantity of interest is the enthalpy of the atmosphere just above the surface of the earth. The climate scientists use temperature as a proxy for enthalpy but it is a *poor*, *poor* proxy. It totally ignores things like pressure (altitude) and specific humidity.
Three *is* a reason why the same temperature in D*eath Valley and Kansas City feel so differently. Altitudes are different and so are the humidities. It;s a matter of the heat content in each location, i.e. the enthalpy. Because of these differences the CLIMATE in each location is different even though they might have exactly the same temperature.
Since the altitude of each sensor is (or should be) known, and since most modern weather instruments can provide data on pressure and specific humidity there is absolutely no reason why enthalpy cannot be calculated. This is probably available since 1980 or so giving a full 40 years of capability of calculating enthalpy instead of using the poor, poor proxy of temperature.
Why don’t the so-called climate scientists move to using enthalpy? Because it takes a little more calculation? Or because they are afraid it won’t show what they want?
They need hockey stick graphs that can be used make dire extrapolations about the future.
I would submit, as I often do, that “global temperature” is a fantasy, a chimera, whatever you want to call it.
https://www.semanticscholar.org/paper/Does-a-Global-Temperature-Exist-Essex-McKitrick/ffb072fc01d2f2ae906e4bb31c3b3a5361ca3e18
The average telephone number is 555-555-5555.
The high end of telephone numbers is 999-999-9999.
The low end of telephone numbers is 000-000-0000.
All climate is local/regional, or micro for that matter. The average temperature of the Earth is meaningless as a measure of climate, just as the average telephone number is meaningless.
If you want to assign a global climate, then I’d suggest that the current global climate is Ice Age and Interglacial. The global climate can be expected to change to Ice Age, Glacial at some point yet to be nailed down to the nearest millennium.
Call me. You have my average number.
Summing up all 10^10 numbers from zero to 9999999999 gives:
9999999999x(9999999999+1)/2 = 49999999995000000000
The average of that sum of 10^10 numbers is:
49999999995000000000/10^10 = 4999999999.5
which is not a standard phone number. So if we round it up, we get:
500-000-0000 as the “average” phone number.
I think we have the opening line of a great comedy here!
Have you noticed, when you make a non-refutable statement like that, none of the AGW true believers go near it? They’ll debate until the cows come home some complex point about the so called “science” of climate change, but won’t go near a statement that falsifies their entire philosophy.
“The average human has one Fallopian tube.”
I understand that your primary need here is to sharpen the dialectic of the opposing parties. Unfortunately, I can’t be of much help with that, because the content very quickly goes right over my head.
On the other hand, I have years of experience correcting, editing, and occasionally re-writing compositions from both elementary and high school students. To attract a larger audience, we must make the dialogue readable. I might be able to help with that, I’ll check your mark-up reference.
I will resist the temptation to make general comments here–with one exception. The first thing to do to enhance readability (and intelligibility) is to break up overly long sentences. Think Hemingway. I offer an example, rewriting this sentence:
“With respect to the oceans, seas and lakes of the world, covering 71% of the surface area of the globe, there are only inconsistent and poor-quality air temperature and sea surface temperature (SST) data collected as ships plied mostly established sea lanes across all the oceans, seas and lakes of the world.”
Change to:
“Oceans, seas and lakes cover 71% of the surface of the globe. Ships collect air and sea surface temperature data as they cross these bodies of water on established traffic lanes. But this data is of poor quality and gives inconsistent measurements….”
Absolutely !
Comprehension & Précis = Clarity
This is the question that started me on this strange journey of studying the alarm over climate change.
My question it still what is the formula to get average temperature of the globe from average temperatures of widely separated spots on it taken at different times. If it is a simple average of all the stations average daily temps averaged for a year the result is certainly not a true global average temp but an approximation of it. If the reporting stations are all maintained and measurements are consistent in quality and timing this approximation could be reasonably compared over time. My understanding is that this is not the process because the average temperature for 1936 (or any other year) keeps changing with new editions of the global temperature. If you can’t give the data to different analysis teams with your formula and have them come up with the same answer youre comparisons are not very meaningful. At least the UAH set compares the same thing from one year to the next. The surface data, in my opinion, is only good for station or at most local reagonal climate analysis.
A bit OT, but I have been puzzling over the comment threads here at WUWT. Since the moderators do not block commenters except for language or behavior, why is it that there are rarely any credible opposing viewpoints? All we get is a regular diet of griff and company, mainly serving as target drones. Is this an indicator of the reach of the message? Rather than stay in our safe echo chamber, what can be done to change that and mainstream our messages and influence?
How about a process to flood media editorial pages and comment sections with some of our better missives and collective comments? We cannot change the minds of those who have never heard.
How about an advertising campaign to bring the people, including the media, here to WUWT.
That might be worth a contribution.
Lead those horses to water!
A marketing and communications plan / department? To government officials? The public? We have the story to tell, but limited circulation. Maybe that is what Anthony has in mind with the revised “war footing.”
There are no credible opposing views.
Only the most stonily obtuse and hardheaded warmistas bother to comment here.
It is impossible to lie, smarm, dissemble, BS, fib, prevaricate, fast talk, or otherwise bafflegab thissa here crowd.
Well said, Nicholas! 🙂
To engage in debate implies that there is something worth debating. The big names in climate “science” have declared that the science is settled, therefor they refuse to debate with anyone who disagrees with them.
“why is it that there are rarely any credible opposing viewpoints?”
I don’t think there are many credible opposing viewpoints. In fact, I can’t think of any.
There are not too many opposing views here because when there is, commenters here request that the view be accompanied by evidence, and that throws the alarmists off because they don’t have any evidence to back up their claims.
That results in not many opposing views here. They get shot down too easily. All you have to do is say, “Where’s your evidence”, and that’s the last you hear from the alarmists.
Part of the problem 8s the CAGW crowd have a meme that CO2 8s the driver of temperature but have no proof.
They insist that regressions against temperature and CO2 ppm show a remarkable correlation and claim this is evidence.
They refuse to do any time series analysis such as detending to see if there are spurious conditions causing the correlation. Or if other periodic trends such as ENSO or AMO are causing are part of the trends.
A buddy of mine has been doing exactly this and is finding that many of the ocean cycles are very instrumental. Most lead CO2 increases which pretty much destroys the CO2 connection.
I am surprised that so many “Climate scientists” and supposed mathematicians aren’t pursuing this are of research to find underlying connections. I am probably making it sound very easy but it is not. However the connections could easily revolutionize the way models are assembled.
At the very least it will put the lie to plain old linear regressions being used to justify correlation as evidence.
There is a Warmist YouTuber called Potholer 54 who has at least tried to explain away the Inconvenient Fact that temperature changes precede CO2 changes in the ice-core record. Strangely enough, he hasn’t dared come on this forum to defend his ideas. Can’t think why.
“Top panel: locations with at least partial mean temperature records in GHCN v2 available in 2010.”
Why on Earth is this article talking about GHCN v2 available in 2010. WE now have V4, with about four times as many stations.
“GHCN uses SSTs to extrapolate air temperatures. Scientist literally must make millions of adjustments to this data to calibrate all of these records so that they can be combined and used to determine the GHCN data set.”
Total muddle here. GHCN does nothing with SSTs. It is a database of monthly land station temperatures.
“Figure Above: Number of complete or partial weather station records in GHCN v2.”
Again, just hopeless. That was a decade ago, and the station dropoff was a consequence of the limitations then placed on v2 to handle rapid monthly entry of temperatures; they had to restrict the number of stations they could handle. That has long gone.
“When such interpolation is done, the measured global temperature actually increases.”
No, it doesn’t. There is no global temperature without interpolation. There is only ever a finite number of stations; temperatures on the rest of the surface must be inferred. There is no reason why that should increase temperature, but the statement is meaningless. Relative to what? There is no estimate of global temperature without interpolation.
The distances are so huge it is actually an exercise in extrapolation.
So everywhere between 2 urban affected sites with the same temperature, gets given that temperature.
NOT REALITY, and you know it !
At last you finally managed to have an epiphany. You’re 100% right for a change. Now doesn’t that feel better to get that fact off your chest?
You’ve just discovered the flaw in most climate science. Temperatures are unique, therefore inferring them results in nothing useful.
This is why most climate scientists appear to be applied mathematicians or computer programmers and not physical scientists.
You state only what you can measure. You do *not* make up data to fill in what is unknown. If what you can measure changes then start with a new data set and come up with a new result.
Under your logic I could say that a metal bar I am heating from one end is the same temperature every where what I am measuring at the heated end. I just “interpolate” the temp at one end to the other end.
“This is why most climate scientists appear to be applied mathematicians or computer programmers and not physical scientists.”
They aren’t. Most of them have geography and marine biology degrees, or degrees from universities outside the global top 10. If there were more physicists from the top global universities then there might be more rigour to the subject. If they really were all mathematicians and computer scientists then some of their models might actually work.
“Why on Earth is this article talking about GHCN v2 available in 2010. WE now have V4, with about four times as many stations.”
So what?
If you want to measure global warming since 1850 you need to measure the temperature difference since 1850. Adding more stations to the dataset now does not help that much because, while it might improve the accuracy of the measured temperature today, it cannot improve the accuracy of the measured temperature in 1850. So the accuracy of the temperature change cannot improve significantly. The biggest hurdle to accurate determinations of global warming is the lack of data before 1960, particularly in the Southern Hemisphere.
As for interpolation, there are multiple alternatives that could be used instead which could at least be used to corroborate the interpolation-based results. One is to do local averages for the temperature in various countries or regions and use weighted averages of those means based on land area to get a global mean. I did this for Australia here.
https://climatescienceinvestigations.blogspot.com/2020/07/26-temperature-trend-in-australia-since.html
This method reproduced the Berkeley Earth data pretty well (compare Fig. 26.2 and Fig. 26.3) even though I only used datasets with over 480 months of data.
The issue I and I suspect many climate sceptics have with the various GAT datasets is the lack of apparent benchmarking using different calculation methods. The only group that has shown any real transparency in what they do that I am aware of is Berkeley Earth. Unfortunately, when I look at their methods I don’t like them.
“The only group that has shown any real transparency in what they do that I am aware of is Berkeley Earth.”
Well, I’m transparent. I publish a temperature calculation every month, eg
https://moyhu.blogspot.com/2021/02/january-global-surface-templs-same-as.html
I describe the methods in detail here
https://moyhu.blogspot.com/p/a-guide-to-global-temperature-program.html
with links to the complete code.
I get similar results to other groups, using unadjusted GHCN data. The only one out of line was Hadcrut, which failed to infill properly. But they have now fixed that.
But from what I can tell, you appear to be using similar methods to those of the other groups. Is that true? And how far back in time does your temperature calculation go?
The problem with global-scale meshed simulations is that they look too much like black-box solutions, irrespective of how much of the code you publish. So it is difficult for people like me to relate the data input to the data output, particularly on a local level.
What I like about Berkeley Earth is that you can select a station and see exactly what the original data is, and what the BE data analysis produces. The problem is, they are often not the same, as I showed for Texas.
https://climatescienceinvestigations.blogspot.com/2021/02/52-texas-temperature-trends.html
So what I am looking for are explanations and justifications for these differences.
TempLS goes back to 1900. All the methods are just spatial integration. I think mine are more sophisticated, but it doesn’t make much difference.
You can find the unadjusted land data here (click radio button “GHCN V4”)
https://moyhu.blogspot.com/p/blog-page_12.html
You can’t find any modification by TempLS; there isn’t any. It just integrates the raw data, after subtracting a local average to make the anomaly. Monthly plots are here
https://moyhu.blogspot.com/p/blog-page_24.html
You can click to find the anomaly for that month.
“The problem with global-scale meshed simulations is that they look too much like black-box solutions, irrespective of how much of the code you publish.”
Well, it’s hard to overcome that one.
Someone needs to show their work in support of this highly dubious claim.
The federal standard for weather stations is +/- 0.6C uncertainty. You can find this in the Federal Meteorological Handbook No. 1.
The Argon floats are considered to have an uncertainty of +/- 0.5C.
Since uncertainty grows as root sum square as you add independent, uncorrelated data together the uncertainty of the global temperature simply can’t be less than a tenth of a degree. In fact, the uncertainty interval gets so wide when you add even 100 stations together you simply don’t know the true value of the temperature within +/- 5C.
And this why the IPCC puts a lot of handwaving about uncertainty and error into the committee reports instead of hard numbers—it would plainly show they don’t know what the past and present is, and their extrapolations into the future are utterly without any statistical support.
Yet they want scores upon scores of trillions of dollars wasted trying to reduce a number they cannot measure.
Their adjustments exceed .6C.
Rather than measuring Earth’s air temperature which has a wide standard deviation, why not create a set of standards for measuring the Earth’s ground temperature at set intervals down to the depth where there is little seasonal variation.
Measuring and controlling for different kinds of soil, surrounding terrain and elevation, amount of urbanization, flux of geothermal sources, etc. would have to be considered. But once in place (and effectively protected), the readings would be subject to less man-caused disturbances like exhausts from passing automobiles and airplanes.
But this would cover roughly only 30% of the Earth. The other 70% is water which has moving currents in all 3 dimensions, further making it difficult to get the illusive average Earth temperature.
And if you are a purest and want the average temperature of Earth’s entire sphere — well, it does become rather hot.
Recent and projected CO2 induced warming is what is of concern for AGW. Recent warming is shown by satellites/radiosondes (40+ years) for the atmosphere and ARGO (about 16 years) for the oceans from about 2,000 meters in depth to the surface.
The satellite period covers much of man’s exponential CO2 additions to the atmosphere. During that time, the atmosphere has been warming at a rate of less than 0.12 C/decade. Since the GHE occurs in the atmosphere, there is no AGW concern above the surface. UN IPCC climate models assert there is a “hot spot” in the troposphere caused by water vapor enhancement of the small theoretical CO2 GHE effect of about 1.2 C/doubling of concentrations. Satellites and radiosondes have never detected a hot spot.
The best I could get at NOAA’s ARGO site is a cheesy miniature graph of temperature trends vs depth and my Mk 1 eyeballs have large error ranges. Keeping in mind the trends end on the 2015-16 Super El Nino, the Nino 3-4 region at the surface has a trend of about 0.16 C/decade and the overall trend at the surface is about 0.18 C/decade. The trend at 200 meters depth is about 0.05 C/decade. No AGW concern below the sea surface either.
In the atmosphere and the oceans CAGW fails and there is no need to fundamentally alter our society, economy and energy systems.
CAGW fails and there is no need to fundamentally change our society, economy and energy systems.
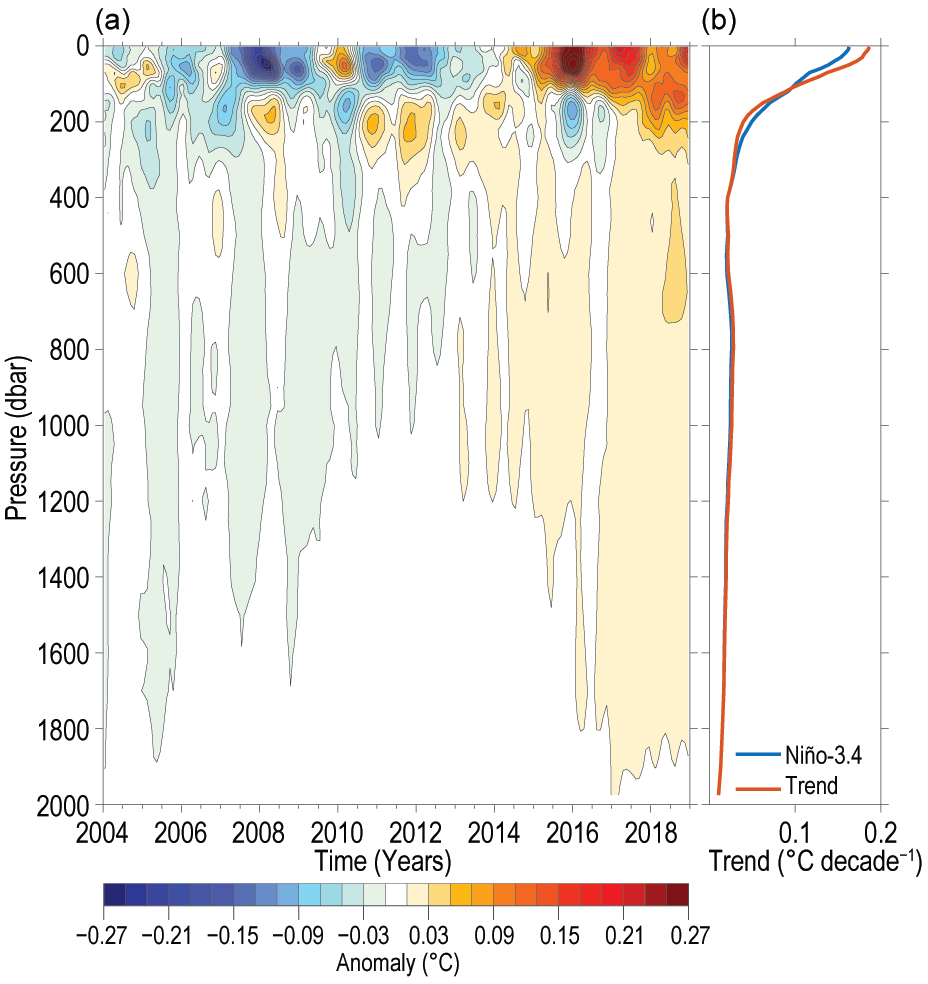
Less interesting than estimates the average temperature for the whole Earth is how that temperature changes.
Over the long term, especially if you begin your measurement record in chilly period, like the 1800s, or the 1960s & 1970s, there’s been a (generally beneficial) warming trend. But it is so slight that it’s hard to measure, with the result that the amount of warming reported by major temperature indexes differs by as much as a factor of two, as you can see in these graphs:
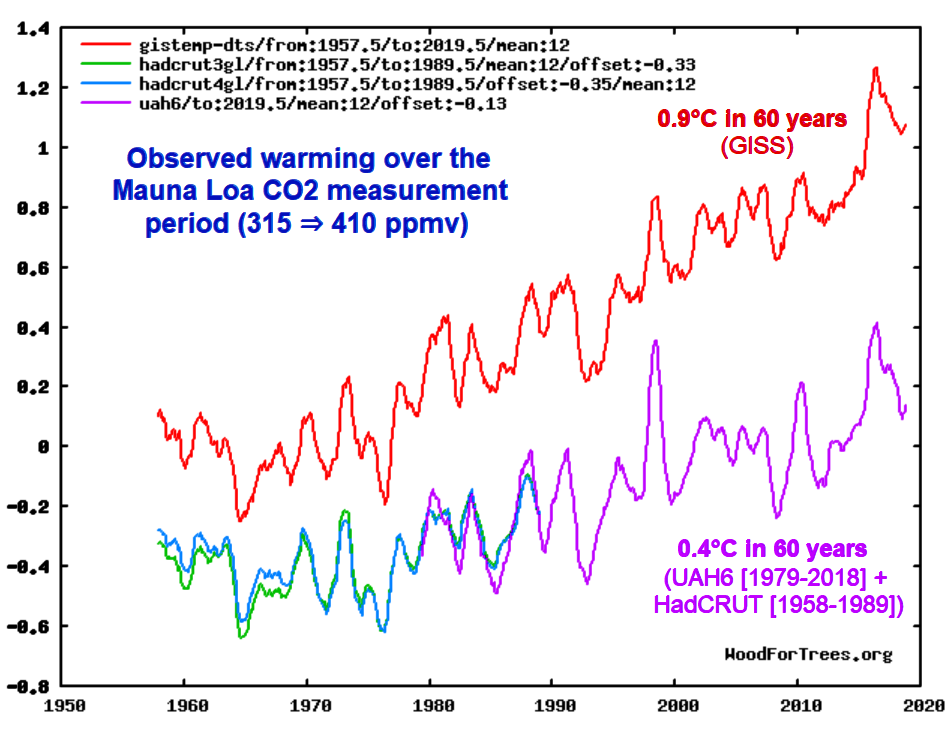
It troubles me that the institutions producing most of the temperature indexes are so severely politicized. They actively encourage misunderstanding of the context of recent temperature increases, because they encourage people to believe that myth the recent warming trend is unusually rapid, and the myth that recent temperatures are unusually high, even though many of them surely know better. They never mention the dramatically more rapid Dansgaard-Oeschger warming events recorded in ice cores (which nearly all existing species somehow survived), they rarely admit that past climate optimums, like the peak of the Eemian Interglacial, were certainly much warmer than our current warm period, and they never, ever acknowledge the compelling evidence that warming and eCO2 are beneficial.
It’s also worth noting that the surface temperature measurements are unsettlingly malleable, with large and mysterious revisions often being made to old measurements. (Worse yet are the pre-measurement proxy-based paleoclimate reconstructions.)

The predictability of the direction of those revisions invites suspicion that the temperature indexes produced by organizations like GISS, BEST, etc. are exaggerated: perhaps not through conscious fraud, but simply because the organizations are run by activists, and people tend to better at finding what they are looking for than what they aren’t. It is much, much too easy to discount or overlook that which is inconsistent with one’s prejudices, when surrounded exclusively by people who share those prejudices.

Analyses even using the probably-inflated temperature indexes from organizations like GISS and BEST indicate that the IPCC’s climate sensitivity estimates are much too high. Yet the activists who run the leading climate organizations seem to be are uniformly uninterested in such evidence. How can anyone trust the work of people who don’t seem to care at all about evidence suggesting their assumptions are off the mark?
Exhibit A, this conversation with the folks at BEST: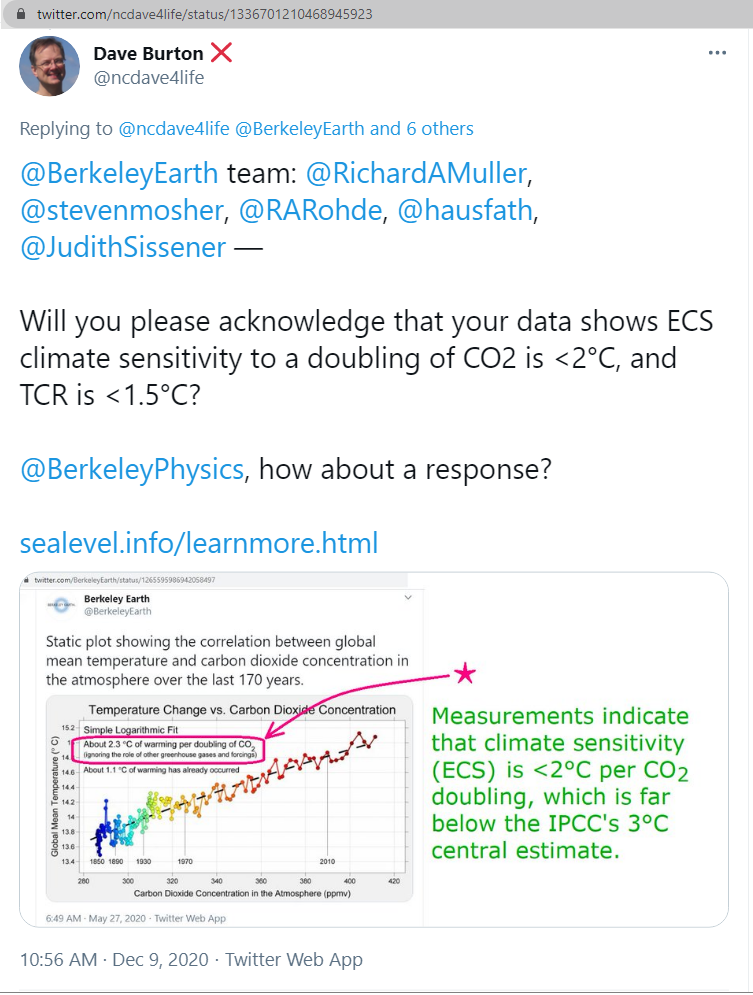
https://twitter.com/ncdave4life/status/1336701210468945923
https://twitter.com/ncdave4life/status/1336707443750035459
https://twitter.com/ncdave4life/status/1364577840021258241
You won’t get far until you try to use the terms correctly. There is an important E in ECS. It is equilibrium climate sensitivity. The rise in temperature due to added CO2 when it has all settled down, which takes centuries. You can’t calculate it from a running graph correlation.
The IPCC 3C is for ECS. E.
“when it has all settled down, which takes centuries”
And that time frame is understood precisely, because it’s settled science, right?
Nor from meaningless extrapolations into the future of computer models.
“The rise in temperature due to added CO2 when it has all settled down, which takes centuries.”
Ole Bill Gates made a similar bogus (without evidence) claim about CO2 the other day. He said CO2 we put in the Earth’s atmosphere stays there for a thousand years.
Nick, do you have any evidence that CO2 stays in the atmosphere for centuries?
Well, I guess Nick doesn’t have any evidence for claiming CO2, once put in the atsmosphere, stays there for centuries.
See what I mean about asking alarmists for evidence? Next thing you know, they disappear and you never hear from them again.
They disappear because they can’t back up their claims with evidence. They think all they have to do is throw something out there and everyone is going to get on board. Nope, skeptics need evidence. Just saying something is so, doesn’t make it so.
Explain why the historical temperature record has been altered to cool the past and warm the present.
You really should read the conversation before you critique it, Nick. You obviously didn’t bother.
The gist is that comparing temperature and CO2 trends gives a practical estimate of climate sensitivity, which is roughly midway between TCR (which assumes a much quicker CO2 rise than reality) and ECS (which assumes an equally unrealistic hundreds of years of unchanging CO2 level). So, if we also have an estimate of the ratio of ECS/TCR (which we do), we can calculate estimates for both ECS and TCR from that “practical estimate of climate sensitivity.” That’s what I did.
Here’s the tweetstorm, minimally reformatted for WUWT. I numbered the tweets 1-11, and here I’ve turned each tweet number into a link to the original tweet.
[1/11] BEST’s figures imply MUCH LOWER climate sensitivity than IPCC claims.
You show, “About 2.3°C of warming per doubling of CO2 (ignoring the role of other greenhouse gases and forcings).”
But to deduce climate sensitivity (to CO2), you CANNOT ignore other GHGs.
[cont’d]
[2/11] Even if we assume that none of the warming is natural, if 30% of the warming is due to increases in minor GHGs like O3, CH4, N2O & CFCs, then “climate sensitivity” from a doubling of CO2, according to BEST’s figures, is only 0.7 × 2.3 = 1.6°C.
[cont’d]
[3/11] That’s a “practical estimate” of climate sensitivity, from surface station measurements. However, if the best satellite data were used, instead of BEST’s surface temperatures, sensitivity would be almost 30% lower: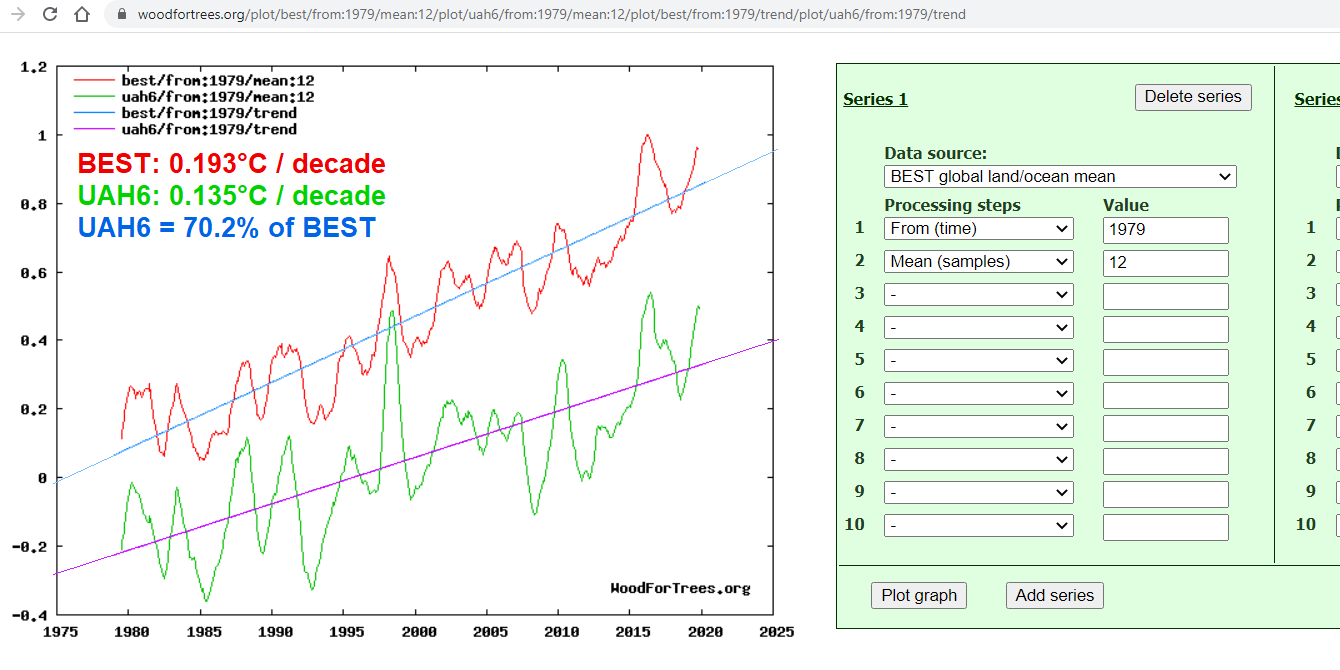
https://woodfortrees.org/plot/best/from:1979/mean:12/plot/uah6/from:1979/mean:12/plot/best/from:1979/trend/plot/uah6/from:1979/trend
https://sealevel.info/BEST_vs_UAH_2020-06-14h_digitization_notes.txt
[cont’d]
[4/11] That makes climate sensitivity to a doubling of CO2 only 1.23°C.
Since that’s based on real-world forcing (instead of the faster rise used for the TCR definition), the 1.6°C or 1.23°C per doubling is “between TCR & ECS” (probably about an average of TCR & ECS).
[cont’d]
[5/11] ECS is usually estimated at 1.25× to 1.6× TCR. So:
If 1.6°C is avg of TCR & ECS, it means TCR is 1.23 to 1.42°C, and ECS is 1.77 to 1.97°C.
If 1.23°C is avg of TCR & ECS, it means TCR is 0.95 to 1.09°C, and ECS is 1.37 to 1.51°C.
See: https://sealevel.info/BEST_vs_UAH_2020-06-14h_digitization_notes.txt
[cont’d]
[6/11] That gives an overall TCR range of 0.95 to 1.42°C, and an overall ECS range of 1.37 to 1.97°C.
Those sensitivities are obviously FAR BELOW the assumptions baked into most CMIP6 models and IPCC reports, which means their warming projections are much too large.
[cont’d]
[7/11] You say, “About 1.1°C of warming has already occurred,” and “if carbon dioxide concentrations keep rising at historical rates, global warming could more than triple this century.”
That’s wrong, for two reasons.
[cont’d]
[8/11] 1. It assumes WILDLY accelerated warming, from an approx linear continuation of forcing, for which there’s no basis. Even BEST’s 0.192°C/decade yields only 1.536°C of add’l warming by 2100. UAH6’s 0.134°C/decade yields only 1.072°C by 2100.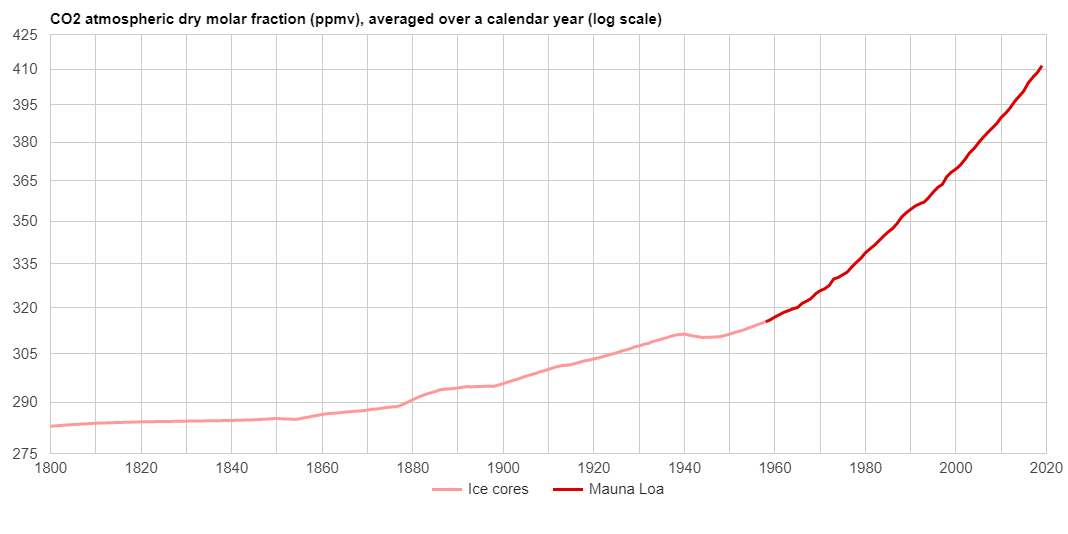
https://www.sealevel.info/co2.html?co2scale=2
[cont’d]
[9/11] 2. It assumes an implausible continuation of exponentially increasing CO2 level growth (necessary for continuation of the linear trend in forcing). But resource constraints ensure the forcing trend will fall below linear long before 2100.
https://www.researchgate.net/publication/303621100_The_implications_of_fossil_fuel_supply_constraints_on_climate_change_projetions-A_supply-side_analysis
[cont’d]
[10/11] Also, negative feedbacks (mainly terrestrial “greening,” and oceans) are removing CO2 from the air at an accelerating rate.
https://sealevel.info/feedbacks.html#greening
So (unfortunately!) it’s unlikely that mankind’s use of fossil fuels can ever drive CO2 level above 700 ppmv.
[cont’d]
[11/11] Since CO2 forcing trend log(level) is almost certain to fall below linear later this century, rate of temperature increase, which is already too slow to reach the temperatures you project, should slow BELOW even the current slow 0.134°C to 0.192°C/decade linear trend.
###
[12/11] @BerkeleyEarth, do you not have have any comment on the fact that your data implies a much lower climate sensitivity to rising CO2 levels than the IPCC claims?
[13/11] @BerkeleyEarth, are you there?
@RichardAMuller @stevenmosher @RARohde @hausfath @JudithSissener @BerkeleyPhysics
[14/11] @BerkeleyEarth, will you please reply?
The temperature measurements imply TCR between 0.95 & 1.42°C, and ECS between 1.37 & 1.97°C. Will you at least acknowledge that your measurements imply climate sensitivity well below IPCC estimates?
[15/11] @BerkeleyEarth team: @RichardAMuller, @stevenmosher, @RARohde, @hausfath, @JudithSissener —
Will you please acknowledge that your data shows ECS climate sensitivity to a doubling of CO2 is <2°C, and TCR is <1.5°C?
@BerkeleyPhysics, how about a response?
https://sealevel.info/learnmore.html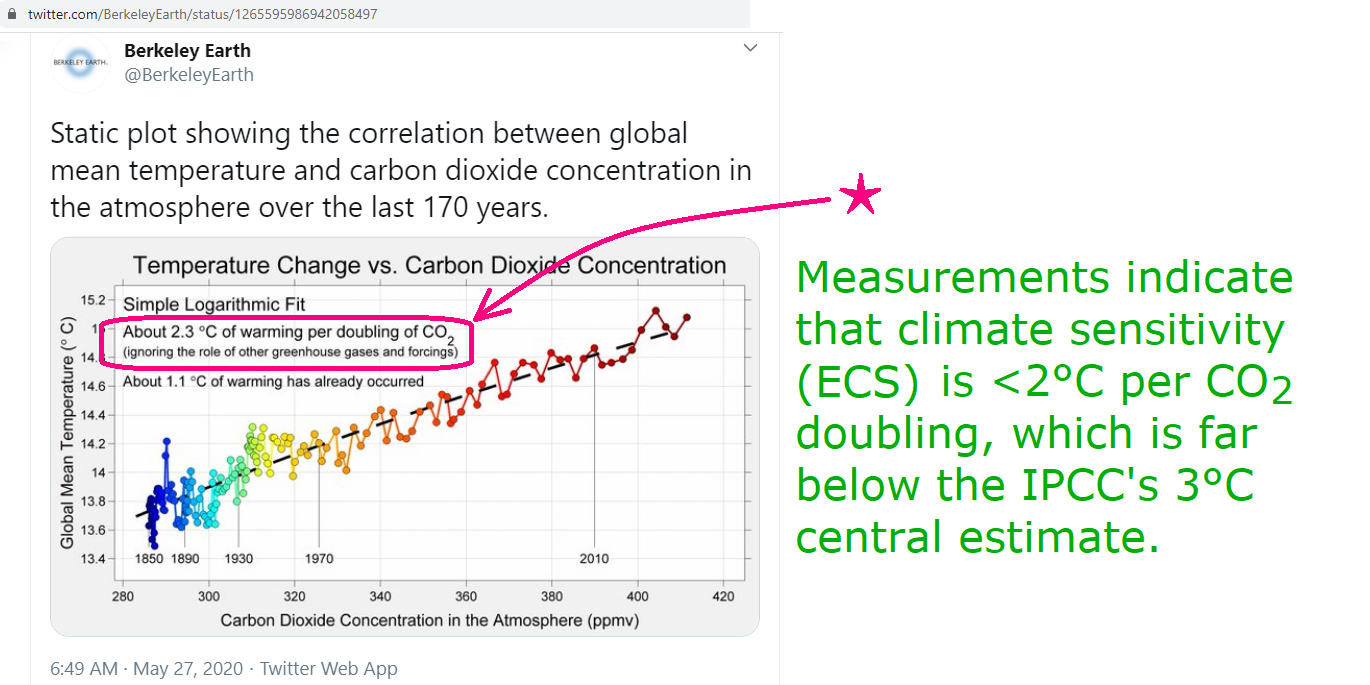
They never replied.
“There is an important E in ECS. It is equilibrium climate sensitivity.”
This is where I depart from your generally useful commentary (and I mean that sincerely). The climate is a non-equilibrium system, and we haven’t yet determined how far from equilibrium it is. To ascribe a figure of merit to a system to which it absolutely doesn’t apply is…well, not useful. It also isn’t informative, and should not be used as the basis for policy actions that would return humanity to prehistoric subsistence levels, killing off huge segments of the human race.
I like that comparison of the changes the Data Manipulators have made to the US surface temperature record.
This demonstrates why I use Hansen 1999, rather than a later chart. It’s the closest thing to an unmodified US chart that I can get.
Hansen 1999 shows the 1930’s, as being warmer than 1998. Specifically, Hansen says 1934, was 0.5C warmer than 1998.
Then, the 2011 US chart was bastardized to make it appear that 1998, was warmer than 1934. This way the Data Manipulators could claim that 1998 was the hottest year ever.
And the 2020 US chart has been further modified to downgrade 1998, in order to allow the Data Manipulators to claim that years subsequent to 1998, were the “hottest year evah!”
If you look at the UAH satellite chart (below) you can see that 1998 and 2016 (the last “hottest year evah!”) are statistically tied for the warmest year since the 1930’s, which makes the Data Manipulators claims of “hottest year evah! all a bunch of lies, because none of those years were warmer than 1998, if you go by the UAH satellite record, the only record that can currently be relied upon to be honest.
How many years after 1998, did the Data Manipulators designate as being the “hottest year evah!”? Half a dozen? Something like that. And every claim is a lie according to the UAH satellite chart because none of those years were warmer than 1998.
And, as you can see, at least in the United States, the temperatures have been in a decline since the 1930’s. CO2 concentrations don’t seem to have any effect on the temperatures in the U.S.
And, all unmodified, regional surface temperature charts have the very same profile that the US chart has, i.e., they all show it was just as warm in the Early Twentieth Century as it is today, which demonstrates that CO2 is *not* the control knob of the atmosphere and is nothing to worry about or does it need to be regulated.
None of the unmodified, regional surface temperature charts resemble the “hotter and hotter” temperature profile of the bogus, bastardized, instrument era, Hockey Stick chart. The Hockey Stick chart is an outliar.
UAH satellite chart:
And here is a comparison of the Hansen 1999 US surface temperature chart (on the left) with a bogus, bastardized, instrument-era Hockey Stick chart (on the right).
http://www.giss.nasa.gov/research/briefs/hansen_07/
What the data manipulators did was change the temperature profile of the chart on the left into the temperature profile of the chart on the right. Normally, temperatures get warmer for a few decades, and then they get cooler for a few decades, as can be seen in the Hansen 1999 chart.
But the bogus, bastardized instrument-era Hockey Stick chart artificially cooled the warm 1930’s with their computers and turned the temperature profile into a hotter and hotter and hotter profile where we are now at the hottest temperatures in human history. Perfect for selling the Human -caused Climate Change scam. But it’s all a Big Lie which is proven by looking at the regional temperature charts from around the world that all agree it is not any warmer now than in the recent past.