From Pierre L. Gosselin’s NoTricksZone
By Kenneth Richard on 11. January 2021
A new analysis of global sea level rise rates concludes the rising trend was 1.56 mm/yr−¹ from 1900-2018. This is the same rate as for 1958-2014 (1.5 mm/yr−¹), indicating there has not been a long-term distinctive change in sea level rise rates in the last 120 years.
In 2018, Frederikse et al. assessed the contributing factors to long-term sea level rise from 1958 to 2014. They determined ice melt and thermal expansion combined to add 1.3 mm/yr−¹ to sea levels during this period, and the overall rate of sea level rise was 1.5 mm/yr−¹.
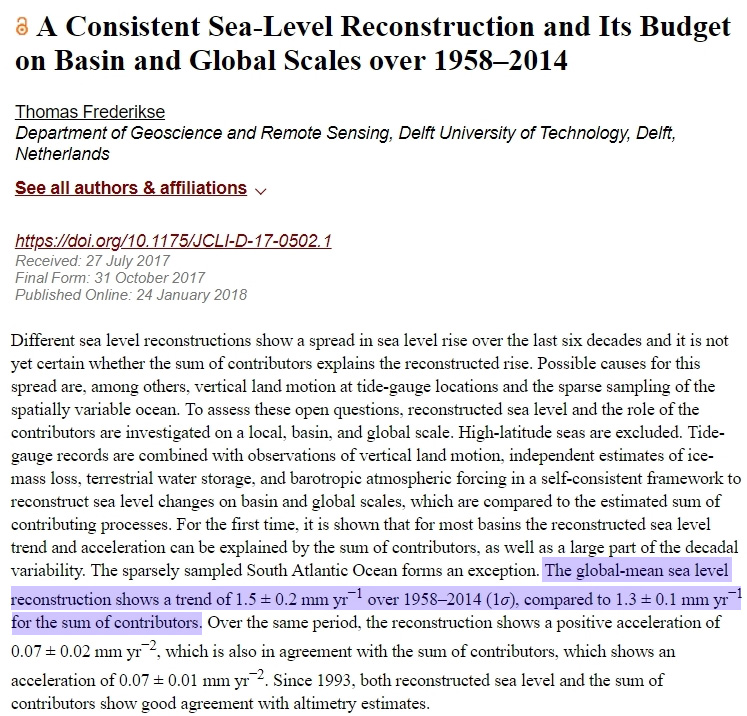
Image Source: Frederikse et al., 2018
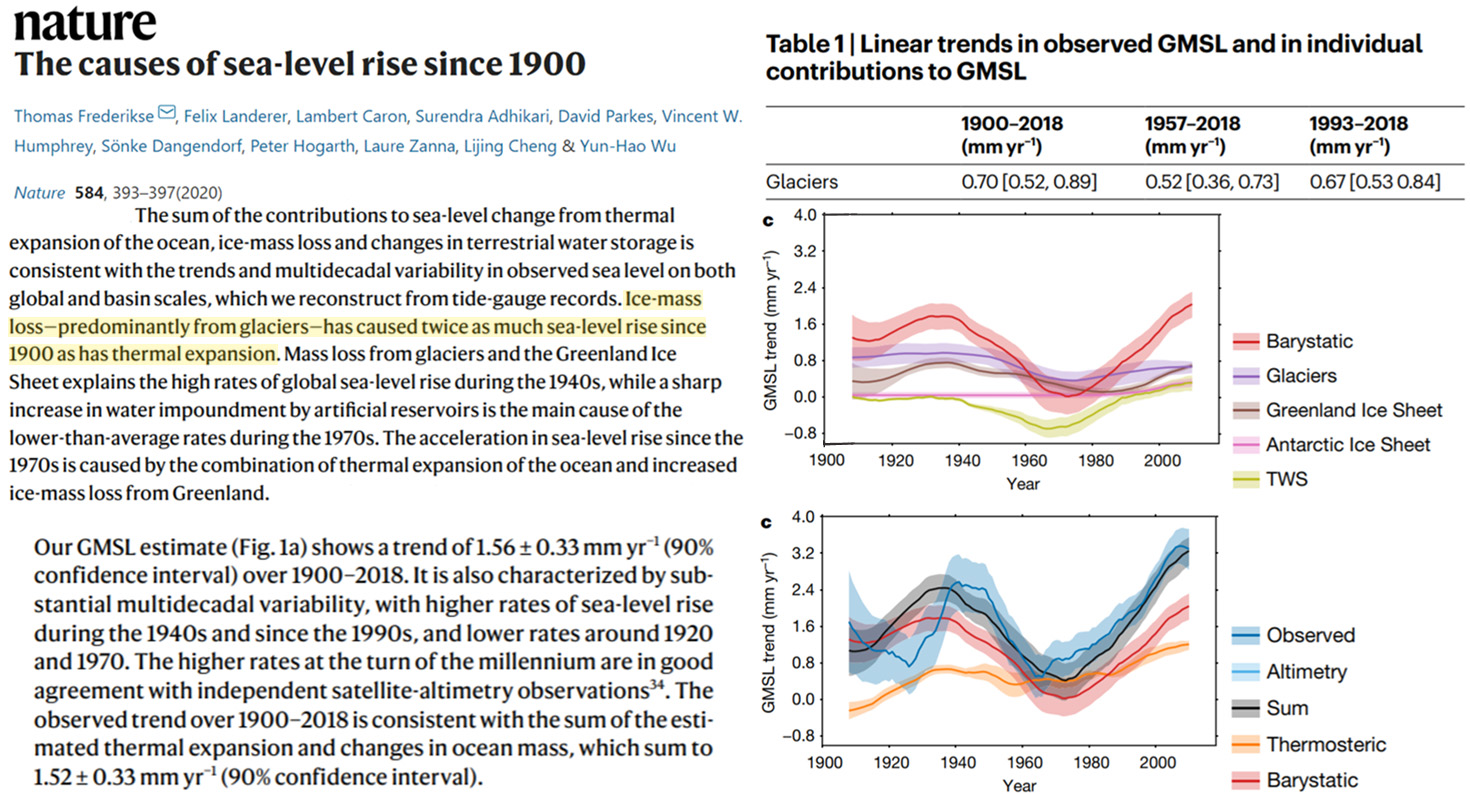
Then, in a study published last August, Frederikse et al. (2020) assessed global sea level rise rates and its sum of contributors since 1900. Interestingly, they found the rates of sea level rise were effectively the same for the entire 1900 to 2018 period (1.56 mm/yr−¹) as they were from 1958-2014 (1.5 mm/yr−¹).
The overall long-term trend in sea level rise has undergone an oscillation: high rates in the 1930s and 1940s, a slowdown during the 1960s and 1970s, and then a return to high rates in recent decades.
It’s interesting to note that the ice melt contribution to sea level rise – including the ice melt contribution from the Greenland ice sheet – was higher in the 1930s and 1940s than it has been during the last few decades. In fact, the contribution from total ice mass loss from glaciers was higher for the entire 1900-2018 period (0.70 mm/yr−¹) than it has been since 1957 (0.52 mm/yr−¹), suggesting a relative slowdown.
Neither of these trends – the multi-decadal oscillation in rates or higher ice mass contribution prior to 1950 – would appear to correlate well with the linearly accelerated rise in CO2 emissions since the 1940s.
huh
for crying out loud…..a slowdown during the 1960s and 1970s,….just start the graph there….problem fixed
Hands up anyone who is in the least bit surprised by these “findings”. Isn’t this exactly what many of us have been saying from the start? “Nothing to see here folks.” When are people going to catch on to the fact that every scare, talking point, statistic, prediction, projection or contrived climate angst over the past 50 years has been invented for political effect? Our planet is safe, happy and better than ever.
100%! ”Melting ice” is having little effect on the rate. “Increasing ocean heat” is having little effect on the rate.
Indeed, the “barystatic” line ( same weight of water ) must reflect the effects of thermal expansion. We see current level is indistinguishable from 1930s. That gives the lie to all the rigged and adjusted SST records.
Yep, old farts like me can still stand on the same shoreline fishing spots that I used as a kid 65 years ago.
And I’m betting that my grandkids will still be fishing from the same spots I did when I was their age.
Like you (an old fart), I have been visiting the same shorelines for over 75 years, now not so often, but at least once a week. I can see it from where I’m sitting. As a canoeist I’m able to locate waterfront cottages, log boom anchors and the same pilings I caught rock cod from over 70 years ago.
I’m guessing one would notice a well remembered 100 year old waterfront home being inundated by rising sea levels. I’ve lived near waterfront or on waterfront for all of my life … from the entire coast of British Columbia to Southern England and North Africa. I’m sure I would have noticed any significant SLR.
Go to Emsworth in Hamshire, England. A Beautiful little village, right on the edge of an tidal estuary. Been there for HUNDREDS of years. No noticeable SLR there.
I lived in Rye, (replacing New Romney as a Cinq Port in 1287 after a storm) and went to school in Hastings (both famous port towns with a long history involving SLR) … just up the coast from Emsworth. England’s South coast has been very familiar with tides that came in and failed to ebb. But most of that happened during the Middle Ages when (we’re told) there wasn’t a warm period (sic) … apparently.
PS … loved Chichester (especially the cathedral), great sailing thereabouts, but can’t say I was in Emsworth.
I lived in Emsworth and agree. But the example I use is the Rialto bridge in Venice. Renaissance paintings show about 5 or 6 steps down to the water. Modern photos show the same.
Here is the source data for all the tide gauges in the world Concentrate on the hundred year plus data and tell me if you find a single one that shows anything other than a linear relationship over time with no acceleration
https://www.psmsl.org/data/obtaining/map.html#plotTab
I’m always wondering about comments regularly telling us that
Oh Noes!
Here are some thoughts and infos, not only based on downloading data processed by professional gauge / sat teams (Dangendorf & al. for the gauges; NOAA for the sat data), but compared with data downloaded and processed by me, a layman.
If you don’t like all that: do not stay arrogant on your high horses, do not preach about systemic and other errors, but come down AND DO THE JOB YOURSELF, BASTA YA! (It will cost you lots of work.)
All numbers refer to processing made in 2019/20.
*
A) Here is, to start, a comparison I made out of my own processing of P(S)MSL data, between
https://drive.google.com/file/d/1rUdTHfkfaargd93TFdOH2mGcUiipLLB-/view
As you can see, the difference between the full and the 100y+ plot isn’t terrible, what is confirmed by the estimates (in mm / year):
1910-2018
1993-2015 (2015 is the end of Dangendorf’s evaluation)
The first remark is that, if there was no acceleration, the trends for 1993-2015 would be exactly identical to those for 1910-2018. And they are continuously increasing since the 1960s, that is easy to compute in a spreadsheet calc.
Thus, there might be some tiny evidence that 1993-2015 is no ramdom period, nor an outlier.
Wait and see.
*
B) Now please consider a chart comparing gauge data evaluation by the Dangendorf team in 2016, with NOAA’s sat data:
https://drive.google.com/file/d/1v28o77hsC9rfUwEcdP2sBgulpM5aYYj-/view
*
C) Now please compare, for the common period 1993-2015, four plots:
https://drive.google.com/file/d/1dBaB87ire3DmYI3nBkW-Mw-Fbrt4AlWP/view
This time, the estimates are not linear, but based on quadratic fits whose equations are displayed on the graph.
If there was no acceleration, the x² coefficient would be equal to zero everywhere.
The x² coefficient is so small that it might appear irrelevant. But the ‘x’ stays for the number of months, and thus you have, in 80 years, for
The amounts of raising till 2100 might appear laughable, of course. But please think that this is a global average, and that lots a gauges have a clearly negative trend.
*
So in the sum: there is, for most people in the world, no reason to panic, especially not in CONUS!
But other people living elsewhere might feel much more concerned in the future.
That’s all… Stay tuned, or, as freak comics genius Robert Crumb wrote: “Keep going strong!”.
J.-P. D.
Dangendorf data
https://static-content.springer.com/esm/art%3A10.1038%2Fs41558-019-0531-8/MediaObjects/41558_2019_531_MOESM2_ESM.txt
Addendum 2: Dangendorf’s evaluation vs. mine
https://drive.google.com/file/d/1_33qttKhTvMpbdjhnJUCL_-kO6HYlmht/view
Thank you kindly for talking all that time and trouble trouble to provide such a thorough cross section of information. I can’t say my own observations are more than anecdotal, but they do cover a very long period where I live and are geographically diverse as well. Accelerating SLR is something I would definitely have noticed. I visit many of the locations many times a year and have done for most of my life. I live very near the ocean.
Anyway … thanks again.
Rory Forbes
Thank in turn for your convenient reply.
Here is for example a small list of gauges, all over 100 years at work, whose raw trend per decade varies between -10mm and +10mm:
https://drive.google.com/file/d/10D0vzlwlDjOeuc8U7DK1OhiKGXlP_MHp/view
Would you really see at these places, within 50 years, the sea level changing between -5 and +5 cm? I wouldn’t.
How could you ever see there any acceleration of sea level change?
Rgds
J.-P. D.
Someone had better get busy and update Wikipedia
Good luck with that!
Two alarm bells are ringing quite loudly re: the above-referenced conclusions by Frederikse et al. :
1) “reconstructions using tide-gauge data” to derive largely-global SLR
2) no mention whatsoever of satellite data yielding a SLR metric independent of tide-gauges.
NOAA currently documents that global SLR has been in a LINEAR trend of 3.0 +/- 0.4 mm/year since 1993, based on satellite altimetry data from the TOPEX, Jason-1, Jason-2 and Jason-3 satellites. (Ref: https://www.star.nesdis.noaa.gov/socd/lsa/SeaLevelRise/LSA_SLR_timeseries.php )
There is a big (~2:1) difference between the satellite altimetry-based SLR figure and what Frederikse et al. conclude . . . I wonder why this was not mentioned?
IMHO, there are manifold error paths possible for “reconstructions” . . . just look at all the variables listed in the above article for “adjusting”/”complementing the tide-gauge data.
People live where the tide gages are. People don’t live on satellites, and 8f they did they have no worry about SLR.
Exactly. They try to claim that rising sea levels is a threat we must destroy our lives to counter, yet they add fictitious GAIA adjustment whereby the satellite record is some mythical “sea level” which floats phantom like above the waves.
This falsehood grows every year.
I have always assumed that the satellite derived sea level rise figure is the result of incorrect calibration with tide gauges. After all, if the satellite figures were correct, this would mean that every tide gauge in the world is wrong in the same direction.
Bill, are you aware that there are great discrepancies is SLR as measured directly by tide gauges around the world, in some cases by factors of 5:1 or higher, and even including positive and negative values . . . even now, they don’t all go “in the same direction”?
But you do have a point about incorrect calibration of tide gauges.
I am well aware that tide gauges don’t all “go in the same direction” but this is principally caused by the land rising or falling in various places round the world. When I mentioned incorrect calibration, I was referring to the satellite figures being incorrectly calibrated, not the tide gauges.
B.T., ahhh . . . then by implication you believe the tide gauges around the world used in the above articles by Frederikse et al. ARE correctly calibrated.
Who knew?
It is a pretty simple choice. Either the satellite figures have been incorrectly calibrated or all tide gauges are wrong in the same way. Which do you think is more likely?
I did some investigation into the Jason satellites some time ago. I know I was very surprised about the size of the orbital drift, primarily caused by gravitational anomalies if I remember correctly. If I remember correctly there was a drift of 10 – 12 feet for an orbit. What surprised me was that this was “corrected” by using longer averages of the heights. It struck me about how averaging heights over a month could adequately deal with variations of millimeters when the orbital drift was so large.
I’ll have to look at this again.
If people lived on satellites, they would likewise not have to “worry about” typhoons, hurricanes, weather fronts, and water and food and mineral resources that are imaged by them.
I wonder how 1993 to present relates to the two covered periods – 1958 to present and 1900 to present? Especially since the authors state that there was a lower trend in the 50s to 70s.
That would be that sinusoidal thing, where sometimes it’s higher, sometimes it’s lower, but over the 70-100 year periods – it’s not changed.
SD, it’s easy to answer your question. 1958 to present is 63 years (inclusive) and 1900 to present is 121 years, inclusive. 1993 to present is 28 years,inclusive.
Therefore the satellite data that I referenced in my OP represents 44% and 23%, respectively, of the two covered periods that you asked about.
Not that the data time span matters because Frederikse et al. assert SLR has been CONSTANT when considered over the longest time period mentioned, and the same is true for the satellite data . . . a bid discrepancy exists between the two data classes.
No, what they said was that SLR has oscillations, but a consistent long-term trend. The sats may very well be measuring a recent oscillation.
Yep. The satellite record starts at the tail end of the slow cycle.
Exactly.
Would those be the satellite trends starting from 1900 or from 1958?
If you understood my post, you would see that I clearly stated the satellite altimetry data started in 1993. If you had consulted the referenced NOAA link I provided, you would have seen that the plotted data started in 1993.
Apparently, you aren’t the only one.
Next question.
Gordon, sea level rise doesn’t matter in the mid ocean. It only matters where the tide gauges are. Do you think the satellites might be finding sea level rise somewhere that isn’t where the tide gauges are?
Hoyt, I think you and others misunderstand the whole point of my OP, which is that Frederikse et al. claim to reconstruct sea level rise on “basin and global scales” (the exact words in their 2017 publication excerpted above, and repeated in the abstract of their 2020 article in nature, also provided in the above article).
I am just pointing out the 2:1 disagreement between this reconstructed data and the satellite-derived global data.
I think it is something that people concerned with science should attempt understand, if not resolve.
Speaking of “adjusting”
They do it every time they move to a new satellite
Onwards and always upwards….. 😀
Here’s the first one… Topex “adjustedᴸᴼᴸ” to meet Jason.
Many thanks. That was exactly why I stopped having any confidence in the good faith of satellite data processing.
Around 2010, I downloaded data twicec at about 12mo intervals and saw drastic changes in what was supposed to be the same sea level record.
I stopped analysing satellite sea level data.
How is:
“The higher rates at the turn of the millennium are in good agreement with independent satellite-altimetry observations.”
not mentioning satellite data. I’m not saying it is consistent but it definitely is there and there is also a reference listed for it that isn’t included in the brief summary here.
Then there is the history of satellite seal level data previously reported, at least some of it on WUWT, that says the satellites found ZERO level of sea level change in the first 20 years of data. Therefore new “adjustment factors” were used, creating something to report.
2) on the second graph there is a line “altimetry”. I would guess that’s your missing satellites.
Both the “observed” ( tide gauge ) and “altimetry” lines show very close to 3mm/yr at the end of the graph.
Indeed. You need to recognise that satellite records are also “reconstructions”. There is a total lack of transparency and blatant political bias in the teams like C.U. Bolder who are the gatekeepers of the satellite data. I don’t trust them an inch.
Data have been changed drastically in order to splice different satellite platforms together. Non “inverse barometer adjusted” datasets are no longer publicly available for comparison. I asked and was refused. They removed them and they are not hidden. The GAIA adjustment is applied to all data published because they have declared they want this record to be a metric of global warming. It is, by their own, deliberate choice, NOT a sea level record.
If anything the tide gauge reconstruction lends them a little more credibility that I would have allowed them.
The SLR record is complicated. Tide gauge reconstructions generally indicate an average SLR of 1-2 mm/yr since 1850. Although, this includes a quasi-periodic fluctuation between alternating ~30-yr episodes of fast (~3 mm/yr) and slow (0-2 mm/yr) SLR. The satellite record begins just before the most recent ~3 mm/yr episode.
From Jevrejeva et al., 2014…
David, thank you for providing these graphs. The uppermost “Jevrejeva et al., 2014” graph of global sea level rise gives a linear fit rise of 1.9 mm/year.
On first glance, this appears to be in disagreement with the Frederikse et al. (2014) claim that from 1958 to 2014 the overall rate of sea level rise was 1.5 mm/year. (Per second paragraph of the above article, although the units cited there are incorrect: given as mm/yr−¹; but should be mm/year.)
You have provided the most straightforward explanation for the tide gauge vs. satellite altimetry discrepancy that concerned me: when using a linear regression fit to derive “constant” rates of global SLR, the time interval in question is critical. This is clearly revealed by the bottom “Jevrejeva et al., 2014” graph you provided.
I’m not sure that one can assert there is an underlying “quasi-periodic fluctuation” of period ~60 years, given the plot only indicates the possible presence of a single such oscillation, but it is interesting to speculate on what might be the physical cause of such if there is indeed a periodic GSL forcing function present.
I wouldn’t expect various GMSL reconstructions to be in very close agreement. The uncertainty band is quite wide.
The notion of ~60-yr has also been suggested by the satellite altimetry people. Jevrejeva 2008 and 2014 both indicate alternating episodes of slower and faster SLR, with a fairly good correlation to SST fluctuations.
And for the longer view more befitting a geologist:
Even more context…
SLR since 1800 is the green dash on the left, older is toward the right.
Sorry, but I still cannot imagine what millimetres mean in everyday terms. Frederikse et al. conclude that sea levels are rising at the rate of just under six inches per century and the satellite data indicate that they are rising at the rate of 12 inches per century. Neither supports the climate catastrophe thesis.
The unanswered question is why there is a significant discrepancy between tide gauges and satellite altimetry when there is supporting evidence (Numerous personal observations right here in the comments!) for the tide gauges being correct except where there is known subsidence happening.
Well, not REALLY unanswered; to the satellite data, they add some GAIA “adjustment” and additional “we changed satellites and the new ones read higher, so it must be higher” adjustments to make it look worse they thought – which is of course worse than reality.
Are you implying that the tide gauges DO NOT have some global isostatic rebound corrections applied to them when used to derive global SLR rates?
Curious claim . . . and far from reality.
Isn’t part of the answer to your question the adjustment made for the oceans being deeper due to all the excess water therein pushing down on the sea floor, inhibiting the tide gauge’s increased reading.
Water’s density is less than the rock that it “pushes down on the sea floor”. Therefore, the bottom of the sea floor should move more easily upward compared to rock at equivalent depth that has an overlay of continuos rock all the way up to sea level (i.e, at the coasts, where tide gauges are located).
I doubt you can obtain a clean SLR datum from NOAA or Colorado.
From the link you provide:
You’ll note that NOAA references a multitude of deployed equipment since 1991. All different, all without error bars.
Which brings us back to the problems of averaging measurements from unique disparate equipment while alleging accuracy to fractions of a millimeter.
It is far better to trust physical tide metrics, especially those in operation for fifty plus years.
Sea levels measured to 100th of a mm? Yeah right!
Reportedly the smallest resolution at the wavelength used is 5cm.
Plus they are measuring the bottom of the swell. That means any increase over time is simply a function of how they estimate the height of the swell, which they do not measure.
It just gets better and better. Nothing like some more useful “fudge factors” that will allow them to “measure” whatever they want to keep the propaganda flowing. LMFAO.
The rise in the ocean level is attributed both to glacier loss and to thermal expansion.
If the oceans have warmed enough that we notice the thermal expansion, their warming has also reduced the amount of carbon dioxide they can hold. A 0.1 degree warming of the deep oceans would significantly decrease the solubility of CO2. It is quite possible that the modern increase in atmospheric CO2 is due to the warming of the oceans and that anthropogenic emissions are largely irrelevant.
The following link details the solubility of CO2 in water at the temperatures and pressures that prevail in the deep ocean.
“It is quite possible that the modern increase in atmospheric CO2 is due to the warming of the oceans and that anthropogenic emissions are largely irrelevant.”
No its not possible; the increase amounts to only half of what humans have emitted.
When does a zombie myth become deliberate disinformation?
I think it’s the analog of a buffer solution. You can add a lot of acid or base to the buffer solution without changing its pH much.
Similarly, the oceans contain so much CO2, and regulate atmospheric CO2 via Henry’s Law, that it may not matter what human emissions are.
I would be delighted if you can debunk what I’m saying with actual science.
Reportedly, I believe according to one of the first IPCC reports, the estimate for CO2 production by termites, worldwide, was 4X human emissions. The claim that termites are in balance with the world and so add nothing extra doesn’t consider the possibility that the termite population has not increased many more billions that the human population, perhaps do to a little warming being good for them. Certainly o one knows.
As areas warm slightly , termite regions expand.
Of course there is an increase in CO2 from termites,
They are going to LUV all that dead wood that was buried under glaciers 😉
“the estimate for CO2 production by termites, worldwide, was 4X human emissions”
The solution is so obvious! Let’s just exterminate 1/4 of the world’s termites!
It would be much cheaper than any other solution. They are a “Least Concern” species and not a particularly intelligent animal so why would anyone object to a modest kill-off of a locally dominant insect species. This is on the order with bird and raptor kill-offs that we would incur with wind turbines in the “green dream” of 100% renewable + no-nukes.
All the CO2 “estimates,” assumptions of “balance” and “net flows” are rife with opportunity to fudge their way to blaming changes to atmospheric CO2 on humans. The ice core reconstructions supposedly showed a CO2 following time lag of +/- 800 years. Subtract 800 years from 2021 and you’re in…wait for it…1221…or…the Medieval Warm Period they keep trying to erase.
…the increase amounts to only half of what humans have emitted.
“I would be delighted if you can debunk what I’m saying with actual science.
Why bother using actual science when actual maths will do?
No, even though the world’s oceans are a strongly buffered solution on average, they contain an almost insignificant amount of gaseous CO2 in solution, a small portion of which might be “outgassed” due to the oceans warming slightly. Also, the chemistry of CO2 reacting in sea water with a pH above 8 or so means that Henry’s Law does not apply . . . the physical/chemical reactions are NOT reversible and the oceans are NOT in partial pressure equilibrium with the atmosphere at the ocean surface.
Just look up and understand the Bjerrum plot and consider that Earth’s oceans have continuously maintained pH levels above 8 for more than the last 20+ million years (ref: https://desdemonadespair.net/2012/10/graph-of-day-oceanic-ph-24-million.html )
“an almost insignificant amount of gaseous CO2 in solution”
On the other hand there’s 360,000,000 SQ. KM of ocean surface.
As with many things in life, “significance” and “insignificant” are relative terms.
BTW, the total surface area of the Earth is 519,000,000 km^2, and about half of that is bathed in sunlight at any give time. Are those significant facts or not?
LOydo wining about “zombie myths”, now that thar is funny.
Irony personified!
Yes, it is HIGHLY PROBABLE that a large percentage of the CO2 rise is NATURAL.
From ocean , and land.
Only zombie around here is you and your Norwegian-Blue parroting, loy-satte.
“Only zombie around here is you and your Norwegian-Blue parroting….”
Lloydo brings to mind a pigeon on a chessboard.
Certainly not a parrot!
You need to watch more Monty Python. 😉
And if, as you “believe”, lhumans are responsible for most of the highly beneficial rise in atmospheric CO2…
…. then global atmospheric CO2 emissions will just keep climbing as China, Asia, Africa, Germany, Japan add more and more COAL-FIRED power stations.
So atmospheric CO2 levels will continue to climb for a long, long time. 🙂
And THERE IS ABSOLUTELY NOTHING YOU CAN DO ABOUT IT ! 😀
Loydo is a strange sad misanthropic sort of person. He revels in bad news and refuses to admit that anything could be good news. I feel very sorry for him
No just a simple algebraic fact David. If all the CO2 emitted by humans was still in the air we’d now be over 500ppm. Half is, half isn’t, which gets us to 414ppm. Nothing misanthropic or sad about mathematics. Lying to yourself about something so simple, well now that is sad. Repeatedly disinforming about something so basic goes beyond sad and into malicious.
We have the stakes ready every time you post, (or griff, or d’nyholist)
We know that what is coming is deliberate misinformation….. or just plain ignorance.
“When does a zombie myth become deliberate disinformation?”
When we’re constantly told there’s a climate catastrophe going on, and there is no data to support the claim.
CommieBob, not just the temperature has increased. The salinity of the mixed layer also appears to have increased. More saline water does not hold as much CO2 so it would help to raise the atmospheric levels.
This isn’t the sea rise you are looking for
” good agreement with satellite trends”? I thought they were saying the satellite trends were showing 3mm/year.
If you start the “agreement” in 1993… it kind of works… 😉
There is even better news. Curt Larson and Inga Clark of the USGS concluded in 2006 that, based on peat bog and sediment measurements around the Chesapeake Bay, that sea level has been rising at about 1.6 mm/yr for the past 6000 (six thousand) years. See “A Search for Scale in Sea-Level Studies” Curtis E. Larson and Inga Clark, Journal of Coastal Research, July 2006.
AR5 clearly makes the claim of accelerating SLR.
AR5 Figure 13.11 shows expected SLR for given scenarios.
RCP4.5 shows a rise from 2007 to 2020 of about 80mm or about 6mm/yr.
This is now falsifiable. It’s only about 3mm/yr or less.
As per Richard Feynman said
“It doesn’t matter how beautiful your theory is, it doesn’t matter how smart you are. If it doesn’t agree with experiment, it’s wrong”
As per Richard Feynman said
And I still disagree with him. He should have said “Observation” instead of “experiment”. The latter are often wrong or poorly implemented.
Jeff,
As are observations. He could have covered himself in caveats and justifications. He did not. I believe he was acutely aware of what you say.
Jeff Alberts and Anders Valland, actually Feynman in his famous videotaped lecture (see https://www.youtube.com/watch?v=5v8habYTfHU&feature=youtu.be ) giving the famous quote clearly states ” . . . compare it directly with observations to see if it works”, starting at 32 seconds into this YouTube video clip.
In this matter, Feynman uses the terms “nature” and “experiment” and “experience” and “observation” interchangeably.
The Internet never forgets.
Thanks very much for the context, Gordon!
The climate4you website under ‘Oceans’ shows a series of global tide gauge records with corresponding rate of change graphs, few if any of the longer time series show an overall uniform accelerating rise.
There was a study fine of about 50 globaly distributed tide gauges, adjusted for geostatic rise or fall. As I recall they showed zero acceleration and a rate of about .4 to 1.4 mm per year.
The situation around Australia appears to be somewhat worse from the perspective of the land mass going under:
http://www.bom.gov.au/ntc/IDO60201/IDO60201.202011.pdf
On the positive side the water around the land mass is not getting any warmer per page 19.
I do not know what corrections are being made for land movement and the accuracy of the elevation correction. However the tide gauge data in Port Kembla shows a rise in MSL of 10mm over the last 30 years. That is 10X the figure being reported by SeaFrame.
http://www.bom.gov.au/ntc/IDO70000/IDO70000_60420_SLD.shtml
Hard to reconcile these differences.
The BoM are world leaders in data homogenisation in support of the IPCC fairy tale. SeaFrame increases the potential to separate reading from reality. It is easy for them to adjust that than fiddle with tide gauge data that the odd Harbour Master has an interest in.
Look at Darwin and Esperance here..
Would be an interesting exercise to look under the hood of the SeaFrame data. BoM are able to compensate for air pressure. That is easy to check. The only way to reconcile the tide gauges and SeaFrame is for the land where gauges are located to be rising, or at least according to SeaFrame.
Mike, where/when is that data from?
I have data for Fort Denison back to 1914, and Newcastle back to 1966
I can’t remember. I have had it tucked away for a couple of years without a title.
Found these too..
How to you put multiple images in one post?
Look at the wild swings in the late 60s early 70s in South Africa! 40mm over 3years!
What’s that about?
“What’s that about?”
Probably Changes in the Agulhas Leakage.
You should see a doctor about that!
Ah! Bill Gray’s site, I think
Notice data ends in 1995.. explains the 20 or so year difference.
Cheers 🙂
Sydney Tide gauge show very close to 1mm/year
Newcastle shows about 1.6mm/year
You see, Fred, the rise up until 1960 was natural. After 1960, the rise is caused by Americans driving their families to Florida on summer holiday in CO2 emitting Buicks and minivans. …when, instead, they should have been sailing to Florida in multimillion dollar yachts. Shame!!! Shame on America!
I guess its the high tide mark that is important for “floodingᴸᴼᴸ”..
so Sydney is about 0.75mm/year
Quick, get me a life jacket !!!! 😀
“Chief!” “Hooper!”
Look at page 26 ! 😉
For those interested, Page 26 is about temperatures at the SeaFrame sites.
There is NO significant temperature change at ANY of the SeaFrame sites since 1990
http://www.bom.gov.au/ntc/IDO60201/IDO60201.202011.pdf
Not sure what you mean about Port Kembla tide data..
I grabbed the data and graphed it from 1984 (after a large break in the data)
I reckon around 1.5mm/year
Basically, it has got to the stage that you CANNOT TRUST any “data ⸘” from BoM whatsoever. !
Minor note on the units, “mm/yr−¹” should be either “mm/yr” or “mm yr−¹”
And of course, in the middle of the ocean, where the satellite “construction™” shows 3mm/year (SCARY)
We have Tuvalu
Like I said before, the gauges are the single best way to convince people of the global warming hoax. Any fool can look at the graphs and see that, in no way, do they correspond with the horror stories they have heard.
Hmm that just can’t be right. Tuvalu must be in isostatic rebound, offsetting the SLR. You know – all those nearby glaciers are just melting like crazy. Wait… nevermind.
Perhaps it is all of those little reef-creating creatures building up the reefs and raising Tuvalu.
Those sea level trend graphs match the AMO and NH temperatures pretty closely. 😉
If you take the median of the 300 or so tidal gauge slopes at noaa, you get 1.50 mm per year.
Takes all of 10 minutes to do…with a histogram. I’ve done it myself.
Then if you click on a few of the better, longer graphs around the median you clearly see that there is no environmentally significant acceleration.
Seriously, it takes all of half an hour to figure out the 1.5 mm per year figure.
Exactly!
It appears to me that those who write about Climate issues have no appreciation of the difference between rate and acceleration.
If the trend is linear at 1.5 mm/y, how can there be an acceleration of any size, let alone a rather huge rate of 0.07/y^2, which would double the trend in just 20 years?
You are right If the acceleration has been 0.07 since 1958 (which is what they seem to be implying), then the slope should be at least 4.2 mm/yr by now.
Hey, give the satellite sea level guys time.. They are working on it !!
The rate of sea level rise is the mean across the period of record, so the rate did not start at 1.5mm/yr in 1958. Similarly, the acceleration is the mean rate of change across the period of record, and does not necessarily mean that the acceleration was 0.07mm/yr^-2 in 1958.
.07 mm/yr^2 x 60 yr = 4.2 mm/yr
What am I missing again?
Not much, except that the rate of change has not be constant across the period of record. From here:
Never said it was constant. but multiplying the average by 60 should be close to the true figure.
Show me the graph of a single tidal gauge that should scare me. If the “average” is bad, then the extreme should be terrifying. So show me it.
If we look at the above graph, it is quite evident that the rate of sea level rise today is quite consistent with simply multiplying the average by 60 (4.2 mm/yr) – the indicated range is from 2.5-5 mm/yr.
I am not interested in engaging in the exercise of trying to scare or terrify you with tide gauge records. The fact that SLR continues apace is concerning enough.
I don’t see any mention in the article of aquifer extraction which is already adding 0.6mm to sea level annually and projected to rise to 0.8mm by 2050. Once this is allowed for, this means that the amount of glacial melting or thermal expansion must be overstated.
https://www.nationalgeographic.com/news/2012/6/120531-groundwater-depletion-may-accelerate-sea-level-rise/
Is it possible that the terrestrial water storage figure includes aquifer extraction?
Here’s a chart where each plotted point represents

the rate of sea level rise over the previous 30 years
for several long running tide gauges:
This chart illustrates the changes made to sea level
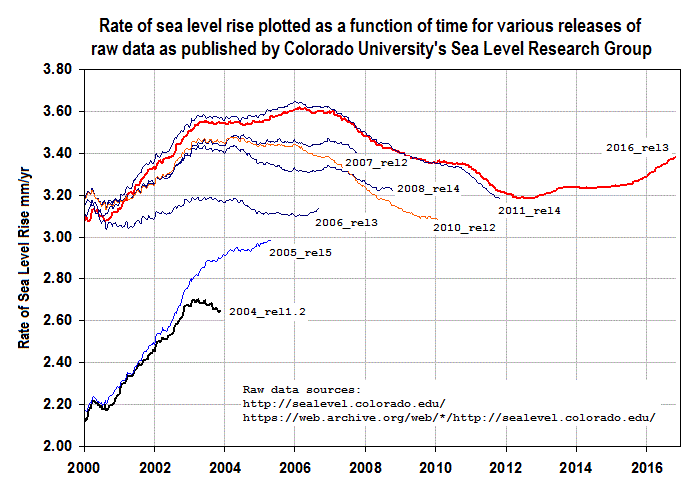
data from satellites for the period 2004-2016:
Over the last four years Colorado University’s Sea Level Research Group has made changes to the satellite data that claim acceleration in the rate of sea level rise to have increased from 0.084 mm/year² in 2018 to 0.097 mm/year² in 2020.
Colorado University…
“Hey guys! Let’s find someplace as far from any oceans as possible, and make a… ummm… Sea Level Research Group! Yeah!!”
I’m currently watching the Twenty20 cricket.
The chasing team needs to get so many runs per over.
For every over they don’t get the required rate, that rate goes up..
The IPCC has stated the rate for
RCP 4.6 – 6.5 mm/yr( 3.5 – 8.8)
RCP 6 – 7.4 mm/yr(4.7 -10.3)
RCP 8.5 – 11.2 mm/yr(7.5 – 15.7)
The current rate is clearly under 3.5mm/yr But we’ve used up 13 years already. The required rate to meet even there “softest” projections is slipping away.
Example the NSW government states the rise Of 400mm by 2050.
To meet the 400mm by 2050 the rate now needs to be 12mm/yr
Arguing over 1.5 or 3 doesn’t matter. It’s NOT 12mm/yr.
The IPCC and the BOM/CSIRO and Australian Governments are WRONG
If you Google “Sea Level” in the news, the media is gushing with predictions of close to a meter of sea level rise by 2100 which comes to 12.6 mm/yr over the next 79 years. Last year that was only 12.5 mm/yr. As time goes by that yearly difference will increase faster and faster each year until it becomes really ridiculous. Well it’s already ridiculous as sea level as reported by NOAA is around 1.7 mm/yr. The question to ask is, when is this increase in the rate going to begin to happen.
I will become worried when the rate reaches the equivalent of the 400 foot rise in about 25,000 years, as it was during the end of the last ice age.
Just like the “Climate (Pseudo) Scientists” claiming human-induced climate catastrophe.
What happens to satellite measurements when the sea is rough or when it is calm? Is there some sort of correction needed? If the ocean were to get smoother over time, what would that do to satellite measurements?
JF
They make all the celestial bodies in the universe stop moving while they take their measurement. Simples!
The moon is worse than we thought
This article is a bit odd, since its claim that these papers show no change in SLR across the 20th century is directly contradicted by the papers themselves, which both explicitly state that SLR has accelerated.
Sea Levels are 2-meters lower today than during the Holocene High Stand. Glaciers stopped advancing as we mildly thawed up out of the Little Ice Age, the coldest era of the past 8,000 years. Since then sea levels raised by 7 inches or so…Cold Kills 20x
I love “1.56 mm/yr−¹”.</b> Fortunately not written that way in the paper itself.