Reposted from Polar Bear Science
Posted on October 17, 2020 |
Arctic sea ice has been growing steadily since the minimum extent was reached a month ago, with shorefast ice now developing along the Russian and Alaskan coastlines as ice cover expands in the Central Canadian Arctic. So while it’s true that the main pack of Arctic ice is far from the Russian shoreline, rapidly developing shorefast ice will allow bears to begin hunting seals long before ice in the central Arctic Basin reaches the Siberian shore, as they do in Western and Southern Hudson Bay every fall.

And speaking of Western Hudson Bay, it’s a very slow season around Churchill for problem polar bears (photo below) – the quietest mid-October for the Polar Bear Alert Program in the last five years and perhaps the quietest in decades (which I could say for sure if I had the records but I do not).

Average September sea ice cover was the second-lowest since 1979 but still within the 3-5mkm2 (see graph below) that polar bear experts wrongly predicted would cause the loss of 2/3 of the world’s polar bears (Crockford 2017, 2019, 2020):

ARCTIC SEA ICE THICKNESS

Compare above to 2012 on the same date, courtesy DMI below:

BEAUFORT SEA ICE VERY CLOSE TO SHORE
Soon the shorefast ice along the Southern Beaufort will meet up with the southward advancing pack ice and the region will again be ice-covered – after an ice-free period of less than 3 months – see 18 July 2020 chart below to see when the ice left the shore:

And what a difference a couple days makes! It literally took two days for a big change in Southern Beaufort Sea ice coverage. As the chart below from the Canadian Ice Service shows, by 17 October the Arctic pack mass was connected to rapidly-developing shorefast ice along the central coast of Alaska, which means that polar bears wishing to resume hunting have plenty of opportunity to do so beginning today:

BARENTS SEA LAGS BEHIND 2012 REFREEZE
Pack ice movement into the Barents Sea this year (image at top of post) is lagging behind 2012 (below) but not by much. It is likely to be only a few days before the ice reaches Franz Joseph Land as well as the archipelago of Severnaya Zemlya in the Kara Sea (middle of the image below, third group of islands east of Greenland). However, if 2012 is any indication, it will likely be early December before enough shorefast ice develops along the east coast of Novaya Zemlya (that long, skinny island upper right of image) – where all the bear trouble was in early 2019 – which will allow bears that spent the summer on shore to resume hunting (rather like Western Hudson Bay bears in a ‘late freeze-up’ year, see discussion below). It will be later than that (January/February?) before the Kara Sea will be filled with ice.

MEANWHILE IN WESTERN HUDSON BAY
No ice yet, of course – we wouldn’t expect ice in Hudson Bay even in the good old days of the 1980s. But the bears this year seem to be unusually mellow, content to patiently wait until freeze-up without causing much trouble, at least around Churchill. The situation might be shaping up differently in Arviat a bit further north. For your amusement, below is a video of a bear at Cape Churchill patiently killing time waiting for the sea ice:
The latest report on problem polar bears in Churchill for week 7 (below, 5-11 October) suggests a pretty boring time for Polar Bear Alert folks:

Forty-four incidents (‘occurrences’) as a cumulative total is very low for this time of year – and zero handled to date and zero in jail (the ‘holding facility’) is virtually unheard of. While last year (2019) was also a slow year for bear trouble in Churchill compared to other years, it was nowhere near as slow as this year:

Compare the last two years to 2018 (below), which was (like 2019) an early freeze-up year. In 2018, by the end of the second week in October there had already been 154 incidents, 8 bears in jail and 13 trapped and released locally:

In contrast, 2016 was the last year since that freeze-up was really late (i.e. early December) but because the bears came off the ice in great condition, by the second week in October the situation was no worse than 2018, when freeze-up was early:

Unless freeze-up is very late again this year – as it was in 1983 – this fall is shaping up to be something like 1984 in terms of polar bear problems in Churchill after a similarly late start to the season as this year (which began the last week of August). In the 1985 Polar Bear Specialist Group meeting report (Calvert et al. 1986:24), the problem bear situation in 1984 was described this way:
“In 1984, the Polar Bear Control Programme season in Churchill was from 1 September to 2 November, more than a month shorter than the 1983 season. There were 69 reported incidents, and 200 man-days expended. There was one serious encounter – a mauling in which there appeared to be extenuating circumstances.” [my bold]
Time will tell and depends on whether freeze-up comes in early November as it did during most years (but notably not all) of the 1980s.
REFERENCES
Calvert, W., Stirling, I., Schweinsburg, R.E., Lee, L.J., Kolenosky, G.B., Shoesmith, M., Smith, B., Crete, M. and Luttich, S. 1986. Polar bear management in Canada 1982-84. In: Polar Bears: Proceedings of the 9th meeting of the Polar Bear Specialists Group IUCN/SSC, 9-11 August, 1985, Edmonton, Canada. Anonymous (eds). Gland, Switzerland and Cambridge UK, IUCN. http://pbsg.npolar.no/en/meetings/ pg. 19-34.
Crockford, S.J. 2017. Testing the hypothesis that routine sea ice coverage of 3-5 mkm2 results in a greater than 30% decline in population size of polar bears (Ursus maritimus). PeerJ Preprints 2 March 2017. Doi: 10.7287/peerj.preprints.2737v3 https://doi.org/10.7287/peerj.preprints.2737v3
Crockford, S.J. 2019. The Polar Bear Catastrophe That Never Happened. Global Warming Policy Foundation, London. Available in paperback and ebook formats.
Crockford, S.J. 2020. State of the Polar Bear Report 2019. Global Warming Policy Foundation Report 39, London. pdf here.
I’m getting a jump on this one.
Griff, how long is your record?
ROFL the great Griff troll drive by incoming, he is getting as predictable as Mosher.
But I’m right and backed by detailed science, especially actual physical records of the state of the ice. I’m not misrepresenting one of the poorest refreeze seasons ever seen as a ‘steady increase’ – frankly that’s a lie
Your obsession over low summer sea ice levels, actually hurts your credibility, since you have yet to realize that Polar Bears, Sea Lions are thriving with the lower sea ice cover.
You have NEVER showed why low summer sea ice cover is a valid concern to the planet, thus all your caterwauling over the low sea ice cover is a waste of time,
It is time for YOU to up your argument, to explain why many here should take your low sea ice mantra seriously, otherwise you will be considered a low rent thinker.
Griff’s obsession with Sea Ice levels AND German Renewable fixation are similar to Stephen Lewandowsky’s obsession with Conspiracy Ideation and Naomi Oreskes’ obsession with ExxonMobile
Plenty of well understood reasons but reduced albedo feedback is a good place to start if you’re curious. Unpredictable affects on NH weather patterns another. Plenty of research papers on this subject which I’m sure everyone here will read.
And yet you produce NOTHING , loy.
No evidence that a return to more normal levels of sea ice after the extreme highs of the 1970s will cause any more unpredictable weather than a frozen Arctic would.
PLENTY of evidence that an Arctic with a more normal sea ice extent is a boon for Arctic life, especially sea life.
Did you know that the Bowhead Whale is making a recovery, because it can now find food and that the use of fossil fuels and plastic means it is no longer hunted for whale blibber and bone
Do you even care ????
I could try and explain how reducing albedo will be an additional warm forcing but you wouldn’t understand and instead just reply with a series (it takes you 3 usually) of shouty, angry posts peppered with insults and fake graphs. Do you ever wonder why no one responds? I actually feel a bit sorry for you.
YAWN !
I’m not angry.. I’m laughing at your inept attempts at anything to do with science or reality.
All my graphs can be easily reproduced by anyone who knows even the slightest bit about data…… (I can’t help your total ineptitude.)
Or can be easily found in peer-reviewed papers.
yet again, you produce NOTHING but mindless pap/
Loy-Duh and Griffiepoo insult and belittle other posters such as Fred250, then whine when they receive the same treatment. Typical of Lefty weaklings.
What albedo do you expect during winter in the arctic, Loydo ???
Even a poor refreeze is an “steady increase” and not a lie, but fact.
Griff, how long is your record?
If you look at the data of the last falls you realise, that this year the poor increase this year is comparable to to the last years, only this year there are no days, no, one day, with a decrease.
But, only you have to look at the data, if you are able to.
Representing current level of sea ice as “low” .. that is the LIE, griff.
But its all you have.
No, Fred I will disagree with you there: 2020 has set the record low sea ice extents for many days this year. The past 10 years has been consistently lower than the previous 10 year average (for the Arctic sea ice), and each ten year period since records began in 1979 has been lower than the previous ten years.
BUT!
What the professional sea ice extents group at NSIDC and their cohorts internationally have failed to calculate is that – over the course of an entire year, the EXTRA heat lost from the newly-exposed Arctic Ocean is GREATER than the little extra heat gained during the Apr 15 – Aug 15 summer melt season.
Yes, absolutely, more heat is gained into open Arctic waters in May, June, July and early August each year. But more heat is lost from those open Arctic waters the remaining 7 months of the year. Less Arctic sea ice, more heat loss. There IS a negative feedback to the mythical Arctic Death Spiral so often promoted.
And, to make the prognostications even worse, theimages used are themselves valid, but not for the Arctic. i’m working with Anthony on a series of articles on each of the issues:
What is the Actual Arctic Sea Ice Trend, and Why Does It Matter?
Where is the Arctic Sea Ice, and When is it There?
What is the Albedo of the Open Ocean, and How Does It Change?
What is the Measured Solar Radiation on the Arctic, and Who Measured It?
What is the Solar Elevation Angle over the Arctic, and Why Does It Matter?
What is the Albedo of the Arctic Sea Ice, and How Has It Changed With Time?
What are the Other Heat Losses from the Arctic Ocean, and When do They Matter?
Any one interested in checking my work, please speak up. Since we are (collectively) challenging conventional wisdom in all of its armor and self-protection, I welcome all critical comments.
You’re full of soup and paid by the Chinese to disrupt intelligent disouse.
By talking about ice thinning ice, griff is hoping to divert attention from all the ffailed fforecasts. The Arctic was supposed to be ice free by 2013, or 2014, or 2015, or 2016, or 2018. You can see these ffaulty fforewarnings in the newspaper clippings at https://cei.org/blog/wrong-again-50-years-failed-eco-pocalyptic-predictions
Griff
Have you anything to say about the exceptionally high extent of Antarctic sea ice right now?
It’s not exceptionally high, close to the 2010’s average and in no way ‘balances’ the severe shortfall in the north. Even the global extent is still 4th or 5th lowest for the date, which clearly shows how low the Arctic sea-ice is.

“the severe shortfall in the north.”
There is NOT a severe shortfall in the Arctic
Arctic sea ice is still very much in the HIGH range of the last 10,000 years
Stop emulating the griff STUPIDITY of thinking that the extreme levels of sea ice from the 1970 and LIA were usual or desirable..
Even you are not as dumb and unthinkingly brain-washed as griff is… or are you !!
Average September sea ice cover was the second-lowest since 1979.
SO WHAT !!
Its a piddlingly short period , down from an extreme high.
You admitted before, that lower sea ice levels were GREAT NEWS for all life in the Arctic
Even though that are still WAY ABOVE the Holocene norm.
Why try to prove you are as DUMB as griff ! D’oh !
“Average September sea ice cover was the second-lowest since 1979.”
As dumb as Susan Crockford you mean? I just copied her line from above to gauge your bias.
““Average September sea ice cover was the second-lowest since 1979.””
SO WHAT !!!
This is a GOOD THING.. you have already agreed to that.
She isn’t trying to make a meal out of it. You are.
There are 41 years of the satellite record – I believe 30 years is usually deemed to show changes from climate, not weather?
There is now a detailed collated record of all arctic sea ice records going back (so far) to 1860. (The records of all national govts and institutions recording, whaling ship records, local records, the lot).
The current sea ice extent is the lowest you would find in that detailed record for the date. The 2020 sea ice minimum was the second lowest.
And if you want to look at the numerous proxies showing sea ice extent etc, you would have to go back to the point where the seasonally ice free Arctic starting freezing over again some 13,000 years ago to find a situation with less ice.
Is there some reason why we should believe that earth’s climate is naturally stable and unvarying?
1000 years ago the Norse settled Greenland and were raising animals there, along with oats, barley and rye. It is too cold there today for this type of activity. Then the earth grew colder, eventually wiping their settlement out as they were unable to survive the increasingly cold climate. This is all well-documented in the historical record, along with the fact that similar changes occurred in other parts of the world. Perhaps you can tell us how humans caused that well-documented sequence of events?
“It is too cold there today for this type of activity.”
It might have been, but not any more.
“…due to climate change – in southern Greenland, the growing season averages about three weeks longer than a decade ago[35] – which has enabled expanded production of existing crops. At present, local production accounts for 10% of potatoes consumption in Greenland, but that is projected to grow to 15% by 2020. Similarly, it has enabled new crops like apples, strawberries,[36] broccoli, cauliflower, cabbage, and carrots[35] to be grown and for the cultivated areas of the country to be extended…”
https://en.wikipedia.org/wiki/Greenland
GREAT NEWS , hey Loy
People up there no longer have to cope with frozen sea ice all year around
The Arctic is GREENING.. stuff is ACTUALLY GROWING !!!!!!!!
Sea life is returning, now that the Arctic is RECOVERING back slightly towards more normal Holocene.
Such GREAT NEWS.. wouldn’t you agree ! 🙂
Absolutely. Winners and losers, Greenland the biggest winner.
Great that you agree that the natural warming in the Arctic has been an absolute PLUS for all life up there…
Maybe you are capable of accepting reality !
Look at that and go to start, no cash, next…..
So what, Griff?
Decline of seaice started with the end of the Little Iceage. So, tell me, where is your problem with that, if there is any (I can’t ssee it) ?
If polarbears could read, they would die laughing reading your posts 😀
Griff, you do realize that Earth history goes further back than 1860? How much sea ice do you think was present during the mid-Holocene Optimum when spruce trees covered the Arctic tundra where it is NOW so cold the soil is permanently frozen (permafrost)? Not to mention the Eemian.
You want to convince the WUWT readership that anthropogenic CO2 is responsible for the current ice level, what was responsible for the aforementioned periods when there was little to no sea ice present at all? Safe bet it wasn’t from humans burning fossil fuels.
Milankovic cycles mostly. Right now we should have neo-glaciation but something abruptly halted that about 150 years ago. What’s causing it? Anything but CO2 I guess.
You have PROVEN very convincingly that it IS NOT CO2 gas causing this HIGHLY BENEFICIAL WARMING
Be extremely glad that it did start warming around 1850…
In line with solar activity.
As you say.. NOT CO2
1… Do you have any empirical scientific evidence for warming by atmospheric CO2?
2… In what ways has the global climate changed in the last 50 years , that can be SCIENTIFICALLY proven to be of human causation?
“Right now we should have neo-glaciation”
So basically you are complaining about humans causing the Earth to become habitable.
WOW. !! Nobody can’t beat Loy’s level of stupid.!!
Little Ice Age ended, so what ? 😀
Figured you or Griff would mention Milankovic cycles. Sorry, but won’t work. What about Roman & Medieval Optimums, the 1930’s as well as any number of climate episodes when it was much warmer than current time?
Wrong my guess it been this low at least in 1906 and other times in the twenty century. The only is seems so ice free is we now can watch it from above.
Griff
The ice extent is lower because we are in a warming trend period, that is pretty accepted.
What is up for discussion is the contention that low ice will wipe out the polar bears.
As Susan points out in this post, this ice extent was supposed to mean 2/3 of bears gone now.
That’s 2/3 of the estimate from the 80’s, ~7000-8000 meaning only 2-3 thousand left now.
That was the prediction, screamed from the rooftops, videos of polar bears falling from the sky and dying.
And your favorite subject.
Yet estimates are ~10x that number and increasing, fat happy bears everywhere with multiple cubs the norm, all defining and Uber healthy population?
When will the die off begin?
How long do I have to get my own polar bear rug?
If you aren’t going to respond to these questions then you really are just a low life no nothing troll and you should completely stop commenting about sea ice extent.
You’re boring
I’m predicting total silence from Griff from this point onward. But I would love to be proven wrong.
Not only are the PBs doing really well, So is Arctic sea life, now that it doesn’t have to contend with solid ice all the year round.
The recovery slightly towards more normal Holocene levels has been a boon for all life in the Arctic
Not only is the land surface GREENING, but the seas are also springing BACK to life after being TOO COLD and frozen over for much of the last 500 or so years (coldest period of the Holocene)
The drop in sea ice slightly toward the pre-LIA levels has opened up the food supply for the nearly extinct Bowhead Whale, and they are returning to the waters around Svalbard.
https://partner.sciencenorway.no/arctic-ocean-forskningno-fram-centre/the-ice-retreats–whale-food-returns/1401824
The Blue Mussel is also making a return, having been absent for a few thousand years, apart from a brief stint during the MWP.
https://journals.sagepub.com/doi/abs/10.1177/0959683617715701?journalCode=hola
Many other species of whale are also returning now that the sea ice extent has dropped from the extreme highs of the LIA. Whales cannot swim on ice. !
https://blog.poseidonexpeditions.com/whales-of-svalbard/
Great thing is, that because of fossil fuels and plastics, they will no longer be hunted for whale blubber for lamps and for whale bone.
Hopefully the Arctic doesn’t re-freeze too much in the next AMO cycle, and these glorious creatures get a chance to survive and multiply.
From the second link..
“Shallow marine molluscs that are today extinct close to Svalbard, because of the cold climate, are found in deposits there dating to the early Holocene. The most warmth-demanding species found, Zirfaea crispata, currently has a northern limit 1000 km farther south, indicating that August temperatures on Svalbard were 6°C warmer at around 10.2–9.2 cal. ka BP, when this species lived there. The blue mussel, Mytilus edulis, returned to Svalbard in 2004 following recent warming, and after almost 4000 years of absence, excluding a short re-appearance during the Medieval Warm Period 900 years ago.
Arctic is so much COOLER than it was for most of the Holocene, which explains why there is still so much sea ice up there.
We should be REJOICING the return of sea ice after the period of bleak, unusable anomalously extreme sea ice levels.
“There is now a detailed collated record of all arctic sea ice records going back (so far) to 1860.”
No there is a fabricated record with a completely implausible lack of variability for extensive periods and a widespread assumption that all the vast time/areas with no reports had ice, it has nothing to do with science and everything to do with propaganda.
41 years of satellite data doesn’t even cover 1 full ocean cycle.
And the amount of ice doesn’t even matter – it’s not the end of the world if the Arctic is ‘ice free’, as it has been before and will be again.
WOW, what a piddlingly shrt period of time.
No wonder Arctic sea ice hasn’t recovered to anywhere near the Holocence average.
Still one heck of a lot of sea ice up there.
You do know that Polar Bears survived ALL of the Holocence , when for most of the time, there was far less sea ice than currently in the Arctic.
Why continue to deny climate change, griff. ?
“and if you want to look at the numerous proxies showing sea ice extent etc, you would have to go back to the point where the seasonally ice free Arctic starting freezing over again some 13,000 years ago to find a situation with less ice.
Now THAT is just a bald-face LIE. !!!
You know Griffy, every time you throw a stick a bunch of us heretics chase it. That must really amuse you to derail every thread. I still think you are a paid troll but I am beginning to believe that you might actually believe some of your own crap and be dumb enough to think readers will too.
41 years. I have been out of college for 42 years and I remember seeing lots of information on the arctic including satellite images of sea ice well before 1979.
I visited the arctic as a kid with my father and I remember in the late 60’s and early 70’s The old folks up there complaining about the amount of melt and higher temps because of mud and bugs. When things were thawed you were pretty much shut down from going anywhere due to mud and bugs.
I entered college in 1974 and remember the sudden alarm at how fast the sea ice was increasing and the temps were decreasing. In the late 70’s we could not get into the woods until mid June and crops other than rutabagas and carrots were hard to grow. I was70% convinced of an impending ice age by 1978. By 1983, things seemed a lot less certain.
By the late 80’s it was clear to me that the same suckers who pushed a new ice age were the same suckers who were pushing global warming. By that time though I had lived a bit more history , I realized they were Chicken Little. Because it was the same crowd that pushed ozone depletion, I didn’t buy into that either.
To make a long story short, history of arctic ice including satellite photos goes back a lot longer than 41 years and some of us remember well what it was like. No one has to tell me, I lived it. I still ski every winter and the Chicken Little’s are just as frickin dumb as they were a thousand years ago. One thing living a while teaches you. You get to experience the calendar maturing through many apocalyptic dates with nary a whisper. One thing about dooms day scenarios throughout history. There are millions of dooms day predictions and not one of them has ever been true because we are still here. This dog no longer chase those sticks.
“some 13,000 years ago”
When the Earth was in a full on Ice age. ?????
You are serious DUMB, griff !!
Griff
Have you anything to say about the exceptionally high extent of Antarctic sea ice right now?
Correct me if I am mistaken Griff but your last paragraph sounds like you’re saying that there was Less Sea Ice 13,000 years ago than there is today
And if you want to look at the numerous proxies showing sea ice extent etc, you would have to go back to the point where the seasonally ice free Arctic starting freezing over again some 13,000 years ago to find a situation with less ice.
Sounds like Today’s Ice levels are not the lowest in history…Per Griff
Arctic ice has a 60-70 year cycle so NO the satellite record is not long enough to show the full variation of a cycle.
The anecdotal records show that ice extent has been at least at this level before so the obviuos question is what caused that? Similar to how could the Vikings farm on Greenland but you can’t now? If it has been this warm or warmer in the past why is this period anything special?
The sequel “… polar bear finds a snack” continues with the slightly more entertaining
“Polar Bear Playing with Stick” from same location – allowed for all ages:
Glad to know that, think it was the Denver Zoo where they gave them even little thicker “sticks” to amuse themselves. Apparent adult played with it in the water, didn’t find out if zoo discovered it by accident or field observation, but it was standard policy.
Not a stick
Bear toothpick, trying to get that last bit of blubber caught in his teeth
I was thinking along the same lines Pat, he sure makes dental hygiene look like fun! Very funny.
I downloaded the Arctic Average September Sea Ice Extent only couple of weeks ago, did a simplest of data analysis and concluded ‘it is natural osculation’ that appear to be in close sink with the Northern Hemisphere’s temperature periodicity in the region of 70 years.
http://www.vukcevic.co.uk/ArcticIce.htm
From my graph I would suggest there is another or two more years before an absolute minimum is reached and from then on is all the way uphill for another 35 years, mirroring the last 35 or so years of down slide.
Its far more that 35 years of down slide.
The 2nd lowest extent in the satellite record was this year, the third lowest last year, the 4th lowest 2016. Clearly we are not at the bottom yet.
It’s not clear at all if you follow the natural cycles….
But that you can’t, becoause your records aren’t long enough ( kudos to ?) 😀
The “griff-prediction-center ” at it’s best 😀
Not exactly Griffo.
A natural periodic osculation is not an exact Cos-ine, so it generates a number of ‘n-th’ lowest values when it is in the vicinity of its minimum, the same as in 1980 was the highest in it’s 40 year long record, the second highest in 1996 (24 years ago), the third highest in 1992 (28 years ago) and the 4th highest in 1986 (34 years ago) as most of reasonable people (I don’t know about you) would expect of a periodic osculation to do when it is in the vicinity of its maximum.
Average of these values (considering the extent numbers) and also confirmed by the polynomial trend line, the maximum extent was in 1985, that would give it a half period of 35 or so years.
The AMO cycle of sea ice was evident even during the extreme high sea ice levels of the LIA.
Griff
Didn’t Vuk just say it would be lower for a couple more years?
Try reading.
I think you should pause commenting on this for 3 years to wait and see if Vuk is right
Or if 90% of the bears suddenly starve to death or drown, as you so fervently wish for, you sadly really seem to need dead polar bears to validate your beliefs
Only low compared to the EXTREME highs of the late 1970’s which were up there with the Little Ice Age.
“as you so fervently wish for,”
Yep, griff absolutely HATES Arctic wild life.
Wants to see the Arctic covered with 100% ice, so that the oceans cannot be used for sea life.
He hates the fact that the RECOVERY from the extreme highs of the LIA and late 1970s is allowing extinct species to return and grow in numbers.
https://partner.sciencenorway.no/arctic-ocean-forskningno-fram-centre/the-ice-retreats–whale-food-returns/1401824
A truly sick anti-life ideology, that is for sure. !
Griff Yeah but the lowest was 2007 almost a decade and a half ago. The Antarctic ice is above ‘climatological’ after 41 years and you seem to have missed the point of the article that it is freezing up fast in the Arctic from the shorelines into the sea (probably not reckoned in the ice extent), sufficient to carry the weight of polar bears.
Snowing from Montana to New England discussed yeaterday means shore ice on Lake Winnipeg a couple of thousand km south of Arctic action isnt far off.
No, the bottom is way , way down from what it is now.
you know,…… like for most of the Holocene.
Current levels are WAY UP compared to the last 10,000 years.
and probably similar to the 1930s, 1940s
Its far more that 35 years of down slide.
LIAR
The peak extreme high sea ice was in the mid 1970s.
Before that it was much lower.
Are you suggesting Arctic sea ice is NOT linked to Arctic temperatures.
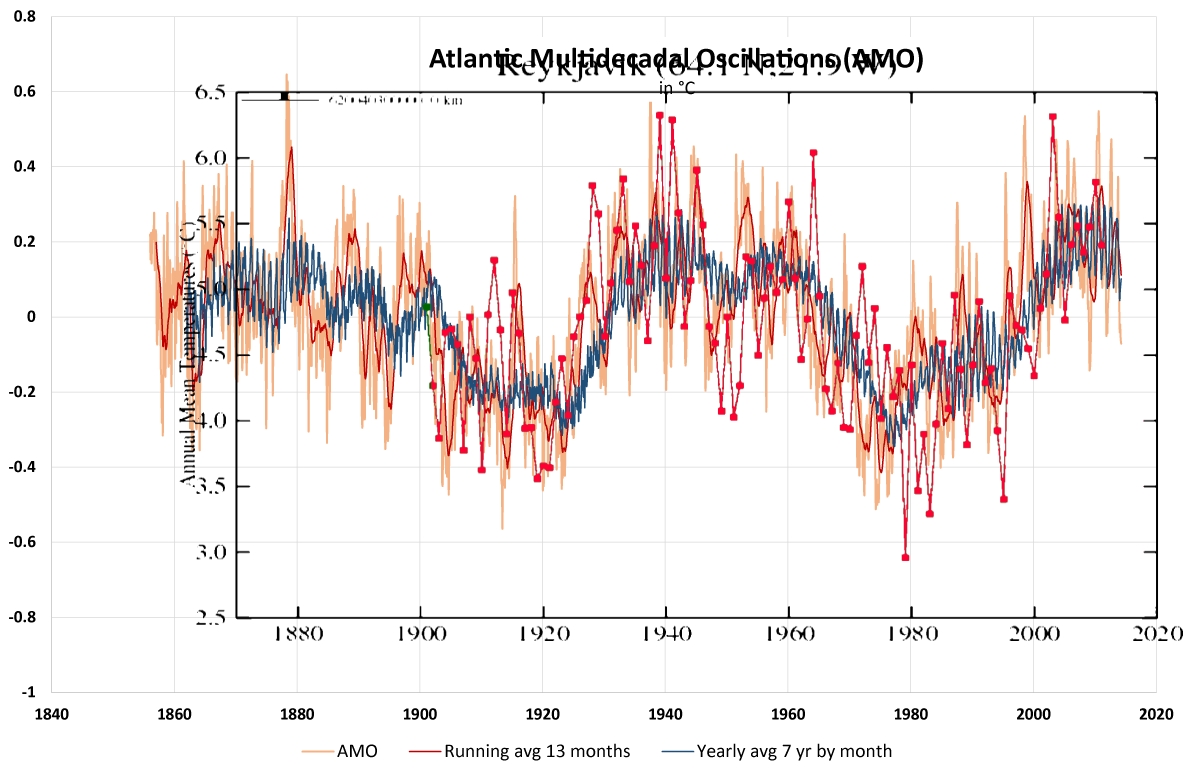
Reykjavik temps vs AMO.
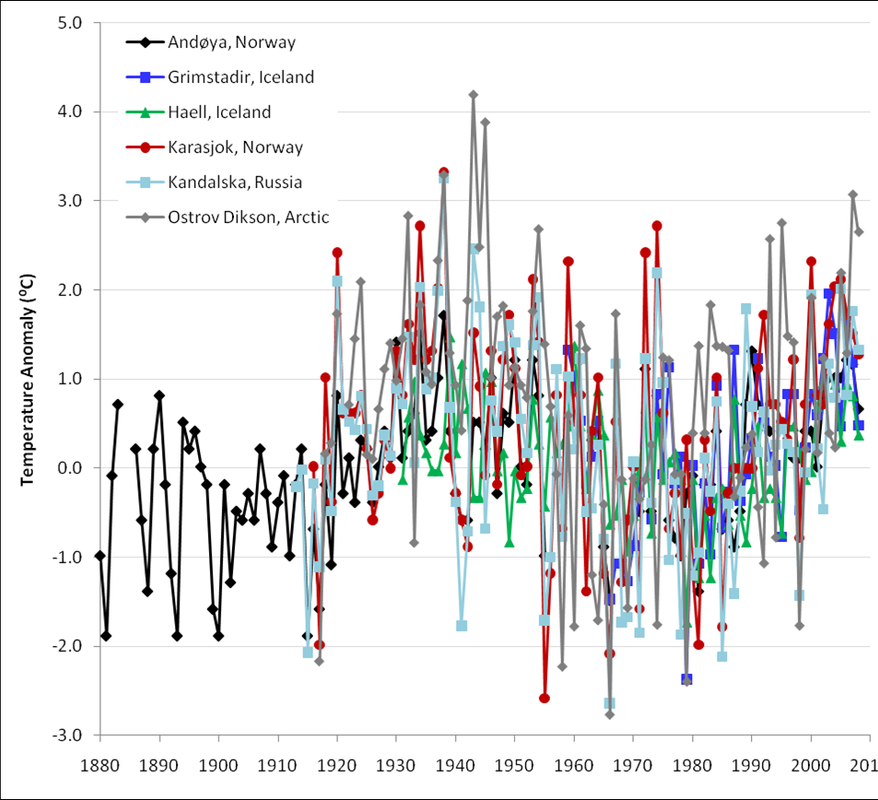
Temperatures from around the Arctic.
That would destroy your whole empty pointless parrot-like argument, griff.
35 years is half a cycle in the Arctic. It was a convenient fraud when they decided to start the “satellite” observations in 1979 when they really started earlier. Griff, why do you not quote the chart from the 1990 IPCC report which has the ice a lot lower that in 1979?
Your fictional reference to “data” back to the 1860 also depends on who interpreted it. There is no total for any year.
NH sea ice vs AMO (sea ice up-side down)
Reykjavik temperature vs AMO
AMO versus isolated Arctic temps
Seems vuk is correct,
… and griff IS WRONG.. as always.
“Reykjavik temperature vs AMO”
Which shows a high temperature point in the 1930’s and in the 1880’s that were just as warm as today.
The temperatures warm up to a highpoint, then the temperatures cool for decades, then the temperatures warm again for decades and so on and so on.
We hit our latest temperature highpoint in 2016. Based on past temperature movements, the temperatures should be starting into a cooling phase.
Poor alarmists, the temperatures just wont cooperate with them.
If you link seaice extend to the AMO, the last minimum was around 1974/5, from the known seaice extend, starting Oct. 1978, the maximum was in March 1979 with 16.635 and highest since then (before, we had no data)
Aug. 2010 AMO was ’til now on it’s max level, but not decreasing, following monthly means. In so far is the question about the starting year of the decrease of AMO index and the increase of seaice extend.
“in close sync”, Vuk, for ‘synchronization’. (Stupid autocorrect) And Griff has the advantage of absolute certainty, whatever the facts.
Thanks, “sync”, indeed, I didn’t notice it till now, although I did read it before hitting the ‘Post’ button. It has happened to me many times before, the consequence of my brain’s ‘excessive’ cognitive bias, i.e, not spotting my own errors.
While at it, in my next comment it should be: “in its 40 year long record”
The bears…the bears…it’s always about the bears….what about the seals? Here comes the Walrus…..
The walrus are frankly worse affected than the bears..
Are they ?
Evidence ?
Well they have the normal choices adapt, go extinct or only be found in zoo’s.
griff, as usual, you ignore Antarctica because the ice there is well above average….apparently global warming must ignore Antarctica too? Maybe some of the poor bears should be transported down under? The ice conditions in the Arctic are about the same as a century ago. The Arctic ice is mostly above water as opposed to the Antarctic being mostly ice over land…makes a big difference in combination with the surrounding seas.
If Antactica is of griffs interest, he would have mentioned penguins 😀
“the ice there is well above average”
No, its at about the 2010s average.
It is above the 15 year average.
Antarctic has been COOLING over the longer time period
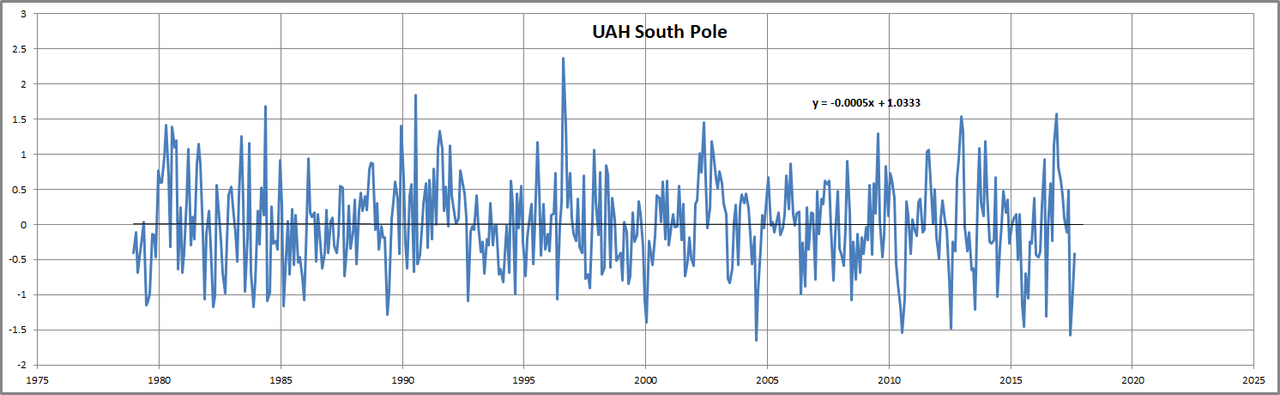
And has zero measured warming in the satellite era.
Global sea-ice is now at least 3σ below your 15 year average.
We know the Arctic has RECOVERED a bit from the extreme levels of the late 1970s.
What is your point ? You agreed this was GREAT NEWS for Arctic sea life.
Life in the Arctic is bouncing back because there is now some food in the oceans and they are not perpetually covered in sea ice.
Do you HATE life as much as griff does ??
Are you trying to prove you are as ignorant as griff is?
There are more bears BECAUSE there are more seals.
Seals and bears are like humans, they love warmer temps, they can survive cold periods just like us, but it’s not optimal for them.
Someday I will read a post from you where you finally grasp that your religious beliefs have lead you wrong
I want you to be careful as collapsing such beliefs can cause such dissonance as to lead to murderous or suicidal tendencies.
It’s rough to discover you’ve been lied to your entire life.
PS, there is no Santa Claus either, the bears are him and all the elves
Griff defies facts and science again. Even the WWF says they’re doing just dandy, an enormous conservation success story after hunting to the brink in the 1950s.
“The walrus are frankly worse affected than the bears..”
More utter BS from griff. When do his fabricated LIES stop ?
Lesser sea ice means more seas. more sea life.
Even species on the edge of extinction have started to return because of that increased food supply
https://partner.sciencenorway.no/arctic-ocean-forskningno-fram-centre/the-ice-retreats–whale-food-returns/1401824
The arctic sea ice, far from ‘growing steadily’ is at the lowest for this date in the record. It is startlingly low across Siberian seas, where in most of the area the ice hasn’t grown at all.
Really, this whole post is a shameful piece of nonsense.
https://forum.arctic-sea-ice.net/index.php?action=dlattach;topic=2975.0;attach=288900;image
https://forum.arctic-sea-ice.net/index.php?action=dlattach;topic=2975.0;attach=288880;image
Your disk has a fissure…..
But Griff,
In an earlier post you had graciously informed us ignorant fools that there was Less Sea ice some 13,000 years ago
And if you want to look at the numerous proxies showing sea ice extent etc, you would have to go back to the point where the seasonally ice free Arctic starting freezing over again some 13,000 years ago to find a situation with less ice.
Griff,
as usual you leave out at least 50% of the evidence, you continue to ignore the evidence that Polar Bears populations are NOT suffering from decreased ice cover.
You ignore evidence of far lower sea ice cover values from the early interglacial period, from a number of posted science research you were given, you also fail to show why having no summer sea ice cover should be a concern to the planet.
The Polar Bear and Sea Lion population are much higher today, than 1990, you ignore this reality over and over in your obsession over sea ice cover data.
I am here concerned with the misrepresentation of the current freezing season.
The extent graphs clearly show no such thing as ‘steady growth’
Buy you some spectacles to look at the records to realise you are completely wrong, as usual.
9	13	3.709	#NV	3.709	-36

9	14	3.745	#NV	#NV	36

9	15	3.743	#NV	#NV	-2

9	16	3.774	#NV	#NV	31

9	17	3.810	#NV	#NV	36

9	18	3.826	#NV	#NV	16

9	19	3.801	#NV	#NV	-25

9	20	3.853	#NV	#NV	52

9	21	3.899	#NV	#NV	46

9	22	3.994	#NV	#NV	95

9	23	4.057	#NV	#NV	63

9	24	4.118	#NV	#NV	61

9	25	4.147	#NV	#NV	29

9	26	4.195	#NV	#NV	48

9	27	4.195	#NV	#NV	0

9	28	4.254	#NV	#NV	59

9	29	4.274	#NV	#NV	20

9	30	4.318	#NV	#NV	44

10	1	4.422	#NV	#NV	104

10	2	4.455	#NV	#NV	33

10	3	4.486	#NV	#NV	31

10	4	4.523	#NV	#NV	37

10	5	4.583	#NV	#NV	60

10	6	4.620	#NV	#NV	37

10	7	4.644	#NV	#NV	24

10	8	4.662	#NV	#NV	18

10	9	4.689	#NV	#NV	27

10	10	4.803	#NV	#NV	114

10	11	4.911	#NV	#NV	108

10	12	4.961	#NV	#NV	50

10	13	5.079	#NV	#NV	118

10	14	5.115	#NV	#NV	36

10	15	5.166	#NV	#NV	51

10	16	5.218	#NV	#NV	52

10	17	5.261	#NV	#NV	43
Growing slowly rather than steadily, currently lowest for the date in the satellite record. Likely will be lowest by about 1 million sq km over the second by next week.
No you’re not, you’ve made lots of assertions about other things.
And you still persist with the notion that ice is a metric of doom.
And anyway, the ice volume is growing at the same rate as last year (DMI).
“I am here concerned with the misrepresentation of the current freezing season.’
And we are concerned about your blatant LIES and misinformation of using such a short period of time after an extreme anomalous high in the 1970s.
You are not the least concerned about facing facts.
Even you must know by now that current level of sea ice are a LONG WAY ABOVE what they have been for most of the last 10,000 years
Or will you go into that manic state of climate denial your little mind has to live with.
Griff,
You really have nothing to offer beyond the “sea ice level is really low” whine.
The Polar Bears don’t seem to miss it, but it sure bothers you so much who lives in England,, a few THOUSAND miles away…that was nearly covered over by glaciers not so long ago.
You have been asked many times to show why low sea ice level is bad for the region or the planet, you have completely ignored this question over and over.
You run a company harvesting Arctic Sea Ice, which is why you are distressed to see your business melting away?
PS
This time of year, what are you believing is ice doing ? Right, it’s growing, day by day, skm by skm, one day more, othrt day not so much, ergo growing steadily, nothing wrong with that. 😀
Glaciers are static or growing in Norway
https://notrickszone.com/2020/10/18/norway-glaciers-show-surprisingly-small-retreat-during-2020-nigardsbreen-glacier-actually-grew/
The biggest glacier in Greenland, Jacobshavn, has been advancing since 2016, as the local sea (Disko bay) cools.
https://climate.nasa.gov/news/2882/jakobshavn-glacier-grows-for-third-straight-year/
Are these non-warming trends consistent with OMG warming in the Arctic? No they aren’t. Your story is very well crafted but like melting ice, it has way too many holes.
And if the oceanic cooling in the North Atlantic “warming hole” can’t be magicked away even by Josh Willis, then it must be pretty substantial:
https://www.google.co.uk/amp/s/mashable.com/article/cold-blob-atlantic-ocean-climate-change.amp
Meanwhile Antarctica and the southern oceans continue to cool. Reciprocal behaviour in the SH and NH due to heat piracy and the bipolar seesaw is not unusual of course.
https://www.nature.com/articles/s41558-018-0350-3
https://ptolemy2.wordpress.com/2020/09/12/widespread-signals-of-southern-hemisphere-ocean-cooling-as-well-as-the-amoc/
Also, the weather patterns are channeling warm mid-latitude air towards the Arctic,
This is forming a blob of warmer than normal air over northern Siberia, slowing the growth of sea ice in that region.
Thing is, that warm air is no longer available further south, as the NH heads into winter.
We also have a strong La Nina starting to form in the ENSO zone, and other oceans are starting to cool.
If you live in the NH.. time to RUG-UP !!
GREAT NEWS , hey griff.
LIFE will continue to RETURN to the Arctic after being forced away by TOO MUCH SEA ICE.
https://partner.sciencenorway.no/arctic-ocean-forskningno-fram-centre/the-ice-retreats–whale-food-returns/1401824
The Blue Mussel is also making a return, having been absent for a few thousand years, apart from a brief stint during the MWP.
https://journals.sagepub.com/doi/abs/10.1177/0959683617715701?journalCode=hola
Many other species of whale are also returning now that the sea ice extent has dropped from the extreme highs of the LIA. Whales cannot swim on ice. !
https://blog.poseidonexpeditions.com/whales-of-svalbard/
From the second link..
“Shallow marine molluscs that are today extinct close to Svalbard, because of the cold climate, are found in deposits there dating to the early Holocene. The most warmth-demanding species found, Zirfaea crispata, currently has a northern limit 1000 km farther south, indicating that August temperatures on Svalbard were 6°C warmer at around 10.2–9.2 cal. ka BP, when this species lived there. The blue mussel, Mytilus edulis, returned to Svalbard in 2004 following recent warming, and after almost 4000 years of absence, excluding a short re-appearance during the Medieval Warm Period 900 years ago.
Arctic is so much COOLER than it was for most of the Holocene, which explains why there is still so much sea ice up there.
REJOICE as the Arctic comes back to life.
Regarding the sea ice extent graphic above:
It’s interesting to note that the data starts at 1980. Here’s a collage of Northern Sea Ice graphs from the five IPCC Assessment reports:
It’s obvious that the start date was truncated, and it doesn’t take a genius to see that the data behind what was left has been altered over the years.
Regarding recent posts here at WUWT discussing the need for people to do their own research it looks like the results from research on this topic is like watching the old TV show, “Will the real Sea Ice Extent graph please stand up!”
The start date of seaice sat-data record was 10/26/78
1980 is only the first axis point, not identical with the first data point.
Krishna,
The early ’70s start date was good enough for the first three assessment reports, but ten years on, in the fourth report it was apparently decided that the public shouldn’t see what that data said. Consistency of the sensors was cited by the censors.
From the IPCC’s AR4 report you will find in Chapter 4 pages 350-351 These passages:
The most complete record of sea ice extent is provided by passive microwave data from satellites that are available since the early 1970s.
…
Most analyses of variability and trend in ice extent using the satellite record have focussed [sic] on the period after 1978 when the satellite sensors have been relatively constant.
…
As an example, an updated version of the analysis done by Comiso (2003), spanning the period from November 1978 through December 2005, is shown in Figure 4.8.
That the start date was changed is a matter of fact, why it was changed is matter of opinion i.e., sensors or censors.
Nice, to bad that true for most of the data in the climate change handbook. Whats true today won’t be tomorrow.
And of course DOE data from the 1920’s still exists..
“And if you want to look at the numerous proxies showing sea ice extent etc, you would have to go back to the point where the seasonally ice free Arctic starting freezing over again some 13,000 years ago to find a situation with less ice.”
13,000 years ago?
…………you can phone a friend if you want.
In 2007, Professor Wieslaw Maslowski told an American Geophysical Union meeting that previous projections had underestimated the processes now driving ice loss.
Using supercomputers to crunch through possible future outcomes has become a standard part of climate science in recent years.
“We use a high-resolution regional model for the Arctic Ocean and sea ice forced with realistic atmospheric data. This way, we get much more realistic forcing, from above by the atmosphere and from the bottom by the ocean.”
“Our projection of 2013 for the removal of ice in summer is not accounting for the last two minima, in 2005 and 2007,” the researcher from the Naval Postgraduate School, Monterey, California, explained to the BBC.
“So given that fact, you can argue that may be our projection of 2013 is already too conservative.”
Former US Vice President Al Gore cited Professor Maslowski’s analysis in his acceptance speech at the Nobel Peace Prize ceremony in Oslo.
“13,000 years ago? ”
The world was in the grips of a full on ice age.
Griff is so dumb. Wires not just crossed, but totally scrambled.
But Griff,
In an earlier post you had graciously informed us ignorant fools that there was Less Sea ice some 13,000 years ago
And if you want to look at the numerous proxies showing sea ice extent etc, you would have to go back to the point where the seasonally ice free Arctic starting freezing over again some 13,000 years ago to find a situation with less ice.
Griff: And if you want to look at the numerous proxies showing sea ice extent etc, you would have to go back to the point where the seasonally ice free Arctic starting freezing over again some 13,000 years ago to find a situation with less ice.
This is an egregious falsehood. It shows contempt for palaeoclimatology that is a trademark of climate alarmism.
Arctic ice extent has been less than now for most of the Holocene. The criminally fraudulent PAGES2K enterprise have failed in their mission to conceal and obscure this fact and to destroy Holocene palaeo-climatology in general.
At or near the Holocene optimum 7-8kya the Arctic was seasonally ice free:
https://onlinelibrary.wiley.com/doi/abs/10.1111/j.1502-3885.2001.tb00984.x
Ocean SSTs have been cooling steadily from the Holocene optimum 10,000 years ago till now. Since sea temperatures govern Arctic ice melt, this makes it clear that Arctic sea ice has reciprocally risen sharply between the Holocene as SSTs have fallen.
https://www.nature.com/articles/ngeo2510
10,000 years ago, the Arctic Ocean’s bottom water temperatures were 6-10°C warmer than they are today:
https://journals.sagepub.com/doi/10.1177/0959683615580861
These two studies also show that Global ocean temperatures were still warmer than today througout nearly all of the last 10,000 years:
https://www.sciencedirect.com/science/article/abs/pii/S0277379116304802
https://science.sciencemag.org/content/363/6422/70
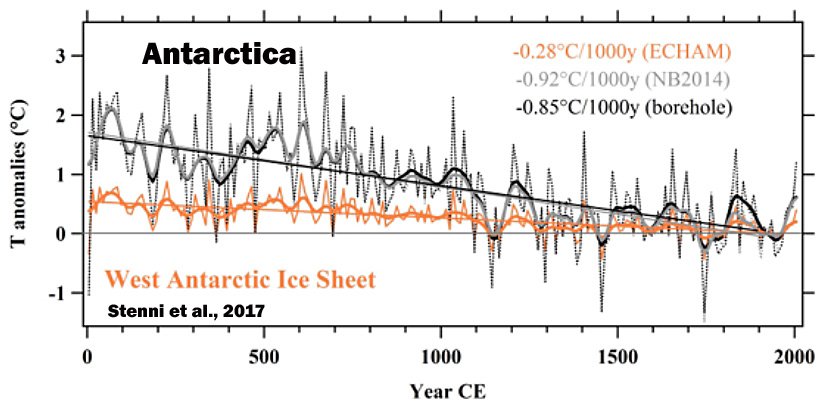
Meanwhile down under, between 12,000 and 1-2,000 years ago East Antarctica was 5 or more degrees warmer than today – that’s a lot.
https://tc.copernicus.org/preprints/tc-2020-241/tc-2020-241.pdf
So PAGES 2k will now cook up another 10 “studies” that show zero difference, average them all together, so that then the Antarctic temperature in the early/mid Holocene is only 0.5, not 5 degrees warmer than now. That’s how they operate. Find dozens of very poor climate proxies that carry practically no climate signal, such as midges, pollen etc. Mix and stir-fry them all together until the real palaeo climate history found in the high quality ice core and sediment isotope records – maybe some speleothems also – is diluted down to nothing. Nice trick. You could call it palaeoclimate Homeopathy.
(You know what I’m talking about don’t you Griff? Steve MacIntyre knows as well.)
Phil,
me and fred250 told a lot of what you posted here to griff at a couple other places the last 2-3 years he has been blabbing about sea ice., he ignores it most of the time, never acknowledge and doesn’t change one bit, he will NEVER change because he is dishonest to the extreme.
He will ignore everything you wrote because he is an idiot.
By the way nice post!
But ya have to keep posting the facts to counter his deliberate LIES and cherry-picked mis-information.
That way more and more people become aware that he is totally full of BS !!
And more and more people become aware of REALITY.
He is one of the realist’s best weapons, and is just too dumb to realise it.
Arctic temps, hence sea ice are driven by the AMO and PDO.
The only Arctic warming this century has come from the 2015 El Nino, effect now nearly gone
Between 1980 and 1995, the Arctic actually COOLED. (then a step at the 1998 El Nino.)
Well to be fair to Griff with the tsunamis we could be doomed like we were in 1958 and 2015-
https://www.msn.com/en-au/news/techandscience/ice-melt-in-alaska-threatens-to-unleash-unprecedented-mega-tsunami-scientists-warn/ar-BB1aa6e0
I was a survivor of the 58 tsunami as it reverberated around the world and finally threatened Adelaide-
http://www.adelaiderememberwhen.com.au/adelaides-tidal-wave-the-one-that-never-happened/