This new paper raises some questions about the role of total solar irradiance (TSI) and global warming. OTOH hand its all computer modeling, so take it with a grain of salt. h/t to Dr. Leif Svalgaard.
- The role of solar forcing in global warning is unclear due to the uncertainty in the change in TSI since the Maunder minimum.
- The TSI level of the Sun when it is in its least active state is established from an advanced model of TSI variability.
- This lower limit on grand minima TSI truncates the current range of the possible change in TSI since the Maunder minimum by more than half.
Abstract
How the solar electromagnetic energy entering the Earth’s atmosphere varied since pre industrial times is an important consideration in the climate change debate. Detrimental to this debate, estimates of the change in total solar irradiance (TSI) since the Maunder minimum, an extended period of weak solar activity preceding the industrial revolution, differ markedly, ranging from a drop of 0.75 W m−2
to a rise of 6.3 W m−2.
Consequently, the exact contribution by solar forcing to the rise in global temperatures over the past centuries remains inconclusive. Adopting a novel approach based on state-of23 the-art solar imagery and numerical simulations, we establish the TSI level of the Sun when it is in its least active state to be 2.0±0.7 W m−2 below the 2019 level. This means TSI could not have risen since the Maunder minimum by more than this amount, thus restricting the possible role of solar forcing in global warming.
Plain Language Summary
How the amount of energy the Earth receives from the Sun varied since pre-industrial times is an important consideration in the climate change debate. Detrimental to this debate, it is not known whether the Sun grew brighter or dimmer since the 16th century, and by how much. As a consequence, the exact contribution by fluctuations in the brightness of the Sun to the rise in global temperatures over the past centuries remains controversial. It is established that the Sun was particularly inactive over much of the 16th century. Adopting a novel approach based on state-of-the-art solar imagery and computer models, we determined the brightness of the Sun when it is in its least active state possible. This places a strict limit on how much the Sun could have grown brighter since the lull in solar activity over the 16th century, restricting the possible role the Sun could have played in global warming.
The paper:
So why would the quantum of the fall in TSI today’s minimum place a limit on the fall during the Maunder Minimum. What if the underlying rate of fusion reactivity was lower then compared to today
Again, we also get energy from the Sun via the solar wind and Coronal Mass Ejections. It isn’t just light in varying frequencies and intensities. The solar wind and CME’s affect the Earth in many ways. Why are “climate scientists” so myopic? My forecast is the study of this will become a major part of climate science and meteorology in the coming years as more and more becomes known about the influences.
It’s that hot, yellow ting in the sky that controls global temp. Whodathunkit?
The solar output/planet’s energy input is a periodical variable with number of periodicities; in addition there are other global periodicities sometime in the phase and sometime in a counter phase with the solar variability. Effect on the s.c. global temperature is a total sum of all contributing to the rise or fall in the temperature at any point in time.
So what might be effect of another ‘Grand Minimum’ that some solar researchers predict in the near future?
Well, it depends on time of its (Grand Minimum) occurrence (if at all) as I considered in this link
http://www.vukcevic.co.uk/NH-GM.htm
Not making sense to me. Maunder minumum characterised by low sunspot number, 2019 characterised by low sunspot number, why does 2019 set a limit on increase since Maunder. Need to read the paper I guess.
Should we be talking about the 17th century when Galileo & his contemporaries recorded high sunspot numbers initially before they seemed to disappear half way through that century and on into the early 1700’s?
Because of the elliptical orbit ISR swings 90 W/m^2 from perihelion to aphelion.
Because of the elliptical orbit any given point ToA sees a 700 W/m^2 swing in solar intensity from summer to winter.
The albedo varies from 60% at the north pole (820 W/m^2), 12% at the equator (164.2 W/m^2) to 75% at the south pole (1,026 W/m^2). (www.climatedata.info)
Lief’s range of -1.72 to + 6.3 W/m^2 is noise in the data, inconsequential.
What happens when you have a Grand Minimum during the cold/glacial phase of a Milankovich Cycle? What happens when continental drift totally disrupts established ocean currents? What happens….? It seems to me that either: the whole climate change factors are too chaotic to correctly correlate all of the interactions and come up with reasonable predictions, or I’m too dimwitted to understand any of this. Possible Clue: the friends I play golf with ask me to tee off first, as they say I’m not smart enough to be nervous. I have no idea what that means.
So they are apparently saying:
“We built a model of the sun. We have no idea if it’s complete or accurate but it gives us the answers we want. It proves the Sun has no involvement in Global Temperatures. So nayyyyy!”
I believe they can model the Sun about as well as they can model global climate, although the Sun is likely more complex still.
TSI really is another worthless measurement. One must understand the interactions of each range of electromagnetic waves on various layers of Earth’s atmosphere – each may be interdependent and maybe even at odds with the other. And as already mentioned, the Sun impacts the Earth by using more than just EM waves. Until you untangle all of these complex interactions, you cannot hope to understand how much the Sun impacts our climate over and above keeping the Earth warm. All one can do is draw simple correlations.
The fundamental difference between a star and a planet is scale. The Earth is an infrared star. The moon is a microwave star.
Neglecting this truth leads to absurdities, such as the greenhouse effect.
Does solar energy in & out tell you what the target’s natural temperature is?
“This means TSI could not have risen since the Maunder minimum by more than this amount, thus restricting the possible role of solar forcing in global warming.”
Pffft. Non sequitur alert.
TSI variation is ONE avenue by which solar variation might affect climate. There is also UV shift (affecting atmospheric chemistry), and variation in the solar wind (affecting GCR).
All of these would be “solar forcing,” driven by variation in solar activity.
I downloaded the paper and searched GCR, galactic, UV and ultra. Only hits were UV twice in the titles of referenced articles so yes, they are simply pretending that these other possible avenues of solar forcing do not exist.
Radically unscientific.
My sun-climate system works within a strict TSI range first established by Leif Svalgaard, and seconded by me.
From two years ago: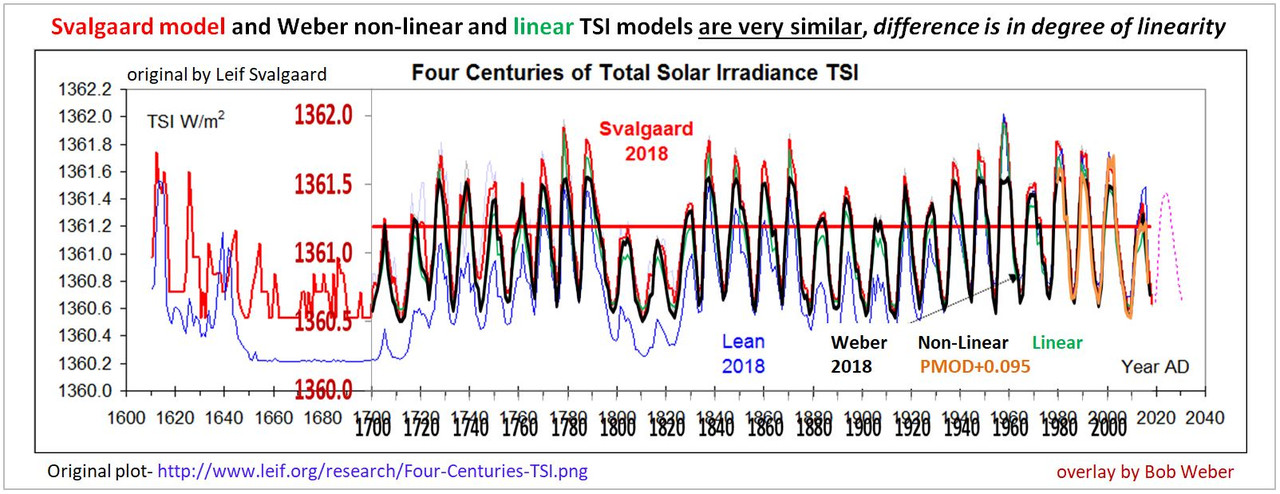
J. Lean, Greg Kopp, et al are also producing a new TSI reconstruction based on v2 SN and I’m very much looking to seeing what they come up with.
The authors of this paper think they’ve made it harder for TSI to be considered the main forcing, but they don’t realize it’s already been taken into account by me, see inset (c) – no problem:
I’ll be updating my model soon using RMIB, CDR, and other TSI datasets for comparison.
“This means TSI could not have risen since the Maunder minimum by more than this amount, thus restricting the possible role of solar forcing in global warming.”
Again as has been said many times, TSI as the promoted end story on the role of solar forcing is likely not the full picture of likely influences on Earth’s energy balance. Even though it sis small part of TSI, the EUV/UV flux varies as much larger percentage than the TSI over the sun’s magnetic cycle and the deep minimums like the Maunder period.
EUV/UV is intimately related to the formation of stratospheric ozone and thus the maintenance of the stratosphere’s temperature profile characterized as a positive lapse rate (the stratospheric temperature increases with increasing altitude, compared to decreasing temp with altitude in the troposphere).
The temperature of the lower stratosphere (TLS) has been the subject of much research, and study.
https://www.climate.gov/news-features/understanding-climate/state-climate-2011-stratospheric-temperature
Dr.’s Christy and Spencer are keenly tuned into this active research area via their AMSU studies of global atmospheric temperature and maintenance of the UAH atmospheric temperature data sets. (After Mears fiddled with his RSS adjustment as few years back in a blatant political response to Senator Cruz, the RSS data is no longer trustworthy IMO.) We know the TLS has decreased over the period since active satellite monitoring began via continuous microwave soundings, and even more so from radiosonde profiling data since the late 1950’s. (see graph in link above)
During the satellite MSU/AMSU period the troposphere has unquestionably warmed (ignoring the 2 big volcano events Pinatubo-91 and El Chichon-82). Meanwhile TLS has declined by over 1.5º C during the 50 years from 1960 to 2010. From Dr Spencer’s latest UAH update, the TLS Global trend since 1979 to present is -0.28º C/decade. Interestingly, the past three month’s anomaly readings in the UAH TLS have all been below -0.75º C (-0.79, -0.76, -0.76). The last time the TLS did this kind of summer dip (coincidentally?) was the rapid transition of ENSO states in June-July-August 2016 aligning with a rapid swing from the ending 15-16 whopper El Nino to La Nina equatorial Pacific states. And the UAH monthly anomaly of the lower troposphere during that 2016-2018 period declined about -0.2 C.
http://www.drroyspencer.com
The point of the above discussion is to point out that the stratospheric temperature profile and its declining anomaly is intimately linked to what establishes the stratosphere’s lapse rate — ozone. Stratospheric Ozone (thankfully) absorbs (thankfully) all of the EUV and most of the most harmful UV. This absorption of EUV/UV is what controls the stratosphere’s temperature profile. Quoting from the Wiki entry on this non-controversial subject, “The rapid photolysis and reformation of ozone heats the stratosphere resulting in a temperature inversion.”
https://en.wikipedia.org/wiki/Stratosphere#Ozone_and_temperature
So with the sun still apparently entrench in a new minimum like behavior the last several months, and the building La Nina in the equatorial Pacific, we are set to see another major drop in the temperature anomalies of the troposphere which are going to greatly challenge the IPCC and their CMIP6 models about the time they release their AR6 in a cooling planet background.
So TSI is far from the full picture on what is warming and cooling our atmosphere. Some may argue the this a tail wagging the dog comparison, but I’d say, as dog owner, most dogs like to chase their tails when bored. The troposphere similarly may have to chase the stratosphere, and get colder here where we live (the lower troposphere) very soon.
“Adopting a novel approach based on state-of23 the-art solar imagery and numerical simulations, we establish the TSI level of the Sun when it is in its least active state”
How can establishing a modern low point in TSI establish any kind of minimum on past TSI? The Sun spot count is not a direct thermometer, just a hint of what’s going on. One could have the variation of Sun spots, on top of a wave action of other internal processes, and then throw in external processes that may be independent or coupled to the Sun, for even more fun in the Climate Wars.
I don’t know why they are studying the sun. It is settled science, the sun has noting to do with the climate on earth. Nothing. Only CO2 affects the climate. CO2 is the only variable. It is Settled science. Why are these clowns being given any money to study something that is believed by a consensus.
OT, looks like Germany has overtaken Denmark on electricity costs.
https://notrickszone.com/2020/10/06/german-electricity-prices-soar-now-most-expensive-in-europe-taxes-green-surcharges-make-up-53-6-of-price/
Here is more research that shows CO2 change follows temperature change:
https://tinyurl.com/y4zso26m
Although the current “dead sun” reflects transition from 11-year Sunspot Cycle 24 to 25, odds are that Sol is entering a 90-year Super-Grand Solar Minimum through c. AD 2110. Meantime, though total solar irradiance (TSI) indeed is Earth’s primary global atmospheric surface temperature (GAST) determinant, this obtains at several astro-geophysical removes.
As climatologists Henrik Svensmark and Valentina Zharkova have demonstrated from 2007, TSI drives any star-system’s solar magnetic fields (SMFs), whose fluctuations enable cosmic radiation to penetrate Earth’s magnetospheric sheath, seeding global cloud-cover whose overcast governs GAST’s episodic rise or fall. Contributing factors include Earth’s orbital inclination and equinoctial precession, meteor strikes, mountain-range orogenies, and regional volcansism.
True enough… but from Earth’s Neoproterozoic Ediacaran Period 635 mm YBP to the Cenozoic/Tertiary’s late Pliocene some 3.6 mm YBP, our planet experienced no pre-Cambrian or Phanerozoic glaciations. Given subsequent Pleistocene Ice Ages averaging 102 kiloyears, interspersed with interstadial remissions of median 12,250 years, latterday climate cycles thus combine cosmic radiation, SMFs and TSI, with continental plate-tectonic dispositions. Walling off Eastern from Western hemispheres, conjoined North and South American landmasses block circulating atmospheric/oceanic circulation patterns.
As for Luddite sociopaths’ ‘postulated “greenhouse gas” (CO2) emissions due to fossil fuels (sic), Earth’s 12,250-year Holocene Interglacial Epoch ended with a 500-year Little Ice Age in AD 1350, while global temperatures have trended lower over 3½ millennia from New Kingdom Pharaonic times. On this empirical basis, Australian Roberts Holmes’ 2017 “Mean Molar Mass version of the Ideal Gas Law” equates any –repeat, any– planet’s Temperature T = PM/Rp, where P = Atmospheric Pressure times M = Mean Molar Mass over R = Atmospheric Density times Gas Constant p.
As serial refutations cumulate –recent ‘”corrections” acknowledge that ” every past carbon budget finding has been violently discounted”– AGW’s fatuous shills professing otherwise are either studiously ignorant, willful frauds, or just mendacious fools.
“The dimmest state…….”
In Australia, would be South Australia..
In the USA… is obviously California. ! (except in bush fire season)
The Maunder Minimum was between 1650 and 1700, that is not the 16th but the 17th century.
TSI variation may be small or inconsequential but over 400 years other factors play a part.
Does the earth’s orbit vary for any reason in this time frame, very unlikely but needs to be considered even of only to eliminate any additive inconsequential effect.
Cloud cover, are there any effects that cause increasing cloud cover at the solar minimum ?
Would negative feedbacks then cause a consequential effect?
OTOH hand its all computer modeling, so take it with a grain of salt
I prefer not to take it at all. If they propose empirical tests against their speculation they OK – I’ll at least read it. But if they’re just speculating (modeling), so have an untestable hypothesis, then why should we waste our time reading it?
How cute! They have lost track of the assumptions they’ve made for that to be true, making it turtles on top of turtles.
The first and foremost assumption and the biggest mistake many intelligent people make is that most of the energy for the variability of solar forcing on climate comes from the small changes in TSI, and therefore solar variability forcing of climate MUST be small. BIG ASSUMPTION that we know is WRONG.
It has been demonstrated several times and it is relatively easy to check oneself (I’ve done it), that the speed of rotation of the Earth changes with solar activity. There is a semi-annual component in the speed of rotation that depends on the solar cycle:
Le Mouël, Jean‐Louis, et al. “Solar forcing of the semi‐annual variation of length‐of‐day.” Geophysical Research Letters 37.15 (2010).
How much energy does it take to change the speed of rotation of the Earth in a solar activity-dependent manner? And who provides that energy? The answer to the second question is obviously the Earth. It is the Earth that changes its rotation speed in response to solar activity, and not the change in TSI that causes it.
Therefore we DO KNOW that the climate system can and does respond to changes in solar activity in ways that are not proportional to the change in TSI. Solar activity provides the initial signal and direction, and the climate system provides the required energy and mechanisms.
Since the fundamental assumption of the paper, that the effect of solar activity on climate is directly due to the change in TSI, is wrong, then the conclusions of the paper are wrong regardless of the method used to arrive to them. That is the problem with assumptions, they are not subjected to the scientific method because they are assumed from start to be true.
“state-of-the-art” is always a bad omen and a clue.
This model also “proves” it does not get colder at night.