Guest post by David Archibald
The heliospheric current sheet has flattened meaning that Solar Cycle 24 is over and we are now in Solar Cycle 25.

Figure 1: Heliospheric current sheet tilt angle 1976 -2020
The solar cycle isn’t over until the heliospheric current sheet has flattened. The data is provided by the Wilcox Solar Observatory at Stanford University. There were no observations from about 19 December to 5 February; so the values in between have been interpolated from the rotations before and after.

Figure 2: Heliospheric current sheet tilt angle aligned on solar cycle minimum
As measured in Carrington rotations, averaging 27.23 days, Solar Cycle 24 was of average length.

Figure 3: F10.7 flux aligned on solar minimum
On the basis of the F10.7 flux, Solar Cycle 24 was 11.1 years long – which is the average solar cycle length.

Figure 4: Ap Index 1932 – 2020
What this figure shows is that there has been a permanent shift down in the Sun’s magnetic flux into the New Cold Period. The breakover was most probably in 2005 when the Ap Index suddenly dropped to solar-minimum type levels just above the Modern Warm Period activity floor. Then there was another sudden break down in 2008 with the absolute low in 2009.

Figure 5: F10.7 Flux and Ap Index 1964 – 2020
More than anything else, it is the variation in the Sun’s magnetic flux that changes the Earth’s climate on decadal time scales. Higher magnetic flux pushes cosmic rays away from the inner planets of the solar system. The Ap Index averaged 13.6 from 1964 to the end of Solar Cycle 24. It averaged 8.1 over Solar Cycle 24. If the 11 year lag in terrestrial response to solar input holds, then the much-anticipated solar-driven cooling should start now.

Figure 6: Hemispheric aunspot area and F10.7 flux 1985 – 2020
As Figure 6 show, the F10.7 flux equates to the sunspot area of the Sun.

Figure 7: Sunspot Area 1874 – 2020
The change in character from the Little Ice Age to the Modern Warm Period is quite evident in the hemispheric sunspot area data. Apart from the much lower amplitude, there was far more asymmetry between the northern and southern solar hemispheres in the Little Ice Age than in the Modern Warm Period. Solar Cycle 24 returned to the sunspot area amplitudes of the late Little Ice Age and has north-south asymmetry similar to that of Solar Cycle 12 from 1878 to 1890.

Figure 8: Oulu Neutron Count 1964 – 2020
Now that the solar minimum is in, the peak in neutron count should be one year from now. The amplitude of the peak is likely to be close to the amplitude of the 23/24 minimum.

Figure 9: F10.7 flux and Oulu neutron count
As with Figure 5, this figure shows the result of the sudden step down of the Sun’s magnetic activity in 2005. The Sun has entered a new regime of activity with the New Cold Period.

Figure 10: Solar polar field strength 1975 – 2020
This figure is from the Wilcox Solar Observatory. The solar polar field strength at solar minimum is the most accurate predictor of the amplitude of the following solar cycle. Figure 10 indicates that the amplitude of Solar Cycle 25 will be close to that of Solar Cycle 24. The New Cold Period continues.
David Archibald is the author of The Anticancer Garden in Australia
There is a large asymmetry of activity in both solar hemispheres. This asymmetry will significantly reduce the total solar activity.
The northern polar field changed polarity first in June 2012, then weakened and was near neutral in April 2014. The southern polar field reversed in July 2013. During the previous similar polarity reversal in 1989-1991 the northern polar field reversed 14 months prior to the southern polar field reversal.
As of March 2020 the strength of the polar fields hints at a cycle 25 with a magnitude somewhere between those of cycles 23 and 24. The northern polar field may have peaked in late 2019 while the southern polar field reached its peak in November 2015.
https://solen.info/solar/polarfields/polar.html
http://wso.stanford.edu/gifs/north.gif
http://wso.stanford.edu/gifs/south.gif
Reaching maximum by solar polar fields means the beginning of a new solar cycle.
Thanks Ren.
The monthly average of 6808 neutron counts in Oulu means the same level of galactic radiation as in 2009.
https://cosmicrays.oulu.fi/
The highest level of GCR was recorded at the turn of 2009 and 2010.

let us go back to some basic thinking about the 0.6K that was added (by the sun) to the oceans over the past 60 years.
http://www.woodfortrees.org/plot/hadsst3gl/from:1960/plot/hadsst3nh/from:1960/plot/hadsst3sh/from:1960/plot/hadsst3gl/from:1960/trend
I want to establish if you agree with me on this:
Assume we have a 1000m column of water exactly 1 m2
That is 10^6 kg/m2
To heat one gram by 1 degree K you need 4.18 J
so for 0.6K we need 2.51 10^9 J/m2 (for the whole column)
This energy arrived over 60 years. That is 1.89 x 10^9 seconds. Assuming linearity, that gives us 1.32 W/m2.
Note that the surface of earth is 70% water.
So the answer to our problem about the amount of heat which we know is specifically not coming from ‘GH gases”: about 1 W/m2 of warming. This is natural warming, I would say. Unless, it is because we destroyed some of our ozone layer, which could have been the cause of some more UV (heat) coming through our atmosphere, landing in the ocean and subsequently causing more warming.
Agree?
Note the growing differences in sea surface temperature anomalies in the Northern and Southern Hemispheres since around 2003.
http://www.woodfortrees.org/plot/hadsst3nh/from:2000/plot/hadsst3sh/from:2000
I think the SSTA differences in the southern and northern hemispheres are the result of a much stronger winter southern polar vortex than the northern polar vortex.
Between 1970 and 2000, SST anomalies in the southern hemisphere increased, indicating a strong polar vortex in the northern hemisphere. The cyclical change in the strength of the northern polar vortex can be seen.
http://www.woodfortrees.org/plot/hadsst3nh/from:1960/to:2000/plot/hadsst3sh/from:1960/to:2000
Suface temperatures between the Arctic and Antarctic diverge during warm periods such as the MWP and Present and converge during cold periods such as the LIA.
https://imgur.com/8JdJArr
Ren, I have a paper for you. I need your email address. erlathapps.com.au
You are right to focus on the ocean in the southern hemisphere and the stratosphere when looking for the solar connection.
are you suggesting that the water continually warms?
If so this is obviously incorrect since temperatures have not continually increased since the last ice age. The oceans loose heat at roughly the same rate as they gain heat for stable temperature. If the oceans are warming then the heat input has increased (not so) or the rate of loss has decreased.
ghalfrunt
Exactly. But now, which is it? Did we get more energy from the sun [mostly UV, I would think] or was it, somehow, the extra CO2 in the atmosphere causing a decrease in the loss of energy?
Can you tell me?
Any idea what % of the tsi is created by UV?
from this doc fig 1
https://www.hindawi.com/journals/jas/2013/368380/
TSI is 1361 w/sqm
UV is 0.022 w/sqm
Is uv likely to cause a difference in warming? I do not think so!
Fish farmers in Israel decades ago were increasing the spring warming rate of their ponds by adding a very very thin layer of oil* — see Benjamin Franklin Mont Pond for the mechanism, or if you have a literary bent Kipling’s Knights of the Joyous Adventure. Warming results from reduced mixing as wave action is reduced, reduced albedo, reduced evaporation. The layers are molecules thick.
I have seen oil/surfactant smooths in the Med, the North and South Atlantic and countless rivers and streams. I have a few very poor images of a fractured smooth from abeam Porto to Madeira which covered literally thousands of square miles. Lakes are warming at anomalous rates but no-one seems to be looking at the mechanism. Oil/surfactant pollution from towns growing on their shores seems likely to me.
Feynman says ‘first you guess.’ So that’s my guess.
I just wish someone would look.
JF
*Less than the wavelength of light so no rainbow. Just in case anyone makes that objection – again.
That is a good point. I wd add salts and acids as a possible source.
ren
ja. I noticed that as well.
Remember it happened before?
http://www.woodfortrees.org/plot/hadsst3gl/from:1850/plot/hadsst3nh/from:1850/plot/hadsst3sh/from:1850/plot/hadsst3gl/from:1850/trend
it seems cyclic.
solar? volcanic?
Henry Pool
I think that natural cycles can be weakened or strengthened by changes in solar activity, especially when this concerns the stratospheric polar vortex.
See these quotes from my updated blogpost from 2018 “The Millennial Turning Point – Solar Activity and the Coming Cooling ”
“The empirical temperature data is clear. The previous millennial cycle temperature peak was at about 990. ( see Fig 3 in the link below) The recent temperature Millennial Turning Point was about 2003/4 ( Fig 4 in link below ) which correlates with the solar millennial activity peak at 1991+/. The cycle is asymmetric with a 650 year +/- down-leg and a 350 +/- year up-leg. The suns magnetic field strength as reflected in its TSI will generally decline (modulated by other shorter term super-imposed solar activity cycles) until about 2650.
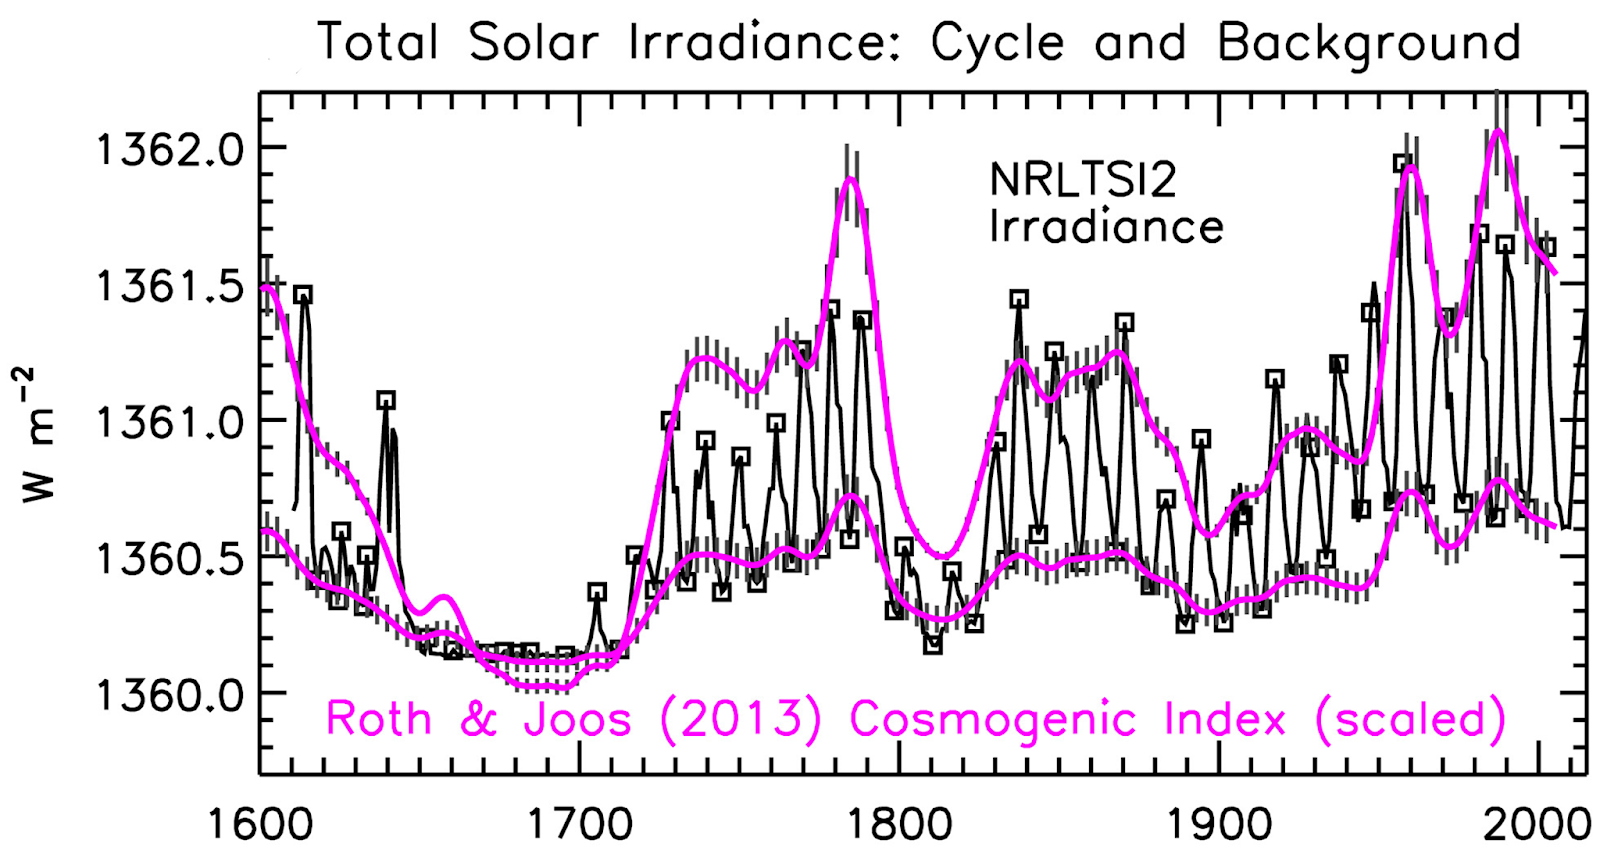
The temperature increase since about 1650 is clearly chiefly due to the up- leg in the natural solar activity millennial cycle as shown by Lean 2018 “Estimating Solar Irradiance Since 850 AD” Fig 5
…………………….Because of the thermal inertia of the oceans there is a varying lag between the solar activity MTP and the varying climate metrics. The temperature peak is about 2003/4 – lag is about 12 years. The arctic sea ice volume minimum was in 2012 +/- lag = 21 years. . For the details see data, discussion, and forecasts in Figs 3,4,5,10,11,and 12 in the links below.
See the Energy and Environment paper
The coming cooling: usefully accurate climate forecasting for policy makers.
http://journals.sagepub.com/doi/full/10.1177/0958305X16686488
and an earlier accessible blog version at
http://climatesense-norpag.blogspot.com/2017/02/the-coming-cooling-usefully-accurate_17.html See also the discussion with Professor William Happer at
http://climatesense-norpag.blogspot.com/2018/02/exchange-with-professor-happer-princeton.html
The establishment’s dangerous global warming meme, the associated IPCC series of reports ,the entire UNFCCC circus, the recent hysterical IPCC SR1.5 proposals and Nordhaus’ recent Nobel prize are founded on two basic errors in scientific judgement. First – the sample size is too small. Most IPCC model studies retrofit from the present back for only 100 – 150 years when the currently most important climate controlling, largest amplitude, solar activity cycle is millennial. This means that all climate model temperature outcomes are too hot and likely fall outside of the real future world. (See Kahneman -. Thinking Fast and Slow p 118) Second – the models make the fundamental scientific error of forecasting straight ahead beyond the Millennial Turning Point (MTP) and peak in solar activity which was reached in 1991.These errors are compounded by confirmation bias and academic consensus group think.
ghalfrunt
Exactly. But now, which is it? Did we get more energy from the sun [mostly UV, I would think] or was it, somehow, the extra CO2 in the atmosphere causing a decrease in the loss of energy?
Can you tell me?
It may not be a one or the other answer. Are you certain only CO2 in the atmosphere is the only possible source of increasing atmospheric enthalpy?
As I understand it, water vapor is the dominant”green house” gas and that CO2 is only effective if it adds to a feedback loop that increases water vapor.
If indeed additional solar energy is reaching the oceans, the increase in water vapor is expected with or without CO2.
Thoughts anyone?
Matt
it is a catch 21 ?
more UV in the oceans means more H2O (g) in the air.
More water vapor in the air means more cooling. Water vapor for the earth, acts just like sweating for people.
– Evaporating water (primarily in the tropics) cools the ocean.
– Because of density differences (water vapor is 1/3 lighter than air), it increases atmospheric convection, and thus transport throughout the atmosphere.
– Water vapor, evaporated the tropics, is then transported throughout the atmosphere, and to the top of the atmosphere where it condenses, and radiates the energy of condensation to space, unimpeded by green-house gases in the lower atmosphere.
-Because the partial pressure of water vapor increases exponentially with temperature (roughly doubles for every 10C), water vapor increasingly acts as a negative feedback loop for CO2 at temperatures much above 10 – 15 C.
Hi Mark W. Point taken in regard to bats. However, If you were to read Dr. Wickramsinghe’s post at the Cosmic Tusk From April 5th of this year), when he was interviewed by a well known biologist in England, the Dr. stressed that the source for the Corona Virus was not bats! I do think that Dr. W. knows a thing or two about viruses, as he has been studying this topic for over thirty years. Did you know also, that viruses have been found on the outside of one of the Russian Space stations? This form of virus became established in outer space in the absence of air. Also, comets do contain a huge concoction of the basic building blocks of life. Dr. W. contends that viruses are particularly prevalent at times when the solar cycle is at minima, like now, and was also the case in 19i8/19 another time of a very serious influenza outbreak occurred. Thank-you, Rod. C.
Huh. So what does this mean with respect to the expected effect on global climate? In terms a layman might comprehend.
Leif: What do you make then of Martin Mlynczak’s work at Nasa re the effects of Planetary Mechanics on Solar Plasma Fluxes. As they may govern the Planetary net Effective Energy influx? Brett Keane, NZ
Yes – and the Sun is – drumrolls – spotless. Not the slightest pimple disturbs the immaculate disc the sun now really is. That might be nice to look at but it also means that the Sun is snoozing away. Less solar activity also means less sunlight, less energy, less warmth – we are now going into a new minimum and this means less warmth and more cold. Expect really, really cold winters. Breaking all the BS models the climate-mongers have thrown on us. It’s game over folks.
Fresh out of cov-19 and a rising solar cycle will be prime opportunity to do something about the burning earth.
http://milesmathis.com/apollo.pdf
Solar Cycle 25 started in 2018?