Other data shows the USA wasn’t even close to a record.
By Anthony Watts
In a report generating substantial media attention this month, the National Oceanic and Atmospheric Administration (NOAA) claimed January 2020 was the hottest January on record. In reality, the claim relies on substantial speculation, dubious reporting methods, and a large, very suspicious, extremely warm reported heat patch covering most of Russia.
The January 2020 Climate Assessment Report, released by NOAA’s National Center for Environmental Information (NCEI), was accompanied by a map showing a giant red menace of extraordinary asserted warmth extending from the Russian border with Poland well into Siberia. Yet, the asserted hot spot appears nowhere else.
Figure 1: Map of temperature departure provided by NOAA/NCEII. Note the huge red spot over Russia.
Meanwhile, in the United States, Alaska was abnormally cold, and the contiguous United States wasn’t even close to a record.
While the media attempt to spin the NOAA announcement as more “proof” of a climate crisis, there are a few things to consider. First and foremost, January is the coldest month of the year for much of the Northern Hemisphere. You likely won’t find many people complaining that a particular January was warmer than usual. This is especially the case in Russia and Siberia.
January in Moscow is typically the coldest month of the year. Daytime high temperatures average 20°F, with average lows of 9°F. In Siberia, it is even worse. The Siberian city of Oymyakon, Russia, reached 88°F below zero (-66.67°C) in January 2018. The big red Russian “hot spot” in NOAA’s January temperature map simply shows Russia remained very, very cold, but not as excruciatingly cold as usual.
Yet, the Russian temperature data was the primary driver behind the asserted global January temperature record. This begs the question, why would Russia – and Russia alone – have such an unusual, giant red spot of unusual warmth compared to the rest of the world? Is Russia trying to influence and interfere with global climate data along with American elections?
Hardly, and the answer may be very simple and have little to do with climate change. In 2008, I identified a possible source for similarly odd reported warmth during the preceding Russian winter: Russian central-heating steam pipes.
Now before you say, “How could that possibly affect global temperature?” let’s take a closer look.
Figure 2: Steam generation plant and steam distribution pipes for central heating in the Russian village of Oymyakon Image credit: Amos Chapple via Radio Free Europe
In most of Russia, and especially in Siberia, a central power plant pipes steam via overhead pipes within towns and villages. The steam goes to radiators in homes to provide warmth during the brutally cold winters. The waste heat from these heating systems is dispersed throughout the town. Official temperatures are also measured in these same towns, meaning that waste heat raises the reported temperature above what it would normally be.
When you have much of the Russian nation using this inefficient central heating scheme, dumping huge amount of waste heat into the local atmosphere, you end up with a nationwide temperature anomaly – which might well explain the great temperature “red spot” over Russia and Siberia that appears almost every winter.
A similar effect happens in Barrow, Alaska, a town that is dependent on heating to survive the winter, just like towns in northern Russia. Science has found that Barrow has become its own Urban Heat Island (UHI) during winter. In a peer-reviewed study published in the International Journal of Climatology, “The Urban Heat Island in Winter at Barrow, Alaska,” researchers found Barrow’s urban heat island to create local temperatures an average of 3.96°F warmer that would otherwise be the case. Notably, this artificial heat signal was largest during the winter, when the indoor heating requirements for the town were greatest to compensate the cold, outside air.
It appears that the “warmest ever” January might simply have been influenced by Russian temperature data warmed up by waste heat. Maybe the U.S. House of Representatives will start an inquiry into Russian collusion to interfere with global temperature data and climate change legislation – but don’t hold your breath.
Anthony Watts (awatts@heartland.org) is a former television meteorologist and Senior Fellow for Environment and Climate for The Heartland Institute. He operates the most viewed website on climate in the world, WattsUpWithThat.com
.
Well done!
But “begging the question” is the name of the logical fallacy of assuming what one is attempting to prove. It does not mean “raising the question”, although that misuse is increasingly common. Unfortunately.
This Siberian heating system could even affect satellite observations of tropospheric thermal radiation. To combat global warming and conserve fossil fuels, Russia should be encouraged to invest in decentralized heating systems.
Much of CACA begs the question. GIGO models show what they’re programmed to find.
“But “begging the question” is the name of the logical fallacy of assuming what one is attempting to prove. It does not mean “raising the question”…”
Good spot. Although trivial with regards to the (excellent) point Anthony is making, this kind of thing does incline many people to conflate the writer’s expertise in English with their expertise in whatever subject it is they’re writing about.
Like when Mr. Middleton deploys his puerile “schist” pun. It spoils everything else in his article. Which is a shame, because many of his analyses are fantastic.
But he won’t be told…
Sigh. Perhaps David should pull out some of the other phrases that he uses among his geologist peers, and give you a good reason to be offended.
Lord knows that I could pull some from my own IT field, but Anthony would ban me for life.
With regards to Middleton, it’s not a matter of “offense”. It’s a matter of maintaining credibility amongst your target audience… which, presumably, is not people like us, who already believe that AGW alarmism is unwarranted.
If you want to persuade people that your contrarian point of view is worth considering, you don’t do this by (the verbal equivalent of) wearing a tin-foil hat and pushing a shopping cart full of incunabula.
Observer…
The validity of your criticism becomes less apparent when you couch it in hyperbolic terms.
Pots, kettles, etc…..
But Monty Python quotes are mandatory 🙂
Not everyone is as closed minded as you make yourself appear to be.
Excellent summation regarding “observer’s” puerile selfish comments.
Thanks MarkW.
Lighten-up Francis.
Mr. M needs no scolding from anyone, especially from someone who so readily gets his underwear in bundle over one silly word within his always FANTASTIC analyses.
Additionally, good job pointing out trivialities of our host’s article, but I’m not really feeling “conflated” about Anthony’s expertise…
-Talk about bullschist…
Just like you rarely tell David how good his articles are?
I do not consider use of “schist”. Frequent use of the word that schist replaces is puerile.
As is sniping with specious claims centered on your personal opinion, not facts or reality.
From Merriam Webster:
Which directly contradicts your false strawman; as “begging the question” does “raise” the question.
The misunderstanding and mis-use of this expression has now apparently gained itself a place in Merriam.
A quick search finds near unanimous support for its original meaning of a logical fallacy.
https://www.phrases.org.uk/meanings/beg-the-question.html
At least the satellites don’t measure just the towns, and use that one reading to cover 1000s of square kilometers.
Another point is that the global warming activists often complain that the satellites don’t measure the surface. This might be an instance where measuring several thousand feet up might be a good thing.
“At least the satellites don’t measure just the towns”
UAH also reported the equal warmest January in their record (equal with 2016).
Good. A whole .50 warmer. Yay. I can finally retire to Siberia in comfort!
The adjustments used by UAH are suspect. At best.
They are a lot less suspect than everybody else’s adjustments. What’s your specific problem?
There is certainly no hint of the Russia/Poland hot spot so that does support the idea that it is ground level pollution of the data.
1.) Due to the inability of very cold air to hold moisture, injecting a tiny (by tropical standards) amount of moisture at northern latitudes results in a disproportionate spike in dew points and temperature. This year has seen a pattern that poured mild and moist air west-to-east along the Siberian coast, spiking temperatures on the Siberian side of the Pole.
2.) As a side note, such a west-to-east flow in the north tends to create an east-to-west backwash to the south. If you look at the UAH map you will see below normal temperatures from China all the way to =North Africa. (White is below normal). There were record snows in Kazakhstan and northern Saudi Arabia. It should be noted at lower latitudes air is more able to hold moisture so the moisture has less of an effect on temperature.
Language evolves constantly, and these days “begging the question” is used commonly and intelligibly in the none formal way. I think it passed the acceptability threshold years ago.
“Language evolves constantly, and these days “begging the question” is used commonly and intelligibly in the none formal way. I think it passed the acceptability threshold years ago.”
————–
“Winston tastes good like a cigarette should,” eh?
Jim.
Common error does not make correct.
Language is a tool of communication.
It can only communicate accurately when it is used with precision, AND according to rules agreed to by both parties.
You do not get to use it improperly and then claim that the fault is with the hearer, if you have not first obtained his agreement to the new usage.
Yes, language does change, and there is no point opposing new usages just because they are new. But when a new usage reduces the expressive power of the language, it is worth opposing it. This one certainly does.
The expression ‘to beg the question’ used to have one clear meaning — to engage in the logical fallacy of assuming what was to be proved. It was a really useful concept in logic, mathematics, philosophy and rhetoric, and it allowed the use of a single verbal phrase where otherwise you would have to have a complicated subordinate clause every time you mentioned the concept. A significant part of my doctoral thesis, written in the early 1980s, examined which side was begging the question in a certain dispute in the Philosophy of Mind. I was able to use the phrase without explanation, confident that most potential readers would be familiar with it, and that any who were not would have no problem looking it up.
Now that ignorant people replace all verbs immediately preceding the phrase ‘the question’ with the verb ‘beg’, we have two ways of expressing all those other concepts concisely, but no way of doing so for the original one! I shudder to think what a reader in the future will make of my thesis if people don’t keep reminding others of the correct meaning of the phrase.
In Russia, the source of steam was typically waste heat from electricity generation. However, I would think that it would work better if the pipes were buried several metres down for better insulation from the soil.
Permafrost, perhaps!
The heating pipes would melt the ice, destabilise the foundations and cause subsidence, if buried!
https://www.metoffice.gov.uk/hadobs/hadcrut4/data/current/time_series/HadCRUT.4.6.0.0.monthly_ns_avg.txt
Even the HadCRUT data shows that the el Nino years 2015 and 16 had higher anomalies. And you have to suspect the UK is fudging that data as much as they can.
January 2015 and 2016 were both cooler in HadCRUT than Jan 2020 according to your own link. Jan 2020 is the warmest January in the HadCRUT record. Not sure where you’re coming from.
Hottest 😂 Come to england, its absolutely freezing, even today we had a little bit of sun, and now its cold enough to hurt your chest when breathing…
Greta was over here speaking the same old repetitive rubbish, she said change is coming, Hopefully its the sun and dome heat lol
I have noticed through many decades of experience that breathing becomes difficult at – 40 or so. The UK must be suffering exceptional cold!
It depends on the person and the humidity too.
Weather’s blooming horrible here today, UK.
No it’s not, it’s actually still on the mild side ….
I think what he/she is experiencing is wind-chill which is not a temperature
Trust me, it’s blowing a gale and sporadically deluging.
Strange for people to think they know more about what’s outside my window than I do.
Such trust in official reports over actual reports is slightly scary.
M Courtney:
I can’t see where an actual temperature for today was stated, so there was no “actual” report given.
A “feels-like” report is not a temperature as it incorporates the effect of wind-chill on the body, which in any case is not a thermometer.
FYI: afternoon temps in England today were in the range +3 to +8C.
https://www.wetterzentrale.de/en/observations.php?map=20&model=SYNOP&var=5&time=15&h=0#mapref
BTW: I live in Lincolnshire.
C or F?
“Come to england, its absolutely freezing”
Britain had the second warmest January on record.
Not sure about Britain’s second warmest January? That would put it at odds with the Central England Temperature – the longest temperature series in the World and representative of the central part of the island of Great Britain. January 2020 was the 11th equal warmest in that series and with a mean of 6,4C was 1.1C cooler than the warmest January in the record, which is 1916, with a mean temperature of 7.5C. Since 1990 there have been three warmer Januaries
You’re confusing real data, aka facts, with the narrative the warmistas are pushing on the world. In an obviously coordinated effort the Australian BOM has also mad the usual announcements to push the believers over that cliff like a bunch of lemmings.
Your reference is to a 2007 newspaper report, NOT 2020!!!
Oops, careless googling. You’re right, it was the sixth warmest.
So we better decimate society and make it colder, right Nick? You believe we should make it colder and that we can through legislation and control, right Nick? Fool.
We shouldn’t be so sure of our statements on which supposed record is broken until the Oz Bureau Of Manipulation rearranges today’s temperatures in 40 or 50 years time.
CET says 14th, tied with 1736 and 1835, hardly worrying is it.
The Met Office doesn’t use a consistent set of data or any transparent method for the whole of the country, and switches between different sets of records to suit its agenda. The CET is the only remotely scientifically rigorous measure.
Going further back, does Pepys really need another outing:-
Monday 21 January 1660/61
“It is strange what weather we have had all this winter; no cold at all; but the ways are dusty, and the flyes fly up and down, and the rose-bushes are full of leaves, such a time of the year as was never known in this world before here.”
There is nothing unusual about the current climate or any unnaturally fast variation, as I’m sure you know in your heart.
On the other hand, in my opinion it has been unusually mild in Russia, and I wouldn’t be surprised if it was one of the mildest there in recent years (still icy cold though).
Nick, I don’t get why you linked to a Jan 2007 story, saying that the (then current) month was the warmest average after 1921.
?
Noted above – an error. It was only the sixth warmest. Still not “absolutely freezing”.
Nick knows full well that South Australia had one if it’s coldest Summers on record. December may have been hot but January and February were extremely mild
“South Australia had one if it’s coldest Summers on record.”
Said with no backing, and as so often then, just not true. Max temperatures for SA are plotted here. 2018/9 was record high; 2019/20 was fourth highest in the record. On daily mean temp, it was fifth highest.
Or if you prefer Adelaine data, December was very hot; average max (West T^errace/a>) was 30.6°C vs normal 26.9°C. January was about average, at 28.7°C vs normal 28.6. Only February was cooler than average, at 26.4°C vs average 28.6.
Follow the detail in Nicks link of the source of the data and you end up here
http://www.bom.gov.au/climate/data/acorn-sat/
It’s acorn 2 data.
Anyone got a link to the older product acorn1 or even raw.
I would like to see the same chart without the acorn2 adjustments.
“Anyone got a link to the older product acorn1 or even raw.”
The Adelaide data is AWS, straight from the instrument.
Does anyone have anything to support the original claim that “South Australia had one of it’s coldest Summers on record”?
“ … Does anyone have anything to support the original claim that “South Australia had one of it’s coldest Summers on record”? …”
—
Don’t know about the whole Summer, I don’t live there, but SA did have one of the coldest mid-Summer days on record in January:
https://www.weatherzone.com.au/news/adelaide-almost-registers-coldest-january-day-on-record/530835
Equally do you have anything to support that it was in the normal range?
Good for them. Lucky people.
It was so warm in England that, according to CET, it was not even as warm as 1686!
https://www.metoffice.gov.uk/hadobs/hadcet/mly_cet_mean_sort.txt
Probably just another case of krig-yourself-hotter.
What does the UAH record show. I would believe that over land based thermometers
UAH shows joint warmest January on record globally.
The UAH temperature map for January shows a couple of warm areas including one over Russia. However, it looks nothing like the surface map shown.
https://www.nsstc.uah.edu/climate/2020/january2020/GTR_202001Jan_1.pdf
Just wondering – that map is so-called anomalies, delta-Temps, above is Temp.
Funny, above has grey “missing data” regions. The delta-Temps have no missing data.
And as Pres. Putin said they signed the Paris Accord, because of concern about entire cities on Permafrost.
Are they likely themselves to melt that, or have they other data?
And through legislation they will make it colder. IE control the weather. Idiots.
Anthony, as pointed out here, the map is of temp anomaly. As communal heating has been used since the Soviet era, wouldn’t any waste heat already show up in the climate norms and therefore not create an anomaly?
It does look quite similar if you look at the scales. The map mentioned here only goes up to part of the satellite map scale. So you can’t compare color to color without translating. Although this shifts the warm spot more to Scandinavia
It looks like there were a couple of warm areas in/near Russia and over by Scandinavia. My guess is the surface data is infilled to create the massive warm area we see in the map. As a result it far exceeds reality.
No they are not infilled as Nick Stokes shows here ….
https://moyhu.blogspot.com/p/blog-page_24.html
There are only about 2012 stations used for entire planet.
Over Russia and Siberia there are station gaps in area larger than England and Scotland put together, so of course it is infilled. The smallest infill being 250km otherwise Nick’s would also show these gaps.
https://data.giss.nasa.gov/gistemp/station_data_v3/
“There are only about 2012 stations used for entire planet”
No, that was V3. V4 has about 10000 in a typical recent month (9912 in Jan 2020, but they are still coming in).
This is the link to version 4 and it does looks like there are now about 20,000 stations with 10,000+ alone over North America. Therefore an increases of about 10 times more, but mainly from high density in the usual areas.
https://data.giss.nasa.gov/gistemp/station_data_v4/
Ah, thanks, Richard M, for that University of Alabama anomaly map for “January 2020, lower troposphere”.
Quite different from the NOAA land temperature graph, isn’t it?
Indeed – As one would expect, as UAH LT is an averaged atmospheric temp, and not the surface.
Surface temps in Jan over Russia are dominated by overlying surface inversions (caused by strong surface cooling from snow cover).
Satellites cannot ‘see’ that.
..or just the fact there are no urban thermometers in Siberia
Latitude,
Well done, first intelligent comment.
IMHO, Anthony is once again pointing to NOAA’s abuse of data to support political funding for its unscientific endeavors.
Thankfully, we don’t have to pay for the BBC crap – or are we in our own country?
There are plenty of thermometers in Siberia ….
https://moyhu.blogspot.com/p/blog-page_24.html
If the Russians do this every year, why would this have any influence on the year by year data?
“If the Russians do this every year, why would this have any influence on the year by year data?”
Exactly.
This whataboutery on the rationale for the Russian climate data seems valid enough but it presumes a static heating system in the centralised Russian town heating systems. The opposite whataboutery from your (apparent) climate alarmistas has been completely absent during the tsunami of scare stories over the last decade. Climate alarmist have little to worry about. Apart from the heroic work of the likes Of Anthony Watts et al in the climate science sceptic cohort the entire media in the First World – excepting Fox and Sky Australia – are the Boys Crying Wolf for the climate alarmist industry.
So long as it’s wrong regularly, it’s ok?
Honestly, this article should be an embarrassment to all WUWT readers. This simply gives the CO2 delusionalist cult an easy target to dismiss the many good articles here.
Russia was warm this winter, demonstrably. Just look at Russian youtube channels from Vladivostok , all through very remote rural Russia (Survival Russia – https://www.youtube.com/user/Moscowprepper ) to the Urals, to cities like SPb (“Pulse of the City” https://youtu.be/Uw-r8qjrpEk )
), to the Russian institute if science’s excellent and often long temperature records https://www.sbras.ru/en/organization/2395
*RUSSIAN HISTORIC TEMPERATURE / WEATHER DATA* https://cdiac.ess-dive.lbl.gov/ndps/russia_daily518.html
https://cdiac.ess-dive.lbl.gov/ftp/russia_daily/ )
– it’s simply a winter like they had in the 1870s. It is warm, but one season. So what?
But the number of infantile unsound logic in this utterly ideoligical, speculative , unscientic, unsound logic article shows you just how ordinary the thinking and rationalising bias is here. So silly i should not have to parse it for you.
When it’s colder, they need to heat more, which means more waste heat released in cities.
When the economy is better, they also heat more.
“When it’s colder, they need to heat more”
But it was very warm in January.
The Russians in small towns don’t use thermostats. The heat from their system is just always there. Did you know in some french block buildings the heating is completely turned off in some summer months. So during cold summers people buy electric heating appliances. Very efficient right.
“The heat from their system is just always there.”
So how does that explain that January was warmer than past Januarys?
Anthony explained at least part of it in the above article.
Very warm? Um in Siberia RIGHT NOW the temps are in the -30F to -46F range. Warmer by 2-3 degrees would make it -27F to -43F you disgusting liar.
Nick, did you see the discussion, above, about “begging the question”?
Talk about your circular logic.
That is indeed a somewhat strange looking “January departure from average” map that NOAA has put out!
So they are saying that much of central Siberia is ‘off the scale’ to the right on this ‘anomaly’ map, more than 5 degrees C above normal for January, along with much of central Eastern Europe as such, in the same condition?
If there is any sort of large scale reality to this, maybe the cause should be found in, you know, weather, shifting wind patterns, etc.?
Make no mistake. This is not weather as you suggest; this is CLIMATE 🙂
It’s a dominate positive NAO phase during winter that causes this persistent warm pattern over Europe and Russia etc.
http://4.bp.blogspot.com/-ajV48O6P-UY/UcUGj76KloI/AAAAAAAAVqo/FKK_fHtrCew/s1600/NAO2.jpg
Another winter the NAO will be less dominate positive and the temperature profile will be different again.
When I was in Russia (Moscow and Kirov) some 15 years ago, they had not invented the thermostat. I kid you not – none of the flats had thermostats, so room temperature was adjusted by opening the windows (-25 degrees c outside). Never seen such an inefficient system.
Ralph
Russia has lots of oil and gas. They need to modernize their heating systems. Legacy of the communism so beloved by the Democrat front runner.
ralfellis
The temperature in most of the rooms is controlled by turning the little controller on the radiator called a “valve”. This sets the flow rate through the radiator. Some have an air temperature sensor built in.
I have stayed in numerous rooms heated by such district heating systems (as they are properly termed) and they are extremely efficient. There is a lot of heat wasted from the system overall, but nothing like what is wasted from a coal-fired power plant in the USA or Canada.
The system efficiency is on the order of 70-80% meaning only 20-30% of the heat available from the coal is not applied to usefully generating electricity or heating something. The outgoing temperature from the power station is about 300 C and the return temperature is usually below 15 C. The condition of the systems across the former soviet union differs.
The cost of heating an apartment attached to a district heating system is about $8 per month. The heat is sold by the Megajoule using a “heat meter”. It has a flow meter, an input and output thermocouple and an electronic logging system. They can be read remotely. The water circulating in the subsystems and individual buildings is not mixed. There are large heat exchanges separating them as the water quality is controlled carefully.
You may have heard that in W China there are many wind turbines that are not used in winter when the wind blows strongest. The reason is that the homes are heated by district heating systems that provide heat at very low cost. If they were to switch to electric heating from wind, the system would be dreadfully strained each time there was a change in the wind speed.
Russian Collusion? Who’ya gonna call? Did anybody think to call Robert Mueller? This is nothing a special investigation can’s Obfuscate.
Never forget we wouldn’t have this Global Warming problem if it weren’t for gap tooth, Trump voting, fossil fuel burners.
“Russian Collusion?”
Not the first time, Russkies did it during the Nixon presidency 1969-1971, as yo can see here
http://www.vukcevic.co.uk/69-71.htm
Anyone who has ridden a motorcycle in cool to cold weather in rural areas can tell you UHI is real. You can literally feel the difference at approximately 0C when riding into town.
Absolutely- I live in ‘the sticks’, and when I pick my son up from the city centre the temperature is often 2-3 different as we get out into the wilds. Unreal.
I would be willing to bet money that a large part of that anomaly is just temperature from urban environments and smoothed so that it covers more land. The entire planet is covered in that map above, even places in Africa there is no data. Logically, the weather where I am at is not the same 100 miles away in any direction. The temperature in an urban environment where the thermostat is will be warmer than a rural one where no readings are available. There is a reason why NASA once said not to trust ground based temperatures.
https://trove.nla.gov.au/newspaper/article/122096963
“A report issued by the U.S. space agency NASA concluded that there has been no sign that the greenhouse effect increased global temperatures during the 1980s. Based on satellite analysis of the atmosphere between
1,500 and 6,000 metres above sea level, the report said that the study found “a seemingly random pattern of change from year to year.” While several government and university meteorologists around the world have concluded that average surface temperatures have increased significantly in recent years, the report’s authors said that their satellite analysis of the upper atmosphere is more accurate, and should be adopted as the standard way to monitor global temperature change.”
Newspaper article was April 1990.
Also, note the article about locusts the size of small sparrows.
My question would be that if CO2 is presumably well mixed, how would this happen if CO2 is driving surface temperature. The only logical conclusion is that CO2 is not well mixed and that an abnormal concentration of CO2 occurred at these locations. Note this would explain extra cold temps at other locations.
No, it doesn’t work like that.
CO2 is well mixed, as any perusal of global monitoring station data reveals.
What you see here is not climate, rather it is weather.
However, climate provides a baseline on which weather operates.
Climate is constructed from weather data. So no it is not the baseline on which weather operates. In fact trying to reduce climate to a single temperature anomaly for the entire globe is a fools errand.
My weather station on my rural property doesn’t take into account long term climate averages it operates just fine without the data manipulation.
“ Climate is constructed from weather data. ”
Climate, as in, the average planetary energy available to “weather”.
That in simple terms is the GMST..
You are equivocating. If CO2 is the primary gas causing heating on a daily basis then it should also “control” weather. If you try to argue otherwise you are denying CO2 is a control knob and other things are part of the equation.
I wonder what satellites show for outgoing radiation at this location.
The huge red spot heat is from Russian troll farms trying to influence the US election
Perhaps Mosher setup bit coin miners there to use that cheap Russian gas.
Cold N. America warm Siberia is normal, it is what the Earth’s climate is like for the most of the time, but we are in an inter-glacial which is one of short interludes during the Ice Age.


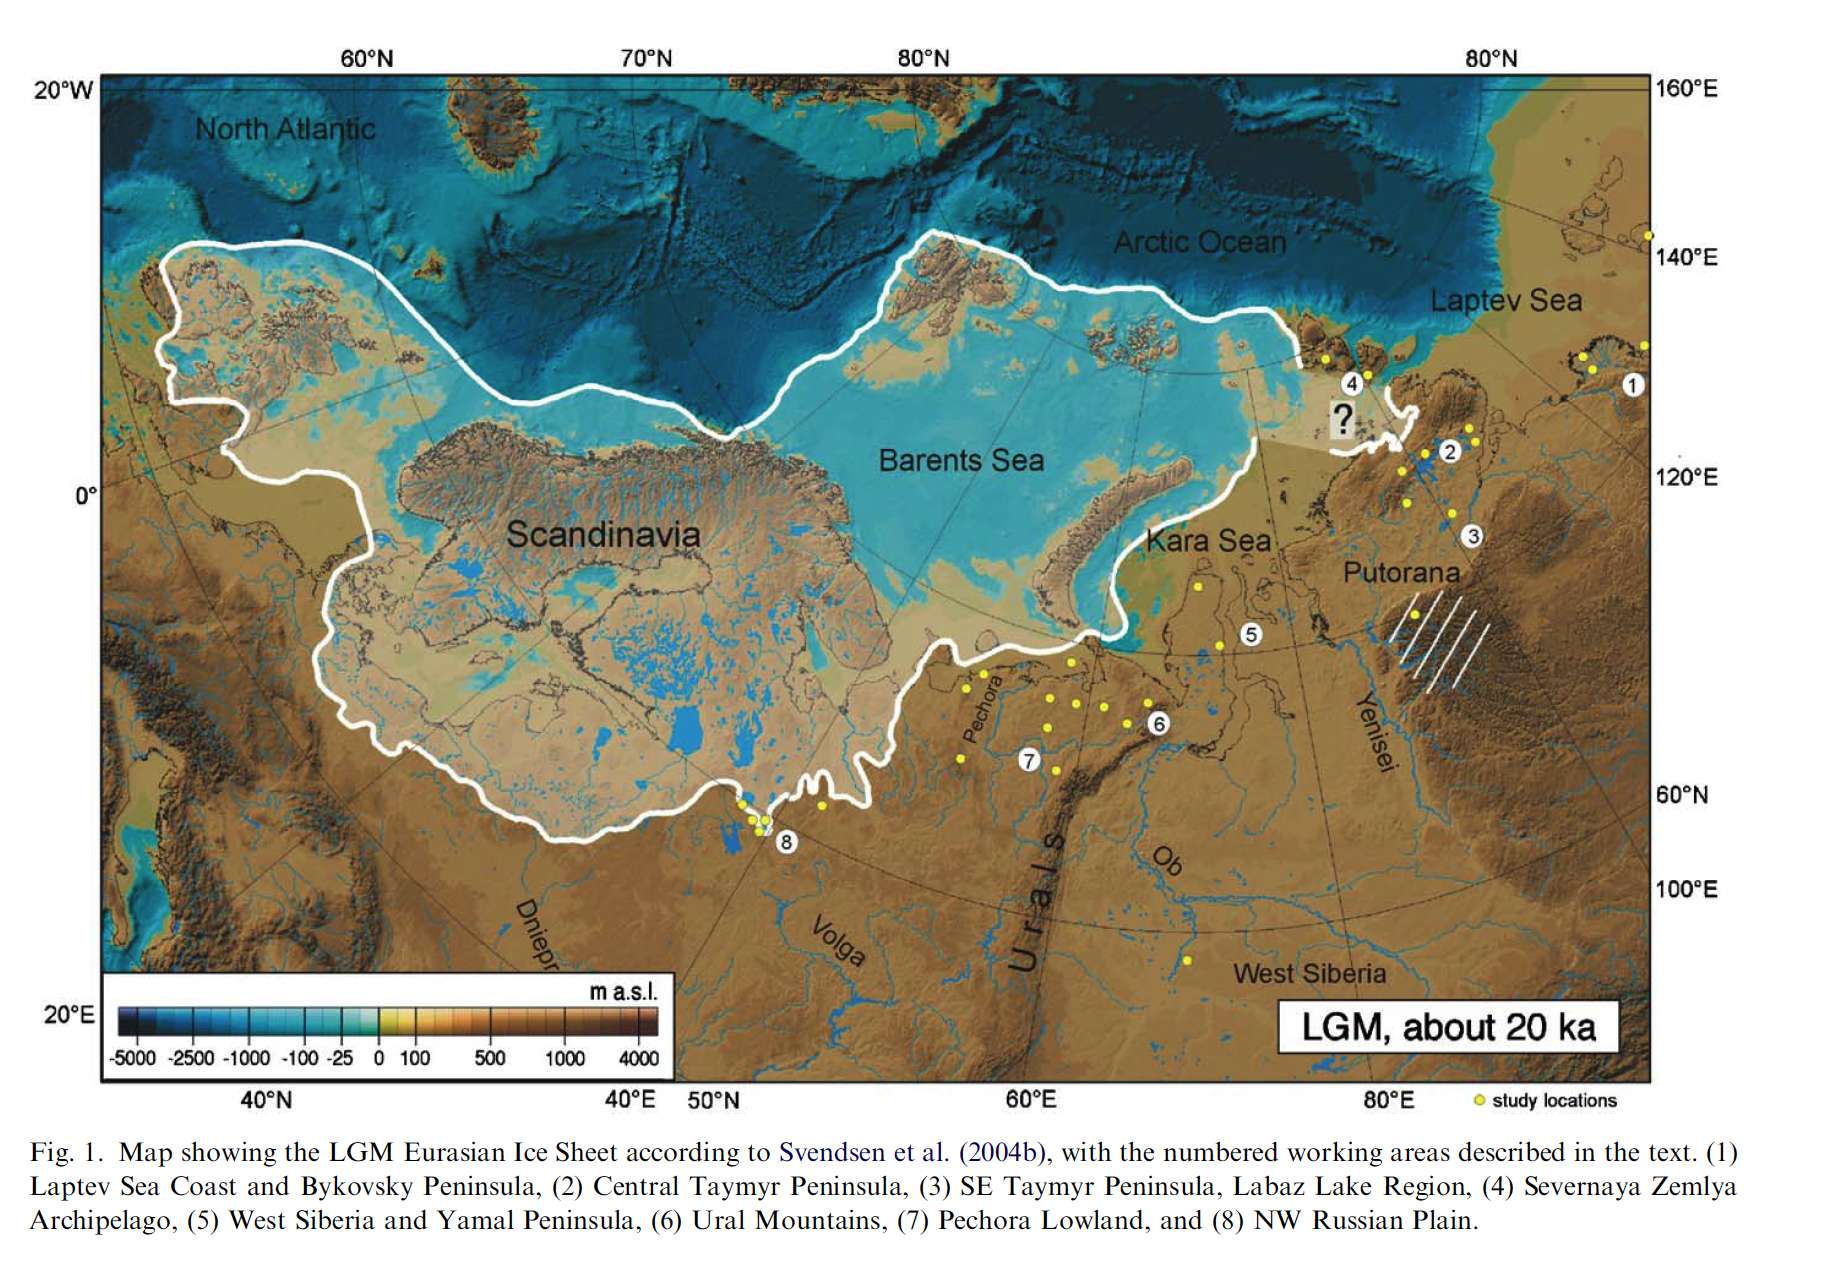
This map shows the Last Glacial Maximum (LGM) Eurasian Ice Sheet according to Svendsen et al. (2004)
“The last glacial began around 120 000 years ago. One massive ice sheet, more than 3 kilometres thick in places, grew in fits and starts until it covered almost all of Canada and stretched down as far as Manhattan. Then, 20 000 years ago, a great thaw began. Over the following 10 000 years, the average global temperature rose by 3.5° C and most of the ice melted. ”
We might be reaching climate tipping point, and could be far worse than previously thought.
Polar vortex? Norway to Finland also reports higher temperatures
January 2020 was the warmest since records began
https://www.independent.co.uk/environment/january-temperature-record-warmest-ever-winter-europe-norway-latest-a9320956.html
Jet stream.
The weather in Europe has been anomalously windy, wind bringing usually very cold areas nearer to North Atlantic +2°C. Record, who knows, but really mild winter. Heaven knows what the spring will be, probably not so warm.
The strong warm anomaly over Russia this winter is no surprise given the marked positive NAO.
Persistent and often strong Atlantic maritime winds penetrating across Europe and into Russia.
+ Strong SPV curtailing Arctic air migration.
In short weather.
In his 20090 book, Heaven and Earth, Chapter 7 – Air, Ian Plimer talks about impacts both for stations and human processes in Russia, particularly Siberia that showed apparent warming.
Wow in another 19 centuries I will have it on my reading list
Well it opened my eyes to the geological and historical argument.
Warming is on balance good for mankind.
CO2 has never in the Earth’s geological history caused runaway heating.
Northern Europe and Western Russia have indeed had an extremely mild winter this year, but not Siberia as far as I am aware. And Greenland has been quite remarkably cold and so has Svalbard. Sea-ice in the Barents Sea and the Bering Sea is at near-record levels.
In northern Finland it has been exceptionally warm this winter. First time in 20 years that all snow melted in January here in Oulu. But -26c yesterday and gloriously cold and sunny. It’s weather and records are always to be broken. At midsummer we have had snowstorms quite often!
Of course the Russians will want to ‘upset the apple cart’. Climate Change (and Xtinction Rebellion probably through funding) is a Marxist construct filtrated through supporters working in places where they can have an influence, like Universities and schools, spreading their ‘propaganda’ from within to further their agenda of destabilising capitalist States (where they will have to invest trillions of dollars into totally unnecessary actions) whilst they, Russia, continue to carry on as normal, such as using their coal powered stations. (Instead of attacking from the outside, work from in (as close to the heart as possible) to out).
I await, with interest what reaction cooler temperature changes, brought about by the change from El Nino to La Nina, will be, possibly due before the end of the year. What excuse/s then?
Russia these days is at least as much a ‘capitalist state’ as are those in the West. In fact, Marxism is now much more influential in the West than in Russia. The Russians had it imposed on them by a hostile elite in the misnamed “Russian Revolution” of 1917, compromised with it for a while, and threw it off in the genuine Russian Revolution of 1991. They have certainly learned the lesson that, I fear, the West might have to learn over the next couple of generations.
If Russians were actively hostile to the West, they might wish to encourage Marxist disruption over here to remove a competitor as you suggest, despite having rejected Marxism themselves. But, from my reading of Russian politics, far from being hostile, they would like a co-operative, win-win relationship with Western countries. It is the insistence of the Western oligarchy that Russia accept a subordinate position that causes the friction – though that’s not how it’s presented in the West’s mainstream media, of course.
The question remains, why do the boffins at NOAA readily accept such obviously erroneous data?
Every time there is an anomalous low reading, they bend over backwards to find a reason to adjust the data upwards. When the anomaly is hot, no questions asked.
Stay calm. There are UAH temperature measurements still intact. After two days we will get report from Roy Spencer what is the most reliable global temperature for January. Maybe you have noticed that the temperatures have been exceptionally high. I do not think that leaking Russian central heating pipes could be a cause.
“After two days we will get report from Roy Spencer what is the most reliable global temperature for January.”
Roy’s report for January came out on February 5th. And yes, it was the equal warmest January in his record (equalled by Jan 2016).
And yes, I don’t think those productive pipes were warming the entire lower troposphere.
Of course it is CO2 that causes the anomaly. All one has to do is place a Magic Molecule detector next to a thermometer and you can watch the effect of the evil gas on the temperature. In real time!
Nick Stokes …”Does anyone have anything to support the original claim that “South Australia had one of it’s coldest Summers on record ? ”
Freom BOM…
Adelaide airport Mean max Feb 2020 25.5C
Average Feb Max [1955-2020] 28.1C
Mount Gambier Mean max Feb 2020 23.5C
Average Feb max [1942-2020] 25.3C
Coober Pedy Mean Max Feb 2020 33.9C
Average Feb Max [1994-2020] 35.6C
Doesn’t prove that SA summer was one of coldest on record but suggests it wasn’t close to record warmth
“After two days we will get report from Roy Spencer what is the most reliable global temperature for January. ”
They are out and have been for weeks.
There is a link upthread.
Ahh….”Central Planning” in the 70’s and 80’s allocated fuel supplies to Russian towns based on their weather station average temperature readings from the previous year….so at one time, towns would report a few degrees lower daily temperatures so that they would receive more allotment. When the government ceased that policy, mostly due to conversion of central heating systems to natural gas, many weather stations showed “global warming”….hmmm…. And a few thousand weather stations were shut down as “no longer required” in the 1990’s. We are now likely seeing a change to electronic thermometers at weather stations and the old thermometers that happily used to read “low side” are being phased out.
At least that’s what I think is a possibility…..Cue in Mosh’s “it makes no difference to Berkeley…” meme.
Exactly.
I think I learned this on this site over 10 years ago. I can’t believe that anyone thinks the data from the USSR is any more valid than data from China these days.
Dear Mr. Watts: The House would launch it yesterday if you alleged the Ruskies were doing this to help Trump. We had a two year spec. counsel who had to step around piles of “Russian collusion” with Hillary in a desperate, and ultimately unsuccessful, search for Russians working with Trump. Mueller indicted a few guys named Ivan in the least-funny part of the whole insane affair, but the progressive press understood, and was only interested in a specific Russian action. Let’s tell ’em this Russian “heat” zone is hurting Joe Biden, and your investigation gets launched!
The information I can find is that the actual mean maximum temperature at Oymyakon for January 2020 was -42.8C and mean minimum -47.9C. This gives a mean temperature for January 2020 of -45.4C. The mean temperature for 1981-2010 for Oymyakon in January was -46.4C, so actually it was only 1C ‘warmer’ (if you can call 45 degrees below zero warm!) than the standard mean period. How come the NASA map shows it being -5C cooler or more – that is surely the fraud.
I don’t buy any of this.
Russia is the largest country in the world.
Compare it with the USA/Canada. There are three distinct temperature areas, but in Russia it’s a single, uniform temperature across the whole country, thousands of miles.
Then it just stops at Europe, and within a matter of six or seven hundred miles the temperature has dropped by the time it reaches the UK, with the Gulf Stream tearing past it maintaining an artificially high temperature for its latitude.
Northern Africa and central India are showing ~6C colder than a region a thousand miles North of them.
As for the theory of the archaic heating systems in towns and cities, affecting millions of acres of land surrounding them, it’s just barking. Look at Iceland for Pete’s sake. It has huge amounts of geothermal activity exposed at the surface, with heating systems run on that, but even its showing ~7C colder than Russia.
Every single equatorial region is showing at least 5C colder that Russia. Give me a break.
I don’t conform to conspiracy theories. I think some idiot has dropped a massive bollock with an IT system somewhere, and someone else is a Greta aficionado, so without even thinking about it, is running round waving this as proof positive that we’re all doomed.
I would buy into this hypothesis if it were only affecting the local temps as measured in the towns/cities being heated, and then they use that data to extrapolate to the entire region. Similar to how the UHI over time in our regions in NA or Europe raising the local temps being measured in or near cities and airports and then they misuse that data to say that the entire planet is warming more quickly than it actually is the last 100 years here.
The idea that the the entire region temp is being raised by inefficient heating would be hard to swallow, as that would be out by many orders of magnitude in additional quadrillions of Btu’s required to have any widespread ability to raise the avg atmospheric temps over the entire region.
I thought this had something to do with that region of Siberia not having the anticyclonic high pressure in place for some of the season, which led to the small increase in temps, perhaps with more cloud cover just slowing down any radiative cooling to space as compared to clear skies in a high pressure allowing the heat to radiate out to space.
I must have misread the article and some of the comments above to think that the entire general atmosphere across parts of Siberia were being warmed by wastage and inefficiencies from residential/industrial steam heating. I further see that Anthony wrote the article, and was as I suspected that only the local town ‘weather’ was being heated where they were taking the temps and then extrapolating to the region. Much like the UHI effect that Anthony had previously discovered in USA, affecting the local temperature measurements and extrapolating to the entire nation. I thought this was another article to debunk about humans responsible for all the warming of the atmosphere. But I see it is only for warming the local general area surrounding the measuring thermometers similar to the UHI effect being measured here and extrapolated to the NA continent. Makes perfect sense to me. Along with some regional weather affecting the wider area temps for a short period of time such as jet stream meandering and location of high/low pressure systems.
HotScot February 29, 2020 at 11:00 am
“I don’t buy any of this.”
—
You would be incorrect Hotscot, this is for real, I’ve been monitoring its gradual development since early January. The ‘Windy’ WX app has an “Extreme Forecast” display which effectively acts as a thermal anomaly overlay (index uses temp, wind, cloud and humidity input, iirc), and this is what it shows right now. (I altered the graphics code to show the full detail the standard display doesn’t show).
Today:


2 days from now:


It will keep occurring as long as the Jetstream remains amplified and doing what it’s doing over the North Atlantic basin (you may have noticed the higher waves, storminess, high rainfall, snow and higher winds in the UK since mid Jan … yup, stronger deeper jetstream, not merely surface Lows passing).
The situation is not over and is related to extra strong and very deep jetstream flows over the tropical and subtropical Atlantic (as mentioned by Stephen Wilde below) that are being blown ENE toward central Russia after crossing Europe, doing same things there. The persistent Atlantic flow ENE is displacing the usually frigid western Russian air mass ENE also. Hence the deeper blue anom over Alaska. The coldest air is actually going into the polar region so thicker ice which melts slower in summer may occur.
This is increased VARIABILITY.
Today’s JAXA data shows NH ice cover for 2-28-2020 is the greatest for this date since 2013. 14,352,319 sq km.
All the previous Jaxa data was adjusted using smaller grid size in 2014; of course the ice cover for earlier years increased. 2013 data for 2-28; 14,505,117 vs 14,182,031 before adjustment.
“(NOAA) claimed January 2020 was the hottest January on record”
Dear NOAA
AGW is a theory not about temperature events but about long term trends in global mean temperature according to a causal relationship between atmosCO2 concentration and surface temperature that works over long time scales of 30 years or more. Some have suggested a time scale of 90 years.
https://tambonthongchai.com/2019/05/02/a-history-of-climate-sensitivity/
But it is true that climate fearology works at whatever time scale creates the greatest fear.
https://tambonthongchai.com/2019/02/22/old-climate-fears-revisited/
100,000 Greenbacks. However, millions in quid pro Joes. That said, the fiction of [official] (perhaps competing factions) Russian “collusion” was a first-order forcing of catastrophic anthropogenic climate change, a great cover-up, in progress, over a multi-trimester period. The source of the temperature anomalies, correlated with heat, may be the same problem witnessed in first-world nations with measurement, observation, and interpretation, notably inference and brown matter to infill the missing links (e.g. siting). Another blocking phenomenon? Also, indulgence of liberal license to establish baselines from proxies of dubious significance and inference to characterize their viability.
The “steam pipes” were in use last year, so how come last year’s January wasn’t a record?
Well, here’s what appears to be a Russian propaganda article (or, call it “spin,” to be nice), about improvements in conditions in Russia:
https://www.awaragroup.com/blog/russian-life-expectancy-surges-to-74-years/
If there’s any truth to that article, then, as MarkW noted above, it could plausibly mean they’re providing more/better utilities, like steam heat, than they used to.
That is just speculation, but this is not: by any sane measure, warmer winters in Russia are a Very Good Thing. It is utter lunacy to spin a report that January(!!!) was less brutally harsh than usual in Russia(!!!) as a problem that needs to be solved.
– Svante Arrhenius (1906 in Swedish, 1908 in English)
“It appears that the “warmest ever” January might simply have been influenced by Russian temperature data warmed up by waste heat.”
In a nice symmetry, here is a member of the Duma:
“The United States may be using a “climate weapon” to cause an unseasonably warm winter in Russia, a lawmaker has claimed in an interview with the Govorit Moskva radio station Tuesday.”
You must spend hours just trawling thru junk on the internet and working on you crazy junk you publish on your website. About all I see is proof that there are plenty of you idiots out there with websites and far to much time on your hands.
Russia is still cold but due to the rapid flow of the jet stream from the Caribbean, across the UK and deep into Russia the normally extreme winter cold has not developed.
That shows up as a ‘warm’ anomaly.
However, the jet stream tracks are more equatorward than normal as a result of cold plunges down across the USA forcing the tracks southward.
That is an indicator of a cooling world since the clouds associated with the mid latitude jets are covering more of the oceans and reducing solar energy into those oceans. The North Atlantic has become colder recently.
Meanwhile the cold Arctic air is locked within the Arctic and unable to shift across Russia. Hence a colder Arctic than recent years and a recovery of Arctic sea ice to near normal.
A redistribution of energy usually associated with cooling rather than warming.
“and a recovery of Arctic sea ice to near normal.”
…
Normal?
…
http://nsidc.org/data/seaice_index/images/daily_images/N_stddev_timeseries.png
…
No where near “normal.”
Anything within 2 standard deviations constitutes ‘near normal’.
Huh?
The NSIDC shows current extent is smack on the 2 sigma line.
2 sigma is defined as the line demarcating 95% v 5%.
How can that be considered near normal, when only 5% of times the extent was less ?
(Rhetorical) … it can’t.
The following shows that on only 10 occasions has the extent be less than now at this time of year.
All but one occurred in the last 10 years.
https://nsidc.org/arcticseaicenews/charctic-interactive-sea-ice-graph/
Extent is higher than the maximum of 1974.
Use the charts on the sunshine hours website which shows it around 1 standard deviation at present and well ahead of many other years.
Also, check out the thickness charts which show recent increases.
Stephen:
I don’t know where SH gets 1 sd when others show 2 but I will concede that your “near average” is applicable to the last 20 years, but very far from averages in the 80’s and 90’s.
And BTW, no surprise as this thread is about record warmth in Russia.
That doesn’t happen without the Arctic being colder.
https://sites.uci.edu/zlabe/arctic-sea-ice-extentconcentration/
And still despite that Arctic wide temps have been running 4C above normal this year. (Yes I know it is modelled).
Henry Pool
I suppose Mr Wilde is absolutely convinced that 2020 will continue for a long while as 2019 ended: near normal.
But in the graph below made out Colorado Arctic Sea Ice extent and out of HadISST1, we see that 2012 started above normal and had a pretty good ice reconstruction, but got suddenly very, very tired.
https://drive.google.com/file/d/1VJspflsnfuChuJPE5DFvqUyWpDZVWiWZ/view
Thus sorry, but we should await October before claiming about any kinda ice recovery…
Btw, Scissor, I added HadISST1 for 1974 (blue, dotted) to show how ‘good’ it compares with 2019 (red, dotted). Hmmmh.
I had to use Colorado for 2019 because I lost the HadISST1 grid data, and must download it again. But we see that 1974 is clearly above the HadISST1 mean for 1981-2010.
Rgds
J.-P. D.
Sources
– ftp://sidads.colorado.edu/DATASETS/NOAA/G02135/north/monthly/data/
– https://www.metoffice.gov.uk/hadobs/hadisst/data/download.html
I have the daily pics for surface winds in that region. The reason for the above average warmth was warm surface winds flowing east from around the Caspian Sea which penetrated well into the heart of Siberia. It broke the deep cold waves, and kept them from advancing to the west. There were also warm surface winds which moved northeast and to the east of Moscow before moving into the Arctic.
“Russia is still cold but due to the rapid flow of the jet stream from the Caribbean, across the UK and deep into Russia the normally extreme winter cold has not developed.”
Here’s a nullschool link showing the subtropical jet stream moving across the US., UK, Europe and Russia:
https://earth.nullschool.net/#current/wind/isobaric/500hPa/orthographic=-33.84,51.92,483
A little bit of a cold circulation around the UK, and it looks like the polar jet stream is dipping down over the west coast of the U.S. (as ren pointed out earlier) so cooler weather is headed that way and probably across the U.S. later. So far the subtropical jet has been keeping all of us fairly warm with the polar jet only dipping down a little bit in the U.S., mainly in the northeast, but now we have a dip in the west coming our way. This is to be expected at this time of year.
“After two days we will get report from Roy Spencer what is the most reliable global temperature for January”
Russia has the potential to be several degrees anomalous of average temperatures.
It is has a continental climate.
Meaning (usually) that Atlantic maritime air does not penetrate that far into it.
As such the ground stays snow-covered and the air cold/dry, with a surface inversion developing even as advected warmer air rides above.
The UK is (nearly) always subject to Atlantic winds for some time at least in every month of the year.
This a meliorates temp extremes. And one cannot expect an anomaly of +5C.
FYI: the average CET for Jan is ~ 4C and the highest on record (1916) is 7.5.
Jan 2020 was 6.4.
https://www.gavsweathervids.com/central-england-temperature.php
So in the 361 years of the CET record the highest +ve anomaly has been +3.5C.
It’s not only NOAA reporting huge hotspots of upward temperature anomaly in Europe and Siberia in January. UAH is saying this in the last page of:
https://www.nsstc.uah.edu/climate/2020/january2020/GTR_202001Jan_1.pdf
And, UAH reported January 2020 as tied with January 2016 as the warmest January in their record. El Ninos spike up the temperature of the satellite-measured lower troposphere more than they spike up the temperature of the surface or the surface-level atmosphere, so this means that the surface and surface-level atmosphere were warmer in January 2020 than in January 2016.
UPDATE: UAH revised their v6 TLT anomaly for January 2020 from .56 to .57. Assuming January 2016 does not also get revised upwards, this makes January 2020 the warmest January in the UAH v6 TLT record.
(http://www.drroyspencer.com/2020/03/uah-global-temperature-update-for-february-2020-0-76-deg-c shows figures for January 2019 through February 2020 as of the initial release of the February 2020 numbers, and as of early 3/3/2020 the full record available at http://vortex.nsstc.uah.edu/data/msu/v6.0/tlt/uahncdc_lt_6.0.txt was only updated to January 2020.)
https://www.nsstc.uah.edu/data/msu/v6.0/tlt/uahncdc_lt_6.0.txt is now updated to February 2020. January 2016 is still shown as .56, barely behind January 2020.
Just an observation – but has anyone else noted that the steam in Anthony’s pic is going straight up?
As one would expect with a DeltaT of 100C plus whatever minus the surface air temp is at.
Similarly (but not visible), as it is heated air above, the horizontal pipe.
How prey can that affect a thermometer at the very last 100’s of metres away?
The insulated steam pipes must cover every building in the town and the. They must return to the source to be reheated. People who live in buildings read thermometers in a town that is literally crisscrossed with heating pipes. Thus the call for decentralized heat. I’m a plumber and I know how steam pipes, insulated or not, work. They lose heat all along their length coming ang going back to the plant.
And I’m a retired meteorologist, and know that by the laws of physics, hot air rises and does not move sideways.
It’s called convection.
To intimate that all of Russia’s meteorological thermometers are affected by heat from steam pipes is preposterous.
I have worked around, over and beside steam pipes. Insulated steam pipes lose heat. The steel pipes are welded or bolted to steel shoes that allow them to be insulated. The shoes are heated and heat the steel racks they stand on. The racks heat the steel supports. The steel supports conduct, convect and radiate heat. All the heat does not go up. Where are the thermometers?
But the heat used in the houses is much more than what’s lost from the pipes. Guess what happens to that heat.
It goes up and is minuscule in comparison with the heat capacity of the atmosphere.
You need to explain why this January was warmer in |Russia than other Januaries. Why didn’t those pipes create fake temperature reports only this January?
Do you think that nature can have large fluxes in the short term all on her own? Do you think CO2 caused this brief period warming? I pity you.
I myself found out what begging the question was quite late in life, because it is an expression that is often used incorrectly. It’s a common and trivial error.
But begging the question (in its real meaning, which is, assuming that the proposition you are trying to prove is axiomatic) is standard with the global warming crowd. The wonderful computer programs that predict catastrophe all beg the question, because they are designed with the prior assumption that carbon dioxide levels influence global temperatures. Also, the infuriating claim that 97 percent of scientists believe that climate change is real is a triple question beggar. It assumes that 97 percent of people agreeing with a proposition proves the proposition, it assumes that scientists have a special store of knowledge that empowers them to predict a complex multivariate system like climate, and it assumes that climate change must always be for the worse. That the statement is used so often is a long-running example of the cynical contempt for honest argument that is a hallmark of climate change alarmism.
Anthony Watts
You write:
“In a report generating substantial media attention this month, the National Oceanic and Atmospheric Administration (NOAA) claimed January 2020 was the hottest January on record.
In reality, the claim relies on substantial speculation, dubious reporting methods, and a large, very suspicious, extremely warm reported heat patch covering most of Russia.”
My reply to this:
https://ds.data.jma.go.jp/tcc/tcc/products/gwp/temp/jan_wld.html
This picture below unfortunately does not look very good – a finer resolution would give a better result.
But we can clearly see the dark red spots over Siberia, Western Russia and Eastern Europe, as well as the dark blue spots over Alaska.
JMA’s source no longer is NOAA’s GHCN ; it is CLIMAT since the year 2000. Nor is their SST based on any ERSSTx: they have an own COBE-SST2.
JMA’s linear estimates are the least ones among those of all surface temperature time series (all in °C / decade, 2 sigma):
1891-2019: 0.07 ± 0.001
1979-2019: 0.14 ± 0.004 – to be compared with Roy Spencer’s UAH6.0 LT land!
2000-2019: 0.17 ± 0.010
2010-2019: 0.35 ± 0.040
Only Bastardi’s WeatherBELL (Dr Ryan Maue is gone, what a pity) shows such low trends, but it is based on a reanalysis method.
Thus, if this ‘coolest temperature series’ says Januar 2020
– is the warmest month on their record since 1891,
– on the basis of stations and of processing techniques differing from NOAA’s,
I have some doubt about your claim concerning an alleged exaggeration by NOAA, let alone would I understand your claim about the quality of these Russian weather stations you seem to trust only when they measure cold temperatures.
It seems to me, with all due respect, that you simply can’t accept that it’s warming a bit… and above all, that it is here and there warming a bit more.
Rgds
J.-P. Dehottay
Bindi,
Here is a pic from Ryan Maue’s site, Jan 2020 by the JRA-55 reanalysis:
http://climatlas.com/temperature/jra55/jra55_global_temp_anomaly_JAN2020.png
Actually, this month is the second warmest Jan in JRA-55, behind Jan 2016 only, but the pattern is interesting since it has more detail than GISS and NOAA maps. There seems to be two distinct hotspots, Southern Finland and another one north of Baikal
Many thanks Olof…
I didn’t know about this ‘second life’ yet.
J.-P.
Olof
The graph indeed is of amazing precision.
If you look at the darkest red surface, you see kinda ellipse ranging from Southern Finland to the region around Perm, in the Ural region, just in front of Siberia.
J.-P.
Thirty year average for my neck of the woods in NE Ariz for January is average high 52 degrees and average low 22 degrees. My actual monthly was high 49.5 degree and Low 22.5 degrees. Not seeing hottest month on recaord what so ever and yes I understand my data is the local weather.
chemman
“Not seeing hottest month on record what so ever and yes I understand my data is the local weather.”
Exactly!
It seems you accept that
– NE Ariz is a small piece of CONUS, and that
– CONUS is a small piece of the Globe (6% of its land surface).
Rgds
J.-P. D.
My local weather was unusually warm (as usual).
“How does our meteorological winter (December-February) rank so far? If we take December 1st through February 12th, it ranks as our 4TH WARMEST WINTER ON RECORD IN PORTLAND. Records go back to 1940 at that location. Some other locations around the PACNW:
Salem: 13th warmest out of 127 winters
Eugene: 7th warmest of 82
Olympia: 3rd warmest of 79
Redmond: 3rd warmest of 71
Pendleton: 6th warmest “
https://fox12weather.wordpress.com/2020/02/13/holiday-weekend-rain-mountain-snow-as-mild-winter-continues/
And yet none of them are #1 😉
Pertinent to Anthonys’ question, could daily heat escape on a global scale actually effect world average temperatures. Let us not forget that back when thermometers and modern measurements began,there was no black tarmac anywhere,no car parks,no airstrips,no air conditioners ,no hot engines no central heating only fireplaces and blankets. And now we have many zetajoules of waste heat energy being dumped into the atmosphere at an increasing rate roughly in lockstep with temperatures.The Russian steam pipes should be checked as a matter of urgency before the world economy is crippled by a red herring relic. If small towns in Russia can influence world temperatures with waste heat, then what is this climate argument all about? Because even solar and wind energy end up in the atmosphere as waste heat.
No good post.
Very bad.
IT IS A TIPPING POINT.
The Mongolian blocking anticyclone was absent this winter for the first time in at least 150 years since it was discovered.
That very anticyclone defined the cold Winters in Siberia.
No anticyclone – no cold.
The Atlantic warm air flooded Russia from West to far east.
This winter was warmer by 10 degrees or even more.
There was no actual winter in Russia.
It is like the Alps or Rocky Mountains would disappear!
Just consider how much more heat would have been lost to space by the ground being at a higher temperature than normal over such a huge area radiating to space.
A cooling signal overall.
Sorry, but we have warming, no cooling.
It is not due to CO2 , but the warming is tremendous.
I tend to prefer the satellite readings which are produced by Roy Spencer’s team.
So was Ghenghis. He was around for a while and then disappeared.
Perhaps the Rusian winter moved East this year, to Alaska.
Anthony,
I’ve been logging and describing changes in the global jetstream, over at JoNova’s site since late Novemeber in her un threaded posts. There have been major changes during the past 3 months (globally), and I don’t say this lightly. One of those was that much stronger jets were pushing tropical Atlantic air over Europe and on into western Russia. This is because the subtropical jets in eastern North America and the north Atlantic basin broken all prior speed records, during the past 2 months, and the past month in particular.
For instance:
The highest Jetstream forecast in the North Atlantic (the highest actually observed was 439 km/h)


Last week I recorded a gif of the global jetstream towards the end of summer to prove that the southern hemisphere’s jetstream looks no different to the northern hemisphere’s jetstream, at this point in the late southern summer.


As I’m sure you realize that should not be close to being true, but it is. The reason why the seasonally has disappeared from the southern-hems jetstream speed this summer is because sinking ultra-dry stratospheric air fell into the lower troposphere, since before Nov 2019 (during our spring). i.e. the troposphere responds very strongly to seasonal changes, but falling stratosphere does not respond to seasonal influences at all, and it over-rode and over-printed the normal summer seasonal influences, negating them, so that the southern summer jetstream looks identical to the northern Winter Jetstream this Summer (which ended last night).
The following reported record jet speed for jets and balloon flights, was set back in Feb 2019, but it was SMASHED (by an incredible +23%) during Feb 2020.
Yes, you read that right, a 23% increase in maximum speed, above the North American record speed set just 1 year prior.
—–
“… Record JET STREAM speed measured at over 200 knots – approximately 231 mph – over PENNSYLVANIA – And propels flight to 801 mph – By Strange Sounds -Feb 22, 2019856
http://news12li.images.worldnow.com/images/18139568_G.png
Record jet stream speed recorded over Pennsylvania, USA in February 2019.
The jet stream. You’ve probably heard it mentioned many times in your local forecast. It is a river of fast moving air high up in the atmosphere – approximately 30,000 – 35,000 feet – that steers storms, and can have a huge influence on our local weather patterns. The jet stream typically reaches its highest speeds during the wintertime, when temperature and pressure differences across the mid-latitudes are at their greatest. In the summer, there is also a greater amount of rising air (convection, which leads to thunderstorms) which can disrupt the jet. In the cold months, the jet stream usually maxes out around 160 knots (184 mph). This past Monday, however, a weather balloon launched from the New York National Weather Service recorded something that it never had before in our parts: a jet-level wind speed over 200 knots – approximately 231 mph! … “https://strangesounds.org/2019/02/jet-stream-record-speed-pennsylvania.html
—–
The jetstream in the southern hemisphere’s Summer (ended last night) was even more radically accelerated than that, as the winds were up to 200km/h faster than the normal maximum speed of ~215 km/h during a ‘normal’ mid-Summer, during the hiatus period (see the graph linked above).
I logged these jetstream accelerations and character in detail since the end of November, until now, so I don’t doubt this thermal-anom over Russia at all. I saw it developing over the past 6 weeks or so, it’s quite real.
But it’s occurred because the jetstream increased in speed over last year’s record level by 23%, plus the jetstream got much deeper (because the pressure gradient got steeper, so constricted and expanded vertically, higher and lower, due the convergence) with that strong increase in speed.
The result was much more air was pulled ENE from the tropical Atlantic and dragged further eastward of Moscow.
The Russians are not misrepresenting their weather reporting here, this warmer winter really occurred, because the usual colder air was displaced ENE.
The cause was, and still is, ultra-dry sinking stratospheric air (yes, you read this right), falling into the lower troposphere (yes, you read that right too), which I’ve also logged in detail since early January. That also really occurred.
Ultra-dry sinking stratosphere (bright pink) which I isolated within this custom-display, which shows only the 0.0% rh to ~6% rh part of the air, and where it falls to, from the stratosphere to near surface level:


Anthony, Jo and David have been tracking what I’ve been observing during this time, if you wish to confer with them about their thoughts on it all.
In short, we have had a major change in the troposphere especially in the southern hemisphere, the effect has been relatively smaller in the northern hemisphere still, but it’s still a major change, and is on going due to the on-going sinking of stratospheric air into the lower troposphere.
If interested in this, I wrote it all up and regularly posted updates about it within Jo Nova’s “Unthreaded” posts since about Nov 28th 2019, until now. There are copious screenshots supplied, and some gif animations, plus a discussion of the causes and implications. I can supply a full listing of direct links to the posts if you wish to read them. I did post a few of the early links into a Willis post a few weeks back.
(Rescued from spam bin, which had at the time has 292 entries) SUNMOD
Hi WX
Hadn’t noticed your unthreaded comments at Jo’s site but will look at them now.
People here know I have been banging on about the jetstreams as a diagnostic indicator for global warming or cooling for over a decade and Jo kindly published this for me:
http://joannenova.com.au/2015/01/is-the-sun-driving-ozone-and-changing-the-climate/
I judge that the process described by me back then is behind your observations and suggests that a global cooling process is now in place.
The tropopause over the poles is being pushed downwards which forces top of troposphere cold air equatorwards which enhances the temperature differential between polar and tropical air at the height of the jets thereby accelerating them.
If this continues the ‘pause’ in the temperature trend will be over and a decline should begin with La Nina becoming dominant over El Nino.
There should also have been a recent increase in global cloudiness/albedo. Does anyone have recent data on that?
Hi Stephen,
Happy to hear your impressions and discuss when you’ve read through it, cheers.
Regards
Hi WX
When you refer to stratospheric air descending into the lower tropopause what do you say happens to the tropopause?
Descending air will always cause clouds to dissipate. In winter less clouds will allow more energy to escape to space and in summer will allow greater surface heating at the surface from insolation so the net outcome depends on location and timing.
Also, descent and less clouds in one place causes uplift and more clouds in another place so again the net outcome depends on location and timing.
It would all net out to zero as a result of adjustments/changes in convection UNLESS global albedo also changes because albedo determines the proportion of incoming solar energy that can get into the oceans.
So, we are forced back to the issue of jet stream configuration which affects total global cloudiness.
Key to that is the gradient of tropopause height between equator and poles.
The interesting feature of the faster jets is that it necessarily follows that there has been an increase in temperature differentials at the height of the jet stream between polar and tropical air masses.
The wavier the jets get or the more equatorward they shift the more clouds increase, global albedo rises, less energy gets into the oceans and eventually the system cools.
Whoops, should have said ‘descending into the troposphere’
Stephen Wilde March 2, 2020 at 1:17 am
Hi WX “When you refer to stratospheric air descending into the lower [troposphere] what do you say happens to the tropopause?”
—
Hi Stephen.
One of the first things I noted when the northern-hem subtropical jetstream accelerated to ~410km/h in late Nov and early Dec 2019 was that the altitude of the core of the fastest jets had fallen from 34,000 ft down to 30,000 ft, approximately a 5k ft drop. At the time I presumed this meant the tropopause must have fallen lower as well (by which I meant the troposphere above mid-lats to sub-tropic). I have not confirmed that. Evidence of it should be present in ADS-B data from jet flights recording humidity, and also radiosonde, but I’m too busy since observing the dynamics to check on this aspect. But yes, that’s what I supposed had occurred. Have noticed and logged a drop in altitude of the upper-level humid layer during the past 3 to 6 months?
“… Descending air will always cause clouds to dissipate. In winter less clouds will allow more energy to escape to space and in summer will allow greater surface heating at the surface from insolation so the net outcome depends on location and timing. …”
Yes, agree all.
“… Also, descent and less clouds in one place causes uplift and more clouds in another place so again the net outcome depends on location and timing. …”
I began to suspect sinking stratosphere might be involved during early December. I got some push-back about that suggestion and explanation for steeper pressure gradients accelerating jets, initially. Criticism was along the lines of how can a rarefied cold gas sink into a much denser lower-troposphere convecting atmosphere? But since then I have showed in detail how this was occurring, both in observations, and how it could be tracked in detail in ECMWF runs. It clear now that it is occurring.
However, I originally envisioned that it would be falling fairly uniformly but very slowly close to the polar region. And in mid to late Dec I did clearly identify it falling from just above the inversion layer above the about -85 deg S Lat, down to the south polar tropopause level, where it pooled over the top of the polar circle, and then fell into the tops of cold-core lows in the southern mid-Lats, and then into highs in the mid-level sub tropics.
It was never clear if the 0.0% rh air (sinking-stratosphere) actually descended over the polar cell region itself, though the high which began at 39,000 feet (3k ft below inversion altitude) did fall all the way to the ice-sheet. But the bright pink ultra dry air was never seen depicted below the polar tropopause, which was at about 28,000 ft.
Of course in the North-Hem the situation was completely different, with almost no sinking stratosphere over the polar region due to vertical wave disturbances that displaced the pink in-falling stratosphere mostly over northern Russia to the east of the Urals, and over eastern North America and Greenland, and more rarely over northern Europe.
But in both hemispheres the 0.0% rh ultra-dry air sinks from there equatorward. It can be tracked sinking through several mechanisms. It almost always surrounds the fastest of the accelerated jets on the poleward side near the top of the jet. Plus it enters and mixes into the jet flow, and also sinks under and then equatorward of the jets, at around the 24k to 18 k ft level, where it usually enters a sub-tropical High which quickly sinks it to the lower troposphere near to 25 to 15 degrees latitude.
It often sinks to 5 k ft over water before convective dilution mixing with moist air, but I’ve seen it down to 2k ft over ocean, and all the way to ground level over land (usually just after sunset). The OLR will be very high and resulting rapid cooling allow it to sink quickly, dropping surface temps fast as well after sundown.
“ … It would all net out to zero as a result of adjustments/changes in convection UNLESS global albedo also changes because albedo determines the proportion of incoming solar energy that can get into the oceans. …”
I agree it will probably net to zero without other factors being involved, like albedo. What it does do though is amplify the variability range (i.e. what moderated during the warming, when this sinking stratosphere was either absent, or was occurring at a much slower volume per unit time).
“ … So, we are forced back to the issue of jet stream configuration which affects total global cloudiness. Key to that is the gradient of tropopause height between equator and poles.”
Now this was very surprising indeed Stephen. I did read your ideas a few years back so was half expecting something along those lines, but what I found was surprisingly much more structured, quasi-stable and had a lot less meridianal character and fluidity to it.
What I discovered was that the in-falling sinking ultra-dry stratosphere was not falling in generally or very slowly at all. Instead it was more localized and intruding much faster, and in more volume than I’d anticipated.
During Christmas to New Years I was toying with a means to display if ultra-dry stratosphere was even present and falling into the troposphere, and if so, how to display that and map it out. Being familiar and skilled with coding custom WX displays I developed a relative-humidity display for ECMWF to display all humidity from 0.0% rh to 2.2% rh in shades of hot pink, superimposed on my normal full range rh display.
I tried this out in early Jan and the new display immediately detected these slivers and areas of ultra-dry air within the ECMWF observations which are included in the front of each run’s initiating input data. This was amazing as such humidity levels as 0.0% rh could only have sunken into the troposphere from the lower stratosphere, and quite recently, as it would dilute away from 0.0% relative humidity fairly quickly. So it had to be a continuous in-fall of stratosphere if it was getting into the lower troposphere. And I was amazed to find a large patch of 0.0% humidity air at 3,000 west of the Western Australian coast in the observations data. There was another patch west of California at 3 k ft as well.
OK, so that’s what I found was occurring.
But as January progressed I discovered that the in-falling areas were quasi-stable in location! Now why would that be? This in-falling ultra-dry air was falling in only certain locations. However, these ‘locked’ or ‘blocked’ locations were also began to lock and block the Jetstream through mid-Jan, and it became especially prominent in February 2020, as the very fastest NH jets occurred around the middle of the month in the north Atlantic.
What occurred is the jetstream flows within both hemispheres became almost identical in their intensity. Both looked like deep winter jetstream flows (but the south was Summer!) plus very strong and ‘swollen’ flows plus more equatorwards. They were swollen vertically, not just in longitude and speed.
After new years the jets began to take on an induced global STRUCTURE. The structure in the ‘locked’ jet flow pattern was the result of the structure that was present in the sinking ultra-dry air paths! Now what on earth could cause such a quasi-static pattern or ‘structure’ to emerge globally, in what I had fully expected to be a randomized stratospheric sinking process and its locations?
The sinking wasn’t random! The result was the much amplified jetstream pattern also ceased to be random, soon after new years. A prominent long lasting pattern emerged by early and especially mid-January, and it remained more or less in place until this week where it has finally begun to weaken out. That was of course completely unexpected.
I logged this ‘structure’, took many screens of its features, and posted these into Jo’s Unthreaded posts as jetstream updates.
But several amazing new features emerged from this sustained structure.
(1) The first was a massive strongly zonal tropical to subtropical jet, which extended 2/3 of the way around the planet, from west Africa to the Persian gulf, south Asia, then on to southern China, and ten half way across the Pacific, where the zonality ended and it abruptly diverged, north-south. That divergence structure remained in place almost 2 months. That 2/3 hemisphere zonal jet and its central Pacific divergence structure are still there presently, but not as impressive looking as ~1 month ago, not quite as zonal and not quite as strong.
(2) The central Pacific where this ‘divergence’ of the zonal jet occurred, the southern jet drops to the equator region in the first week of January, while traces of jet winds in the southern hemisphere moved northward to meet and join with it, in the central Pacific’s Equatorial zone! And these two tentatively joined to form an EQUATORIAL JETSTREAM from 18k to 45k feet, with the higher speeds around 180 km/h at about 39k feet. This occurred during the second week of January. Yes, this really occurred. I have copious screens of it since early January to now. A true jetstream directly above the equator! This is not supposed to be possible! This jet became about the size of Australia on most days, and covered the same locations were El-Ninios usually occur. I was stunned by this and made sure it was reported fully on Jo Nova’s site. But the most amazing thing of all is that it was STABLE! Like the zonal jet and its divergence, it wasn’t moving much. It wasn’t fading away either. It was maintaining its strength at around 180 to 200 km/h at 39k to 45k feet. It was at higher elevation presumably due to the extra convection below lifting it and the tropopause higher.
No what on earth could do that?! I was astounded.
I investigated the pressure systems driving that novel equator-jetstream and it was driven by two cold-core lows, one on each side of the equator within the upper and mid-levels of the tropical zone. They extended from the stratosphere to about 15,000 ft where they lost their identity in the convection. Then an associated High formed east and polewards of these lows, that dropped from 30k ft down to the surface, in the near sub-tropical zone. When I looked at those structures with the relative-humidity overlay I’d made optimized to detect 0.0% rh ultra-dry air these pressure systems were loaded up with it, descending to near surface levels within them. I made screens of all this an posted them online at Jo’s.
(3) At the same time there were hints of an ATLANTIC equatorial-jet forming as well. And by the end of January one had indeed formed and joined to the massive zonal jet across Africa. Which again was completely full of 0.0% humidity sinking air and was driven by the same complex of two cold-core Lows descending from the stratosphere either side of the equator. And this jet was also stable! I was have in a hard time believing my eyes, but this had really occurred.
This is an image from the initiating observation to ECMWF at noon today. In it you can see the weakening zonal jet, the divergence and the weakening remnant of the pacific equatorial jet and the remnant of the Atlantic equatorial jet at 39,000 ft.
I think you don’t need to feel bad about not predicting this structural Jetstream’s emergence Stephen, no one could have predicted this.
“… The interesting feature of the faster jets is that it necessarily follows that there has been an increase in temperature differentials at the height of the jet stream between polar and tropical air masses. …”
Oh for sure, there was. I captured the temps of the sinking stratospheric cold air, that of course warms as it’s compressed via altitude decrease, but it stays colder than that air around it as it gets to the lower troposphere (not above there though). This is probably due to increased OLR, due to that air containing almost no water compared to the air all around it, so it is generally a cooler to colder air parcel nearer to the surface (at least until rh rises from mixing and thus OLR outflows decrease).
“… The wavier the jets get, or the more equatorward they shift the more clouds increase, global albedo rises, less energy gets into the oceans and eventually the system cools. …”
The sinking air dominates from +/- 45 degrees of the equator, especially from 10 deg to 30 deg latitude regions. It dries out air under Highs and equatorward of them, and this suppressed the lower and mid-level cloud in the tropics. Plus the tropical lows and monsoon, where it even existed (temporarily) had much less rain in it during this Summer’s wet-season. Which has been a bit disappointing. These conditions favor drought so a La Nina would be useful. However, it is my view that this stratospheric air was present in the last cold period in the 1970s and the period from late 1973 to early 1976 was some very rough weather, with coincides with strong La Nina.
In fact all though January I was thinking that if we get a strong La-Nina with these steeper pressure, temp and humidity gradients in the troposphere (which remember, are not following seasonal patterns) this could become really messy fast. Variability is what this dry air brings, and a strong La Nina would add stormy variability to that.
Now add a swollen jetstream that almost reached down to ground level, locked in place for months over some unfortunate country downstream … That would be … BAD.
However, the much stormier southern ocean (remember the cold is amplifying the deep cold-core Lows there, it’s still roughly like winter storms there, right now) is where an albedo spike should be present. Combine that with more ice and more snow for more of the year, and UI think what is where the cooling will come.
However, take note also that the very large pool of ultra-dry air in the upper and mid-levels polewards of the subtropical jets, will lead to increased OLR from the drier air in the mid-level, and this may be a much weaker effect than OLR flux at the tropics, but it will cool the upper levels more and an increase in albedo below should keep it cooler. There are a lot of implications to figure out.
Anyway, I’d enjoy discussing this further with you over at Jo’s threads rather than go on tangents at WUWT Stephen. But as you see, the jetstream is very much the culprit within this vast Russian warm-anomaly, and much will be made of it, for all of the wrong reasons.
But we can carry on this present discussion on a bit more in here if you like, hopefully it doesn’t go to the mod bin again.
Hi WX
That’s quite a contribution with loads of detail.
I think the basic point is that my hypothesis is the starting point for solar effects on climate but when one adds in convection, advection, rising and falling tropopause. oceanic effects and the rotation of the Earth, all combining to fling the jets this way and that, the detailed analysis becomes very complex, as you are finding.
Maybe Jo or Antony could create a fresh thread where we could continue the discussion ?
The fundamental principle is that the surface temperature in so far as it exceeds the S-B expectation is set by the mass of the atmosphere moving up and down within a gravity field (as per the articles here by me and Philip Mulholland) and whenever imbalances occur (including radiative imbalances) such changes as those you are observing occur inevitably as part of the convective response to those imbalances which are then neutralised so as to maintain overall hydrostatic equilibrium in accordance with the Gas Laws.
In other words, GHGs have zero effect on surface temperature but contribute a miniscule shift in convective activity which is swamped by natural variability.
WX,
I noticed this particular:
“But in both hemispheres the 0.0% rh ultra-dry air sinks from there equatorward. It can be tracked sinking through several mechanisms. It almost always surrounds the fastest of the accelerated jets on the poleward side near the top of the jet.”
Which fits my hypothesis well because the descending warming air over the poles envisioned in my hypothesis pushes the polar tropopause downwards which then forces the upper troposphere beneath the tropopause unevenly outwards towards middle latitudes where it enhances the temperature differentials along the jet stream tracks.
So, in my view the sinking stratospheric air over the poles is directly accelerating the speed and distorting the tracks of the middle latitude jets.
You also note that the energy released by the process eventually finds its way into the subtropical high pressure cells where the excess energy finally dissipates.
The jet stream track is where the increased energy crosses (via turbulent mixing) from the poleward stratosphere above the lowered tropopause and into the equatorial troposphere below the lowered tropopause.
You are watching the thermal effect of solar variability moving from poles to equator across the middle latitude jets.
It is nothing to do with TSI changes but rather solar effects on upper atmospheric chemistry primarily involving ozone which is why the so called ozone hole has now largely recovered.
Mod, please see the mod bin for a long comment with links I just made.
Stephen Wilde March 2, 2020 at 8:21 am
“ … In other words, GHGs have zero effect on surface temperature but contribute a miniscule shift in convective activity which is swamped by natural variability. …”
—
I would not agree that GHGs have zero effect on surface temp. I live in the tropics on the coast at ~19S latitude and the ghg effect from water vapor on surface temp reins supreme especially around 9 PM at night during mid-Summer, cloudy, or not cloudy. The 90% water vapor rh at 30 deg C is palpable. The result since the 1970s has been steadily rising MINIMUMS in northern Australia.
But this was associated with a general rise in rh since about 1980 to now, punctuated by ENSO of course, but generally higher with time.
Now, in retrospect, I can interpret this as being due to sinking ultr-dry stratosphere in-falling during the 1960s and 1970s, which largely ended around 1980. And this lack of drier air in-falling after 1980 lead to what we interpreted as a “warming phase”, when we should have been seeing it as a “wetting phase”. i.e. the ‘global-greening’ was the global-wetting of the troposphere, due to a reduction in drying in-falling sinking stratosphere.
In other words, humidity with altitude rose globally (even in the lower-stratosphere by 15%) over several decades, because it was being diluted less and less by lower levels of in-falling ultra dry stratospheric air.
But suddenly the ultra-dry in-falling stratosphere returned during 2019 (why a record just speed was set in Feb 2019 preceding this) and that infalling accelerated very strongly during the past 3 months.
The result is the global rh level must not precipitate out faster than replacement until a new lower equilibrium or water vapor level is reached. We will progress to global browning and the desertification phenomena discussed by alarmists in the 1970s. Thus the minimum night temps, from +/- 30 deg lat of the equator, will attenuate (though BOM will keep levitating them) as the humidity begins to drop, and my Summer evenings will become much more comfortable again.
But the dry air in the tropics will allows more heating of ocean by Sun and a greater contrast from ocean surface to the top of the troposphere—thus the moderated variability will sharpen once more as the atmosphere is entering the “Drying-Phase” (not cooling phase).
As I see it, the sharp increase in OLR with this ultra dry air falling to ground level overland is adding to the normal winter coolness, making the minimums drop faster and to a lower level on average, before the Sun’s photons return.
And that is how the diurnal nights in this colder (Drying) phase are being produced. It means the Sun starts from a lower coldness each morning, and near to its highest rh level of the diurnal rh cycle, which works against faster warming of the surface by the Sun. i.e. it is driest at and just after sundown (so OLR maxes out and cools fast) and moistest just before dawn when it is the coldest.
I have found much more on this but that will do for now.
So I agree that sinking air, GHG and OLR effects may NET out, but the variability shoots up to very high levels in the rh drying-phase and falls to its lowest level during the rh most humid phase (again, punctuated by ENSO and other ocean cycles).
Last night while my post was stuck in the mods-bin I made two eye-opening animations for you to give in a reply post. Here they are, firstly I wanted to show you the incredibly strong and swollen structure of the strongest jet I found in the initiating observations part of the ECMWF runs in February 2020. This is quite possibly the strongest sub-tropical jet ever observed. It extends from surface level (coupled with a surface trough and Lows) all the way to the lower stratosphere at 45K feet (at this latitude and alt in winter it’s going above the tropopause and altering it).
Firstly, here’s a single image of the fastest max speed I found in the observations in Feb:


And here’s the animation of this same jet, at the same location and time, from surface to 45k feet and down once again.


Take particular note that these ultra fast and very deep jets directly alter the surface weather over a large area for most of a week and increases variability and intensity of waves, wind, rain and snow. This is what occurred to the UK, it was not the names storms, those storms were coupled to these mega-jetstream flows that reached the surface, and many of these crossed the UK during late Jan and through February. This one was the strongest but fortunately all of them were decaying when they crossed the UK. It was these that blew the lower level oceanic Atlantic air to the East of Moscow and produced the massive warm anom over Russia.
And here’s an animation which shows the amazing structure of the completely novel E Pacific “Equatorial-Jetstream”. Note the Lows driving it on either side of the equator in the tropical upper and mid-levels, plus the immediately adjacent Highs poleward and mostly east of the Lows which sink the 0.0% humidity air onto Southern Cali, Nevada and N Mexico (arid to desert), plus on Chile and east of Andes (cold dry desert). Why here? I have more to say on this but that will do, here’s the equatorial jet structure from 10,000 ft to 45,000 feet. It has no expression below about 15,000 ft due the convergence zone convection throttling it. But the dry air under it also throttles the convection (and I’m wondering if this feature will lead to a strong counter-wetting La Nina full of the precipitation that must be rained out via ENSO punctuation?).
Wild huh? That structure has been continuous and quasi-stable there for almost 8 weeks! Se how the north and south hem jets ‘cooperated’ to create it? i.e. when the stratosphere begins to sink in, in very high volume per unit time, this is what it does to enable that to occur most quickly.
My speculation on a mechanism:
The question now is, what is this non-visible ‘structure’ which has caused and directed this locked insitu stratospheric sinking pattern, which produced this extraordinarily stable structure in a jetstream flows over the Equator? I currently suppose such a ‘locked’ unseen mechanism controlling sinking in the stratosphere and troposphere, could only be due to a standing geomagnetic field anisotropy (probably a concentration of geo magnetic lines). Which then leads me to ask, does a quieter sun allow the geomagnetic structure to re-establish its full enchilada of features, and this generates this locked sinking stratospheric air? What if photochemical induced thermal variations are not the source of such sinking? What if it’s not thermal but geomagnetic controlled, once the solar activity level falls far enough for long enough, for its own structure to be expressed and have an effect on the stratosphere causing it to sink along ‘locked’ field-line concentrations? i.e. What if TSI and wavelength variation were not the mechanisms all along? And that ozone variation was a significant dynamic artifact of the process, but was not its cause?
Geomagnetism seems to be the best explanation of the emergent structures, so it has to be taken seriously as a cause of the sinking, if it controls the sites of the sinking, and probably is volume per unit time.
I’m interested in your take on that mechanistic proposition.
“ … I noticed this particular: “But in both hemispheres the 0.0% rh ultra-dry air sinks from there equatorward. It can be tracked sinking through several mechanisms. It almost always surrounds the fastest of the accelerated jets on the poleward side near the top of the jet.”
Which fits my hypothesis well because the descending warming air over the poles envisioned in my hypothesis pushes the polar tropopause downwards which then forces the upper troposphere beneath the tropopause unevenly outwards towards middle latitudes where it enhances the temperature differentials along the jet stream tracks. …’
Largely approximately the mechanism I found in the southern-hem polar cell region, yes, but it’s not at all true in the Northern hemisphere which behaves completely differently, due to the intense vertical wave activity over the northern polar region.
There are several other methods that the dry air gets to the ground, that are not closely associated with the subtropical jets, but more in full or almost full troposphere depth cold-core Lows and Highs, often in very close proximity, sometimes the Low is even inside the High, i.e. the Low drops out of the stratosphere to near sea level. But a high forms in the mid-levels around it and the dry air passes from the Low to the High between 24k ft and 18 k ft, then sink the rest of the way in the High’s divergent flow. In other words, it can come down really fast in high volume within this ‘venturi’-like pressure structure in under 24 hours. It’s a real eye-opener to see these operating.
Here’s one I made an animation out of several weeks back, the first image is my surface pressure display, the last image added on at 45k ft is the temperature, the rest is all rh with the ultra-dry air moving down the venturi into the surrounding High in hot-pink:
Is that not an amazingly rapid mechanism for sinking stratospheric air to ground level in hours?
“ … So, in my view the sinking stratospheric air over the poles is directly accelerating the speed and distorting the tracks of the middle latitude jets. …”
The jet tracks in Jan and Feb are held in place by the pressure systems either side, the Low on the polar side and the high on the equator side. So the question of jet path and intensity is one of what holds the pressures systems in place and regulates their intensity? I found it was the quasi-stable sinking points of the ultra-dry air than both fed and intensified these pressure systems. So the question of jet path control and locking became one of what controls the quasi-stable stratospheric air sink locations and their intensity?
If you know that, you know where the jet will be.
And what I noticed repeatedly was that the ECMWF forecast model itself constantly got the jet predictions right, because it fully models the key dynamics of both the troposphere and the stratosphere. The result is incredibly accurate jet forecasting, even during this entirely anomalous period. Indeed the animation I provided of the equatorial jet is a ten day forecast on Jan 24th (from memory) of what it would be doing on March the 2nd, and it was correct!
So the key dynamics that produced this equatorial jet behavior was already described properly within that Met model. Now that met model ‘saw’ something occurring within the stratosphere and correctly projected it to predict the locked jets and equatorial jets which them occurred.
So the wider mechanism of this process can be identified in retrospect from the observations and the model run’s interactions in detail. So I now want to know why the air sank in only these stable locations? What prior unrecognized structure in the stratosphere (and troposphere) controlling this sinking process and the locations of it?
“ … You also note that the energy released by the process eventually finds its way into the subtropical high pressure cells where the excess energy finally dissipates. …”
Well the ‘energy’ is mainly in and carried about by the jet’s much elevated speed, depth and volume. They are several time more energetic than prior, to the extent they can directly and strongly alter surface WX. One other thing I found was that the core of the strongest jets oscillated vertically by +/- ~7,500 feet. But +/- 5,000 feet was typical. This meant the very deepest jets could periodically reach all the way to the surface, especially over mountain terrains or an icesheet. Thus further generally amplifying upper-level vertical wave activity as well. And bringing cold blizzards, snow and record cold to surface.
Look at that thermal anom over Russia. At the same time as that was developing Saudi to central Asia had a horrible cold and massive snowfall event, that went on for a month, due to the ZONAL JET that was 2/3 of the way around the planet. So yeah, Russia got warm-ish in winter, but south of Russia got absolutely hammered by record snow levels and blizzards right under the pole side of the jetstream.
Living under these locked swollen super fast jetstreams full of ultra-dry air is an unfortunate place to be. And it can be unfortunate in any season too, as the sinking stratosphere does not respond to seasonal pattern, it overpowers and overprints them to the extent it can continuously and strongly alter the surface WX for literally months.
And we have no way of knowing how long this will continue.
I am a bit of a fan of Willis’s sustained skepticism about the Sun as an identifiable influence on WX patterns, but the past 3-months has changed that, I now see something he would never have expected.
“ … The jet stream track is where the increased energy crosses (via turbulent mixing) from the poleward stratosphere above the lowered tropopause and into the equatorial troposphere below the lowered tropopause. …”
I have seen little turbulent mixing, except for where the top of the very deepest jets strongly interact directly with the lower stratosphere, (where disturbance is high and does lead to mixed sinking down the pole side of the jet). Mostly the sinking and mixing is surprisingly pedestrian, laminar and not seen unless you specifically look for it with the ultra low rh display I created.
Usually the 0.0% rh air just enters the top of a full depth High, or full-dept Low and just sinks, then it mixes under a high in when it reaches the increased convection level below about 15k feet. By 3k feet most of it is mixes in to ~20% rh or so, where it loses its formerly stratospheric ‘identity’.
“ … You are watching the thermal effect of solar variability moving from poles to equator across the middle latitude jets. …”
At first I presumed it was a photochemical cumulative thermal change in the stratosphere that lead to a tendency for the lower stratosphere to sink. Now I suspect it’s not thermally-driven but does increasingly appear to be solar activity level related. So I’m now questioning that (since about 3 weeks ago) and looking at what seems to fit these observations of a locked structure, and the unexpectedly rapid, if not abrupt intrusion of stratosphere to near surface level. I would have expected a photochemical cumulative thermal driven sinking of the stratosphere to have a much more random, progressive and intangible nature to it. But this is structured, it’s rapid, and it’s high volume, and it kicked in suddenly during the last southern Spring, and accelerated and evolved quickly.
Thermal driven sinking just doesn’t seem to fit these characteristics.
“ … It is nothing to do with TSI changes but rather solar effects on upper atmospheric chemistry primarily involving ozone which is why the so called ozone hole has now largely recovered. …”
I do expect the ozone to continue to recover, but I interpreted it differently. As I saw it, the ice xtals that should have formed and had effect mostly sank into the troposphere, thus the lower stratosphere ozone was spared exposure to it during this Winter and Spring. And this will most likely continue if the sinking stratosphere continues, thus depletion of ozone will be less effective for as long as the sinking continues.
Note also in the animation of the sinking air which I provided yesterday that the bulk of pink sunken air is over the south polar region. This is where the sinking is the highest and the most orderly (least disturbed by wave activity).
Please excuse the typos Stephen, trying to get these replies done fast, but enjoying the discourse – cheers.
Lots to think about there so we’ll both have to keep watching developments.
A simple process such as that which I propose can play out in a highly complex fashion and at this stage I don’t see anything in your observations that is wholly inconsistent with my proposition.
” … There should also have been a recent increase in global cloudiness/albedo. Does anyone have recent data on that? … ”
I have nothing on albedo implications per-sec Stephen, but what I did find of some significance to you is this, an animation I created of OLR verses Relative-Humidity of ultra-dry sunken stratosphere at 0.0% humidity shown here in hot pink (from 0.0% and fading out at ~4.2% rh) that has fallen down through to the lower tropopause.
It has a very strong effect on OLR, plus clears the lower-troposphere of cloud to about 2,500 ft even above a tropical ocean surface.
Please see my remarks within this thread for the associated text and explanation of the animations creation:
http://joannenova.com.au/2020/02/tuesday-open-thread-5/#comment-2277429
PS: I also utilized this animation to help debunk some of the hard-core anti-DWLW-IR assertions getting thrown about lately which it does very nicely, as you can see.
“but don’t hold your breath”. That is exactly what the climate fraud brigade need to en mass in order to prevent the CO2 inherent in their exhaled breath. Do us all a favour and hold your breath fraudsters!
more conspiracy nonsense
Says the man who believes there is a “big oil” conspiracy and has attacked several people for being “big oil”.
Funny how those are nonsense but yours aren’t. I suspect there is enough stupid conspiracies on both sides that if we are going to call them out then they all need to be called out there are plenty of idiots on both sides.
New record winter average temperature for Moscow, for the first time above zero, +0.2 C.
https://twitter.com/ekmeteo/status/1233813154997600256?s=21
Can hardly blame “steam pipes” for this. Modern Russia is much more energy efficient than old Soviet, that really wasted energy..
Secondly, since Putinland is very dependent on oil and gas export, and are masters of cheating and deceiving, any kind of “collusion” would likely include down-adjustment of official temperature data, to downplay the global warming threat.
It seems if I want to export energy, I’d want others to believe in warming and thus put off energy investments like fracking.
Fracking has nothing to do with warming or increase of CO2 production. Anti fracking people are not willing to be cut off natural gas supply and they also have a comically illogical definition of the harms of fracking which extend to any damage with any use of the product of process. (Any legit definition would only include the damages done by the specific process itself.)
Russia just wants less fracking, but that cannot be integrated in any consistent anti CO2 narrative. That of course will not stop people like anti Trump French author Nicole Bacharan, our national reference in term of anti American ineptness.
A paragraph that accurately describes many if not most of NOAA’s alarmist pronouncements.
An independent investigation of NOAA ‘techniques’, ‘adjustments’, ‘management direction’ is long overdue. The investigation should be conducted by investigators knowledgeable in data management, programming and statistics.
ATheoK
If you don’t trust in NOAA’s temperature processing, you then shouldn’t trust in the Japanese JMA or Dr Ryan Maue either.
Both sources belong to the ‘coolest’ surface data processors ‘evah’: they show 0.14 °C / decade for 1979-2019, to be compared with UAH’s trend for the LT: 0.13 °C.
Ryan Maue was formerly a WeatherBELL.
Nonetheless, JMA means Jan 20 is warmest Jan on record (since 1891), and Ryan Maue puts it second warmest (since 1979 of course, it is a surface series using satellite background).
A chacun son avis sur la question, bien entendu.
Rgds
J.-P. D.