Guest Post by Willis Eschenbach
I keep reading all kinds of claims that the slight warming we’ve been experiencing over the last century has already led to an increase in droughts. A few years ago there were a couple of very dry years here in California, and the alarmists were claiming that “global warming” had put us into “permanent drought”.
Of course, the rains returned. This season we’re at about 120% of normal … it’s called “weather”.
In any case, I thought I’d take a look at the severity of droughts in the US over the last century. I always like to take a look at the longest dataset I can find. In this case, I got the data from NOAA’s CLIMDIV dataset. Figure 1 shows the monthly variations from 1895 to the present. Note that I’ve inverted the Y-axis on the graph, so higher on the graph is dryer, and down near the bottom is wetter.

We can see a few interesting things in this graph. As you might expect, the worst droughts were in the 1930s, the time of the “Dust Bowl”. There were also droughts in the 1950s, although somewhat smaller and shorter.
Then for about thirty years, from 1970 to 2000, times were generally wetter … followed by drier times up to 2010, and wetter times since then.
Next, overall there is a very slight and not statistically significant linear trend toward a bit more wetness.
Finally, it’s worth noting that if our data had started in say 1930, it would have a statistically significant trend toward wetter times … which shows that even 80 years of data may give a very different answer than we get from the 125 years of data shown above. This is why I use the longest dataset available.
In any case, according to NOAA, there’s been no increase in either droughts or wet periods in the US since 1895 …
And meanwhile, here on the northern California coast, it’s Christmas Eve, and a gentle rain has just begun falling … best of the season to everyone.
w.
Nice job Willis. I found exactly the same PDSI data already made up into an image which I used here along with detrended US precipitation data to tell the same story: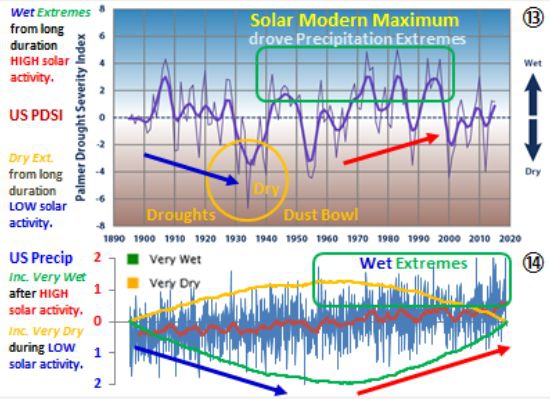
I show how the changing extremes resulted from long-duration solar extremes.
Am I reading this wrong, because the key says negative is dryer, and the recent trend is toward the negative (red)?
I hope this answers your question.
If the ‘red’ you are asking about is the red arrow, that is the overall trend to more ‘wet’ in recent decades. There is no overall change now towards ‘dry’ yet, which won’t change until the next La Nina, something similar to 2010-11, probably in 2021, to last a short year or so, +/-, until solar activity rebounds in SC25 driving ocean warming and evaporation higher again. The solar minimum low TSI has suppressed some evaporation.
The last PDSI datapoint shown is in the ‘wet’ zone, however, the graphic isn’t current; the recent data from their awesome webform indicates it went into negative, ‘dry’, in 2017-18, before rebounding into the ‘wet’ zone again. As an aside this resulted from changes in SST and in Nino areas and MEI.
http://www.cpc.ncep.noaa.gov/products/analysis_monitoring/enso_update/ssta_c.gif
Nino4 has been driving things lately, Nino3 less so, having consequences for evaporation, with less the closer to the US, and more further west, from Nino4, which tends to send more weather across the ocean to higher US latitude states, than the nearer Nino areas 1-3 that moisten the US SW and the midwest more. This is why there is often concurrent drought and deluges in adjacent states, due to the timing of ocean and sun cycles.
I did a post on just this for an Oz web site last week.
In my district in South East Queensland our records started in1887.
The driest year ever was 1994, a close second was 1902, third driest looks like being this year, & 1915 comes in 4Th. All the above at a little below half what has proved to be our long term average.
So in order of dry, 1994,1902, 2019 & 1915. it will take a twisted brain to fins a trend in that lot.
On the other hand our wettest year by more than 15 inches was 1893, then came 1947, 1989 & 1921. Again only a crazed warmist could find a trend in that.
Interesting to see the same result half a world away.
Thanks, Hasbeen. You have a link to your post?
w.
Willis
FYI re Australia
https://www.longpaddock.qld.gov.au/rainfall-poster/
The long term Australian rainfall trend is very similar – slight increase over 120 years:
http://www.bom.gov.au/climate/change/?ref=ftr#tabs=Tracker&tracker=timeseries&tQ=graph%3Drain%26area%3Daus%26season%3D0112%26ave_yr%3D5
I too live in SE Qld. I have been collecting rain measurements at my place since 2004. I have obtained rain data from official stations around my home one about 500 m from my place (now closed) and one about 5 kms closed in 2000 plus others 10 -15 km away. I have made statistically examinations of the two closest which I found had exactly the same average and standard deviation for each month. The one 5km away opened in July 1892 but the record is complete for 1893 so I have 126 year record. The driest year by far was 1902 at the height of what is called the Federation drought (Federation of Australian States was in 1901). The officially recorded rain was 519mm. The 2nd driest year with 849mm was 1957 and the 3rd driest year with 1084mm was 1979. The wettest year with 3997mm was 1898, the 2nd wettest was 1893 with 3849mm and the 3rd wettest was 1998 with 2882 mm. The average rainfall over 126 years is1800mm, so far this year we have had 1314mm but it s raining tonight.
It should be noted the rainfall distribution is close to a Poisson distribution whereby the the average is almost equal to the standard deviation. The highest rainfalls for each month are about 6 standard deviations. The lowest for any month of course is zero. The highest rainfall for any month in SE Qld was Feb 1893 when there was a cyclone called the Mooloolah Event. At my place the record was 1819mm with a little over 1.1m falling over 3 days.
At my place in SE Qld 1994 had 1718mm of rainfall so it was close to average. This year has had below average rainfall with drought in Qld but is no where near the lowest.
If someone is interested in Australian rainfall over the year look at the posters on this government site https://www.longpaddock.qld.gov.au/rainfall-poster/ . I suggest it is very instructive to look at the charts of the SOI and IPO for each poster series. I think the records of SOI go back to 1850. SOI is an indicator of El Nino and La Nina which affects rainfall in Qld. Australia and in California USA (and of course Mexico) I have been recording daily SOI now for many years. I am interested in how the daily figures cycle with the moon cycles and tides in Darwin. To my understanding there has been no fiddling with with the measurements at Darwin and Tahiti
“In my district in South East Queensland our records started in1887.
The driest year ever was 1994”
No, the driest year since 1887 was 1994. “Ever” doesn’t mean since 1887.
Yew spelt “evah” rong.
Since Evah.
Full stop.
Mediation is the ground principle of Sharia, that’s what friends are for:
https://www.google.com/search?client=ms-android-huawei&sxsrf=ACYBGNQODiKSX_HJcrekq-2f95V88RUrPQ%3A1578403203039&ei=g4UUXrGUAoiFmwWh2r3ADQ&q=that%27s+what+friends+are+for&oq=that%27s+what+friends+are+for&gs_l=mobile-gws-wiz-serp.
One can also corroborate such droughts index data against Sierra Nevada and Rocky Mountain snowpack data.
Another notable from the graph is just how spikey the original yearly extremes are, so often only lasting a year or two and then plunging in the opposite direction and registering at the other extreme. There is no persistence upon which to base a pronouncement of ‘permanent’ anything, except an impressive short-term variability of precipitation (that is, weather).
Yet former 4-term Governor Jerry Brown declared that CA was locked in a permanent ‘drought’ (a word with no scientific definition) and therefore government policy HAD to change. Build more reservoirs ? Don’t be silly. No, the government solution was to have the CPUC to RAISE everyone’s water rates! Never let a good climate ‘crisis’ (read: permanent climate ‘crisis’) go to waste. We get the government we deserve … and the lack of education we deserve … here in CA
Not more than a few weeks ago, the weathercasters on the Weather Channel were wringing their hands over a drought in the southeast U.S.
They haven’t said anything about a drought lately because it has been raining “cats and dogs” in the southeast U.S. And more is coming. Next, they will be telling us it is too much rain because “climate change”.
Tom – No drought anywhere in in CA, not even abnormally dry.
https://droughtmonitor.unl.edu/
I spent a summer in Georgia in `73 and everyone was complaining about the drought. It hadn’t rained in 2 weeks. I just laughed. In ‘wet’ Oregon 8 straight weeks of no rain in the summer is nothing unusual.
Old joke – in England, more than two weeks without rain is usually called a ‘drought’. Actually, dry weather exposes the lack of reservoirs in the country.
Just as in my home of South Africa. But then, the droughts (often on a 10-15 year cycle) are almost invariably followed by flooding. Now, if Africa learned from the Israelis how to make use of a drought/flood cycle, it might do the country some good. (But no – Israel – scream -apartheid – scream).
I agree with you. We are wired to find patterns. Sometimes we find patterns when they don’t even exist.
There is nothing (null) that has happened with weather and climate recently that is out of the ordinary. Certainly, atmospheric CO2 concentration is rising, although at a lower rate than it should be given our consumption of reliable energy.
Now I must get breakfast as Jesus might have left a message for me on a piece of toast.
“I agree with you. We are wired to find patterns. Sometimes we find patterns when they don’t even exist.”
We also like to average everything together to present a nice “neat” picture, in many cases when it’s not appropriate to do so.
Jeff – you may also have wondered why Willis used a 14-yr gaussian average. I wonder what 5, 7, 11, or 17 would look like?
Brilliant!
As always.
Thank you
My drought study was a response to the claim that climate models predicted drought in the southwest usa. Here it is
https://tambonthongchai.com/2018/11/22/agwdrought/
The Southwest US is mostly desert. Drought is the norm.
At what point can we call Hansen’s man-made CO2 global warming/global drought conjecture from the 1980’s disproven?
I would imagine that you can’t. It’s being stored and will be worse than expected when it happens.
With the warming atmosphere, there has been an increase in specific humidity. link
From the link above, the trend is 0.1 grams of water per kg of moist air per decade. Of course, we have to know what that compares to. “the average specific humidity ranges from 0.004 kg/kg at 60 degrees (north or south) to 0.018 kg/kg at the equator.” link So that’s something like 4 grams per kg of air to 180 grams per kg of air.
For ease of arithmetic I will take a global value of 100 grams of water vapor per kg of moist air. That makes the trend something like 0.1% per decade. It’s a small trend and probably within the error bars.
Anyway, it doesn’t look like the moisture in the air has been significantly decreasing. That matters because the more water vapor there is, the more water can fall out as precipitation. So, we wouldn’t predict more droughts for that reason.
It’s not obvious to me why ‘they’ would predict more droughts in a warming climate. The high arctic is much colder than most of the globe. The air can’t hold much moisture because of that. Unsurprisingly, the high arctic is basically a desert. It really doesn’t snow much there compared the precipitation nearer the equator.
Excerpt:
“the average specific humidity ranges from 0.004 kg/kg at 60 degrees (north or south) to 0.018 kg/kg at the equator.” link So that’s something like 4 grams per kg of air to 180 grams per kg of air.
Nope. 0.018 kg/kg means 18 grams per kg air but surprisingly your result is correct. The trend is really +0.1% per decade.
What would be more important to know is the trend of the relative humidity.
Groan. I’m not sure if it was a typo or a brain fart.
If we guess at an average 10 gm/kg, and the change is 0.1 gm/decade, that’s 1%.
If you’re old like me, it really doesn’t matter!
I thought higher CO2 created a runaway atmospheric water vapor feedback loop?
I suppose Mann-made global warming dogma has an explanation for this, but I cannot recall hearing what it is. If any increase in CO2 induces a positive feedback from additional water vapor which would warm the oceans and release more CO2, and thus induce even more water vapor, why indeed should this not immediately result in runaway warming, eventually boiling the oceans? If their faith were true, any natural perturbation slightly warming the planet should turn it into Venus.
It occurs to me that this is why they need to claim that volcanic eruptions have a large and persistent cooling effect from aerosols that lasts longer than the data actually supports. Apart from serving as a convenient deus ex machina to explain natural cooling periods that would otherwise call into question the CO2 control knob theory, if eruptions didn’t invoke their magical cooling spell, warmists would have another paradox to explain. Namely, why do large eruptions spewing CO2 not trigger runaway warming?
Of course in the real world, water vapor can provide a negative feedback through clouds that increase albedo, not unlike the cooling effect of aerosols that the warmunists acknowledge.
We could argue that it’s logical for there to be a slight increase in rainfall when there has been a slight increase in temperature. Yet during the 1930s in the midst of a warming trend, we had the driest period in the US. Weather is complex and no simple answers hold up to scrutiny.
Oops, my comment under Tom’s was for you Rich; I also agree with his points.
.. still looking for that obvious nitrous-like CO2 boost to temperature.
Rich Davis says: “If their faith were true, any natural perturbation slightly warming the planet should turn it into Venus.” In their faith, what you say is profane!
No, we’ve had millions of years of natural perturbations, the CliSci says, and it never sent the oceans to boil. It’s not the natural, it’s the man-made spit-in-the-ocean perturbation that’ll set off runaway GW. Natural = good, man-made = bad. Plus, there are no natural perturbations, the climate was the same until man (“bad”) changed it (so forget what I just said). And we are (gasp) warming it, when we know everyone prefers cold.
“I thought higher CO2 created a runaway atmospheric water vapor feedback loop?”
Yes, that’s what the alarmists claim. CO2 is supposed to warm the oceans which will cause the evaporation of water and the water vapor will enhance the greenhouse effect to the point that the Earth experiences a Runaway Greenhouse Effect.
Meanwhile, CO2 concentrations are increasing in the atmosphere, yet the global temperatures are cooling.
CO2 concentrations were also increasing during the period from 1940 to 1980, yet the temperatures cooled during that period to the point where some climate scientists were predicting the Earth might be entering into another Ice Age.
Apparently, CO2 in the Earth’s atmosphere doesn’t work the way the alarmists think/predict it works.
… if eruptions didn’t invoke their magical cooling spell, warmists would have another paradox to explain.
You raised interesting points – and to further take away their aerosol argument:
CO2 may or may not cause more rainfall. Truth seems to be that no one, not even true believers in climate temperature modeling, believes that climate model precipitation models are useful for anything. And even if there is more rain (and snow) in some places than at present, that doesn’t mean that some other places won’t be really dry.
FWIW, There is reasonably plausible paleo data that suggests that part of the medieval warm period were really dry in California (roughly AD900 to AD1100 and AD1200 to AD1350). But AD1100-AD1200 may have been quite wet.
So, I wouldn’t take current climate modeling very seriously. It’s becoming increasingly clear that those folks currently probably don’t know what they are talking about. But that doesn’t mean that century long droughts in California, the American West in general, and other parts of the world as well aren’t possible with or without help from CO2. It’s (probably) happened before. https://www.nytimes.com/1994/07/19/science/severe-ancient-droughts-a-warning-to-california.html
Having a plan to deal with long droughts (other than running about spouting nonsense) might not be a bad idea. But I don’t expect it to happen — unless/until it stops raining for a decade or three.
Jean Parisot
[ ] thought higher CO2 created a runaway atmospheric water vapor feedback loop?
____________________________________
Again here’s the problem with the “miraculous, unseen propagation”,
this time parallel evolving AND durable upholding both:
Miraculous propagating of temps, rel.humidity, water vapor …
in lockstep with rising winds, storms – wait:
Developing water vapours in thunderstorms are really new phenomena!
Jean Parisot
[ ] thought higher CO2 created a runaway atmospheric water vapor feedback loop?
____________________________________
Again here’s the problem with the “miraculous, unseen propagation”,
this time parallel evolving AND durable upholding both:
Miraculous propagating of temps, rel.humidity, water vapor …
in lockstep with rising winds, storms – wait:
Developing water vapours in thunderstorms WHILE in droughts are really new phenomena!
Willis here’s the Aussie BOM rainfall anomaly graph from 1900 to 2018, with a 7 year moving average line.
Overall we receive higher rainfall today, but Nth OZ is higher while SE, SW WA ,Victoria and Tassie have had reduced rainfall over the last 30 years or so. There have been less neg IODs in the Indian ocean that usually allows more rainfall to reach SE Australia etc.
Of course very heavy rainfall in Australia in 2010 to 2012 ( neg IOD and la nina) that even caused a big drop in the satellite MSL graph of Uni Colorado. See ref online of this at the time.
http://www.bom.gov.au/cgi-bin/climate/change/timeseries.cgi?graph=rranom&area=aus&season=0112&ave_yr=7
a dear and sadly departed oldtimer friend of mine, had family who lived in this area for some generations
he said hed hoped to be around to see all the newbies growing grain for the last 20= yrs discover just how their land reverted to swamp in the wet times
and we sure did in the 2 yrs of heavy rains 16 n 17
original settlers here tried sheep and foot n fleece rot soon ruined that
cattle do better if you have some high ground in the wet yrs.
but a hell of a lot of sodden paddocks for months sure showed me how lowlying many areas are.
Joe D’Aleo at Weatherbell (paywall) put up a short essay on the solar minimum influence on Australia.
He referenced a study by Will Alexander on the Vaal River flows indicating the flow was very low in the three years leading up to the solar min and abundant in the three years following the solar min. This applied in every case going back to 1932/33.
The basic cause was the stratwarm over Antarctica that forms during a min causing a negative AAO. So as we move out of the solar min in the next couple of years you should experience less hot/dry and go into more beneficial rains as the AAO flips positive.
Thanks, rbabcock. The Vaal River? Been there, analyzed that.
w.
Pardon me while I crawl back into my cave….
I am always amused at willis
“I keep reading all kinds of claims that the slight warming we’ve been experiencing over the last century has already led to an increase in droughts. A few years ago there were a couple of very dry years here in California, and the alarmists were claiming that “global warming” had put us into “permanent drought”
You know there was another guy who had a habit of doing this…. gavin Schmidt. Lucia took him to the woodshed over it.
‘people say” “someone said” its been said… blah blah blah, freshman english 101.
cite your sources. especially if you have a penchant for demanding that your words be quoted.
Now ya’ll will hit google to search and MISS THE POINT. it doesnt matter what “someone” said or ‘what you read”
Like always I am not interested in ‘what people say” or what ‘some alramist said”
you can catch all sorts of people saying dumb stuff.
I heard a skeptic, he said c02 was not a GHG.. therefore.. what?
Me? I wanna know. whats the science say.
https://wg1.ipcc.ch/presentations/Sbsta_drought.pdf
• Drought is a complex phenomenon affected by changes in the hydrological cycle and producing a web of impacts across many sectors and potentially
leading to land degradation and forest dieback ;
• The IPCC AR5 (2013) stressed low confidence in a global-scale observed trend in drought, owing to lack of direct observations, dependencies of
inferred trends on the index choice, as well as difficulties in distinguishing long-term climate change from decadal-scale drought variability ;
• Recent years have shown substantial methodological developments to monitor and assess drought in a changing climate”
Now I dont want to know what the science says because I will just “believe it”
Nope. Its pretty simple. I wanna see where to start the reading. And check out the bibliography
california? some people said…. blah blah blah. you can catch dummies saying all sorts of shit
No need to cite strawfolk when the science says this
‘California: rainfall deficit linked to
natural variability, water stress enhanced
by warming trend (Griffin et al, GRL, 2014 ; Williams
et al, GRL 2015 ; Diffenbaugh et al, PNAS, 2015 ; Cheng et
al.,2016, J Clim) ;
“• Low confidence in an observed global-scale trend in drought or dryness (lack of
rainfall) since the 1950s, due to lack of direct observations, methodological uncertainties
and choice and geographical inconsistencies in the trends ;”
High confidence that the frequency and intensity of drought since 1950 have likely
increased in the Mediterranean and West Africa (although 1970s Sahel drought dominates
the trend) and likely decreased in central North America and northwest Australia ;
• Lowconfidence in attributing changes in drought over global land areas since the mid20th century to human influence owing to observational uncertainties and difficulties
in distinguishing decadal-scale variability in drought from long-term trends ;
• High confidence for droughts during the last millennium of greater magnitude and longer
duration than those observed since the beginning of the 20th century in many regions.
Now ask yourself
you are in a fight with an alarmist. a knock down drag out tongue war on twiiter
what do you want to do? Go look at one dataset which tells you a story about 1.5% of the earth?
or point them at the IPCC and tell them their quarrel is with the science, not you
this is a handy little trick. Most of the alarmist shit you read ( No ice, no snow, droughts) is actually NOT WHAT THE SCIENCE SHOWS.
Find it hard to understand this? If some said, “Christ said X” wouldn’t you just whip the bible?
If a liberal said, “the founding fathers said x” wouldnt you just throw the federalist papers at them?
Next time an alarmist says “The science say there will be no snow”
ask for a citation.
pretty easy.
and if you want to be sarcastic tell them you are doing like Great said.. listen to the science.
Drought? not so clear what is happening.
well even I remember your media running the supposedly from the nasa or other gurus rabbiting on about a 300yr drought and the hype
it was even run as news(ha ha) downunder when Cali was dry
oddly when it snowed n rained and the dams filled we heard F all about that!
you youself would have seen nread the same crap so whinging about Willis not linking is just being a brat.
I can’t remember a single prominent climate “scientist” going public with complaints about these so called exaggerations.
This is the perfect scam. They generate the panic and enjoy the resulting flood or research cash.
Then when the predictions fail, they get to claim, we never said that.
That”s the whole game in a nutshell Mark, well noted.
Well, instead of coming on here and complaining about us complaining about the hype that comes from Hansen and the Californian Democrats and the eco-nut activists and Extinction Rebellion and Gutierres and Greta Thunberg, you might like to do something constructive and point out to them that their exaggerations are just that.
There is currently no discernible trend in extreme weather, floods, droughts, tornados, tropical storms, melting glaciers, trace gas concentrations or any other climate phenomena which is outwith what the planet has previously and repeatedly experienced in the course of several millennia.
If there were “tipping points” they would have happened millennia ago. The climate argument has decayed into nothing more than a fairy story to frighten the children and the best and only needed proof of that is quite simply stated:
If the environmental activists and their useful idiots truly believed the rubbish they spout they would a) behave as if they did, b) be demanding a major switch to nuclear power for electricity generation as the one, guaranteed method of reducing CO2 emissions. They fact that they are equally opposed to the one thing that more than any other would give them what they claim to want speaks volumes!
Merry Christmas, Steven. And a more honest New Year, please!
Mosher writes
I dont think you understand how public perception and social media works.
I agree Tim.
“Alarmists” are either those creating the alarming statements or those repeating the alarming statements.
The overwhelming majority are the second type and they have no clue what the real science says.
Their answer to that request for a citation:
“Well, Al Gore said!” /grin
How is it that an English major refers to “english 101”, while berating someone for, what exactly?
This is a typical red herring from the resident sophist.
Fun fact, did you know that Pocahontas Warren’s maiden name is Herring? Now that’s a Red Herring!
Mosher
Except California is passing laws and Tax increases based on this blah blah blah. So I agree you don’t understand how public perception works.
Arthur Schlesinger: “Ignorance is never any bar to certitude in the progressive dreamworld.”
They will not listen to science because they know that 97% of scientists agree with them. We may know the truth but they do not want to listen.
I use Willis’ posts as education for me.
Steven, you are a smart man, so you know very well that Willis was writing in a popular style, for non-scientists like me, who are very aware that there are many people who have claimed that drought in California (indeed, any meteorological condition anywhere) is caused by climate change. I suspect that’s wrong, but don’t have the time and skill to disprove it. Willis does, so he provided information that is helpful to me and others like me. The opening of his piece merely sets the stage for what he is doing; it was never meant as a summary of every climate scientist’s thinking about drought.
You know all that. So why pick at stylistic nits, instead of responding to the gist of what he is saying?
I sort of agree with Mosher here, but with a caveat the size of Kansas. When using ‘they say’ as a predicate, it does generally make sense to note who ‘they’ is except when such a claim has been so widespread and persistent to have lead the Governor of the state to make the pronouncement himself. It would be sort of like demanding of a flat-earther who begins with “They say the Earth is round” and you leaping in to demand “WHO says that!?”
Exactly. And another reason for that rhetorical device is not to dignify the twit by naming them. The relevant data was cited. The argument would stand on its own if Willis had simply omitted any comment about “they say”.
“this is a handy little trick. Most of the alarmist shit you read ( No ice, no snow, droughts) is actually NOT WHAT THE SCIENCE SHOWS. ”
Well, OK then.
The best ever product of egg nog. Happy New Year!
So, Mosher. the next time you post a two-liner drive-by with no references, we can call you on it. Of course you won’t respond, that’s what trolls do.
Unless every single climate “scientist” says exactly the same thing, word for word, when the predictions fail, then no climate scientist ever said that.
“Drought? not so clear what is happening.”
I’m pretty sure that was the point Willis was making.
Whoo boy. I’m guessing grumpy Mosher received only a lump of coal in his stocking… again.
First, from English 101, “I am always amused by Willis” is a better preposition choice than ‘at’.
Then Mosher, the master of the cryptic 2 sentence drive by, berates Willis for not ‘citing sources’. Finally, in a pirouette of personal pique, Mosher cites the UN-IPCC, the propaganda arm of the single largest rent seeking political organization on the planet, as his source for unbiased ‘science’.
Bad boy…..
Oooh that’s gonna leave a mark!
Steven Mosher December 26, 2019 at 2:38 am
Steven, I assure you, the feeling is mutual. You continue:
Steven, I am writing for the educated layman. I expect that they, and you, will have seen lots of claims from scientists like the following:
Source? Dr. Michael E. Mann
From 2009:
Source? Dr. Gavin Schmidt
Nor is this a new phenomenon. Here’s Dr. James Hansen pushing the same story back in 1988:
I see below you advise getting science from the IPCC. From AR4 WG2:
Oops …
Then we have politicians, who claim to be following their scientific advisors, saying things like:
But lets return to scientists. Here’s Dr. Tim Osborne:
Dr. Giorgio Vacciano:
How about the Hadley Center, a bunch of scientists there …
I can find DOZENS of those if you’d like … but as I said, I had expected that people have seen so many of them that they would be aware of what I’m referring to.
You continue:
Steven, particularly in the public debate, what the science says is what Dr. Michael Mann and Dr. Gavin Schmidt and Dr. James Hansen and Dr. Tim Osborne and the Hadley Centre have to say. “Science” can’t say anything, and I’m quoting what the scientists say. And as I said above, the IPCC said that climate change would lead to droughts affecting up to 250 million people.
You go on:
If it is NOT WHAT THE SCIENCE SHOWS, Steven, then why are Dr. Mann and Dr. Schmidt and Dr. Hansen and the Hadley Centre scientists saying the exact opposite? YOU are the one with a “handy little trick”. When dozens of prominent scientists are out there whipping up the alarmism, when it’s being repeated in the media as gospel truth, you calmly say “But on page 632 of the IPCC report that nobody reads, it says something a bit more measured …”
So what? You still don’t get it. When the leading SCIENTISTS are making claims, that IS what the science says, because it is what prominent scientists are telling us over and over. Heck, try this one on for size. Here’s Dr. Michael Mann saying we should NOT trust the IPCC reports …
And meanwhile, the IPCC is also saying things like:
and
So I fear that you pointing to some obscure few sentences in the IPCC report is NOT what “science says”, to use your term. What science says is, inter alia, what scientists say. And far too many of the leading climate scientists are hyping alarmism about drought.
You finish your comment with:
Let me go back to the top of the post. What I ACTUALLY said was NOT “the science says” … that’s the voices in your head. “Science” can’t say anything, only scientists can.
What I actually said was:
And that, my friend, is 100% true, including claims by the most well known and visible climate scientists. Here’s a typical sample of how that plays out in the press, a headline from the Guardian
Funny … they quote the IPCC just like you. And if you want something more authoritative, here’s the National Geographic take on the question:
Damn IPCC keeps cropping up, and NOT in the way that you claim …
It is that kind of misinformed “all kinds of claims” that increases in drought are already happening and “will get substantially worse” I was referring to, and no, you don’t get to pretend that such claims are NOT being both made by and ascribed to scientists and the IPCC.
w.
PS—The journals are not immune to this by any means:
Again, I could provide lots of these, but perhaps foolishly I’d assumed that people were aware of these types of claims … although in your case I guess I was wrong.
Beautiful response Willis – facts, Mosher, facts.
Indeed. THAT was a take down. And some ground and pound.
The complete list of all the categories of extreme/dangerous/catastrophic events that have not been attributed to Climate Change by Climate Scientists:
1.
Never mind.
Oofda! That may be the best climate take-down EVAH!!
Mosher is a smart fool. Too many of his type in this world, sadly. Folks like him think THEY should be “the government,” damn electing people who actually make laws. Much better if smart folks untouchable by elections, like the EPA, make the laws. Much more sensible…. /sarc
Aah, the magik werdz!
I love hearing the magik werdz!
“Which ones are they?”, you may ask.
These ones: “…the science says…”
Anything which comes after this ridiculous phrase can be ignored.
And by logical extension…anything before them, too.
Happy holidays, Willis, and thanks for the post.
Regards,
Bob
Weather, water cycle, and 19 million acres of US farm land under water will not be available for early planting.
World food shortages and rationing are in your future.
https://www.youtube.com/watch?v=TvnkxRISycA
And of course global warming is the culprit not normal weather cycles.
The swath of yearly rainfall records setting at 125 from the Dakota’s, Minn, Wisc & Mich for this year.
In the 120’s are Nebr, Kan, Missouri, Ark & Tenn.
Oh, 125 is the how many years of record they have.
South Dakota was special in that it set the 3 mo, 6 mo & yearly record.
Ground supersaturated still.
With regard to the dreadful wildfires in Australia, I was amazed to hear the following from a lady volunteer interviewed on tv (without comment from the reporter):
‘Oh, I’ve been helping out for 58 YEARS during the FIRE SEASON….’
But…. I thought it was all NEW and caused by CLIMATE CHANGE….??
What should really jump out to all readers here is not so much the long term (125 year) trend, but the tremendous variability from year to year and decade to decade. Droughts and very wet periods – anti-droughts? – are real phenomena, and they create very large impacts on affected populations in terms of food production, floods, fires, etc.
Of course, this is something virtually all human populations since the advent of our species knows collectively quite well – our histories, our stories, our myths, and our actual personal experiences all confirm this.
The good news, of course, is that modern technology and globalism have tremendously isolated most humans from the catastrophic effects of such droughts and anti-droughts. Humans are extremely adaptable, through collective action, which of course is something none of the climate alarmists will ever ever ever acknowledge.
Even in prehistoric times our human ancestors managed to survive multiple glaciations and interglacials. Why don’t the alarmists ever acknowledge that? We know the answer – it completely blows their theories to hell and gone.
On the subject of the drought in Eastern Oz, the region recently affected by disastrous bushfires…
Sydney’s driest years were, in order, 1888, 1862, 1968, 1941, 1957, 1980, 1880 and 1936.
Brisbane’s driest? In a long record back to 1840 with a few gaps, the driest years were, in order, 1902, 1919, 1957, 1936, 1923, 1993, 1865.
If you look at old inland records you’ll find 2006 was extreme, as were 1944 and 1902. In my area between Sydney and Brissie the driest year will probably be this year…but the record is still held by 1902, beating out 1915.
We can only guess how dry it got in the late 1830s drought which stopped the Murrumbidgee. But to do that would take a lot of very dry weather over a lot of territory.
Willis graph of “dought” index is a bit confusing since he drew it upside down. However, it does show 30’s high temps were matched with drought. 1950-75 cooling matched increasing wetness. 1980-2000 warming matched increasing dryness.
The thing which is odd is that the 30s was much drier, yet the current manipulated temperature records have progressively warmed the present and cooled the past to the point that 1930s is cooler than the present ( which was not the case in 1998.
Maybe the alarmists need to “correct” the drought data too or stop claiming that warmer is drier. You can’t have you have it both ways.
Maybe someone would like to plot drought and temps on the same graph using pre-rigged temp data.
Your beef is surely with PDSI. It seems counter intuitive that the parameter of interest should have a negative relationship with applied value – the more negative the value the more severe the drought.
The parameter should be called drought mildness (not severity)!
Willis at least makes the graph more intuitively indicate drought severity being peaks rather than troughs although of course the axis parameter sign remains.
According to NASA paper of a couple years ago the 1930’s drought was the worst in 500 years in NA. They suggest it was caused by persistent La Nina (cool) conditions in the Pacific. This they theorized caused the jet stream which brought moisture from the Gulf of Mexico to west-central USA to shift southward depriving it of rain. So the question is was the high temperatures of the 1930’s associated withe drought at all?
“So the question is was the high temperatures of the 1930’s associated with drought at all?”
That is a very good question.
Very interesting graph, crept up again. Not generally known but —-
“Unmistakably, the most calamitous drought to strike Texas in recorded weather history was the severe-to-extreme drought that afflicted every region of the state in the early and mid-1950s.” (Bomar, G. W. 1995. Texas Weather. University of Texas Press 2nd Ed., Revised. 275 pp.)
“However, as far as Texas is concerned the extended period of the drought from 1950 through early 1957 was more severe than in the 1930s.” (Griffiths, J. F. And G. Ainsworth. 1981. One hundred years of Texas weather. Office of the Climatologist.. Texas A & M. University Monograph Series. 1:1-205.)
Some put the beginning earlier, 1947 or 1949, as I experienced later with bay salinities. Texas is so big it depends on how you define drought, but 1954 through February, 1957 were bad everywhere, then the flood came. (Hoese, H. D. 1960. Biotic changes in a bay associated with the end of a drought. Limnology and Oceanography. 5:326-336.)
Here’s the link: https://aslopubs.onlinelibrary.wiley.com/doi/abs/10.4319/lo.1960.5.3.0326
Lots of detail on this drought in the digitized NY Times https://timesmachine.nytimes.com/timesmachine/1948/01/31/issue.html.
Nice article, Willis!
The morning after Christmas was white here in the north Mojave Desert. It’s now warmed just enough to be really cold rain and we are over an inch of rain since the start of the storm 8 hours ago!
I like all of your posts, Willis.
This winter, unlike the last 35, I decided to stay in the Great White North. All those years of tooling around California has taught me one thing for sure. If you take a warm, semi arid climate and artificially water that area for decades, then put out all the forest and bush fires……..always, then put houses right in the middle of that environment and encourage the tree and plant growth around your house…..it will burn……sooner or later. Drought or no drought you will burn.
I’ll use Steven’s words to launch a tangential peeve.
Many articles, whether from climate types, archaeology, human migrations (peopling of the Americas) — ‘people say” “someone said” its been said… blah blah blah, – –
– – claim a result bigger, longer, smaller “than previously thought”. [ or previously ‘believed’ ]
Many times I had not “believed” what is offered as someone else’s belief. And mostly I never know who thought what or why.
Greenland’s ice melting faster than scientists previously thought – study
That one is from The Guardian.
Cacao originated 1,500 years earlier than previously thought,
From Ancient – pages – dot – com.
“Lack of evidence …” and all that.
Not only is there no trend in drought conditions, there is also no trend in temperatures since 1995 in the continental US according to USCRN data, though other data sets show wildly varying amounts of CONUS warming.
Willis has handed silly Mosher one of the best beltings I’ve seen in a long, long time.
But a disingenuous fool like Mosher won’t have the wit to understand most of it. But he will wonder why his backsides hurts so much when he tries to sit down.
Like the old saying says…..” if he had another brain it’d be lonely”.
Neville December 26, 2019 at 3:45 pm
Neville, I disagree strongly. Mosh is neither silly nor disingenuous. He’s actually a very smart guy. We disagree on a number of scientific topics, and his habit of drive-by postings of two or three sentences drives me mad … so what?
He bats me down, I bat him down, we disagree strongly at times … but generally neither of us take offense at that, and if we do, we forgive each other our trespasses and somehow remain friends.
So please, I ask of y’all, beat on his science all you want, but don’t ever make the mistake of thinking he is foolish or silly—he’s a firm believer in the scientific method, and he’s handed me my head on a platter more than once …
Best holiday wishes to all, including Steve.
w.
In calgary I would very much like to get some warning as lately it’s tough for the garden to finish up, such cool and wet summers and falls
Need some heat baby
plastic film covered greenhouse
search ‘Images” for the above
Well, my understanding is that wetter areas will become wetter and drier areas will become drier. I assume the US has wetter areas and drier areas, so showing a graph of the totality of the US doesn’t really tell me anything about how the wetter and drier areas are faring under global warming. So can you check the data for different regions, and get back to us?
Mike Roberts
Fair point. Willis started off talking about claims of drought in California but the data he showed is for the US as a whole. I downloaded the data for California from the link provided and it looks rather different from the US as a whole. In particular the 14 year average (as selected by Willis) takes a sharp downturn (towards drought) centered ~2000. Isn’t the US large enough to focus on changes in large states like California or climate regions? If, say, it’s been getting much wetter in one half of a large region and much drier in the other half, then averaging both would have the effect of appearing to cancel that out.
Thanks for checking that, TFN. Indeed, it would appear that Willis may have jumped at the data for the US as a whole because it supported his view. This may be a salutory lesson. Let’s look at the data properly, instead of cherry picking it. Don’t we want to know the real story? If not, why not?
After this latest storm San Diego is about 245% of normal for the date. Impressive start to the wet season.
Before Thanksgiving it looked like California was heading back towards drought. It was technically “Abnormally Dry (D0)” conditions. Now it’s not. There’s a small area of D0 conditions up by the Oregon border but the rest of California is doing well as is the snowpack.