SUNSPOTS BREAK A SPACE AGE RECORD:
Solar physicist Dr. Tony Phillips writes via email:
Solar Minimum is officially “deep.” 2019 has just broken a Space Age record for days without sunspots. Moreover, an international panel of scientists led by NOAA and NASA predicts that Solar Minimum could deepen even further, not reaching its lowest point until April of 2020.
Solar Minimum is becoming very deep indeed. Over the weekend, the sun set a Space Age record for spotlessness. So far in 2019, the sun has been without sunspots for more than 270 days, including the last 33 days in a row. Since the Space Age began, no other year has had this many blank suns.

The previous record-holder was the year 2008, when the sun was blank for 268 days. That was during the epic Solar Minimum of 2008-2009, formerly the deepest of the Space Age. Now 2019 has moved into first place.
Solar Minimum is a normal part of the 11-year sunspot cycle. The past two (2008-2009 and 2018-2019) have been long and deep, making them “century-class” Minima. To find a year with more blank suns, you have to go back to 1913, which had 311 spotless days.
Last week, the NOAA/NASA Solar Cycle Prediction Panel issued a new forecast. Based on a variety of predictive techniques, they believe that the current Solar Minimum will reach its deepest point in April 2020 (+/- 6 months) followed by a new Solar Maximum in July 2025. This means that low sunspot counts and weak solar activity could continue for some time to come.

Solar Minimum definitely alters the character of space weather. Solar flares and geomagnetic storms subside, making it harder to catch Northern Lights at mid-latitudes. Space weather grows “quiet.” On the other hand, cosmic rays intensify. The sun’s weakening magnetic field allows more particles from deep space into the solar system, boosting radiation levels in Earth’s atmosphere. Indeed, this is happening now with atmospheric cosmic rays at a 5-year high and flirting with their own Space Age record. It’s something to think about the next time you step on an airplane.
Source: Dr. Tony Phillips, Spaceweather.com
The ice caps melt in summer ’til september and regrow ’til mach, and they grow more than in 2007 and 2012.
And there are melting glaciers and growing glaciers.
Krishna Gans
“… and they grow more than in 2007 and 2012.”
Wrong.
Here are the monthly data since 2007 (year, extent, area, sum, departure wrt 1981-2010)
– for September:
2007: 4.27 2.82 7.09 -3.75
2008: 4.69 3.26 7.95 -2.89
2009: 5.26 3.76 9.02 -1.82
2010: 4.87 3.34 8.21 -2.63
2011: 4.56 3.21 7.77 -3.07
2012: 3.57 2.41 5.98 -4.86
2013: 5.21 3.78 8.99 -1.85
2014: 5.22 3.74 8.96 -1.88
2015: 4.62 3.42 8.04 -2.80
2016: 4.51 2.86 7.37 -3.47
2017: 4.8 3.3 8.1 -2.74
2018: 4.71 3.3 8.01 -2.83
2019: 4.32 3.13 7.45 -3.39
– and for March:
2007: 14.54 12.56 27.1 -1.53
2008: 15.18 13.53 28.71 0.08
2009: 14.98 13.43 28.41 -0.22
2010: 15.14 13.53 28.67 0.04
2011: 14.55 12.83 27.38 -1.25
2012: 15.2 13.41 28.61 -0.02
2013: 15.03 13.45 28.48 -0.15
2014: 14.76 12.95 27.71 -0.92
2015: 14.37 12.78 27.15 -1.48
2016: 14.4 12.52 26.92 -1.71
2017: 14.27 12.56 26.83 -1.80
2018: 14.3 12.61 26.91 -1.72
2019: 14.55 12.81 27.36 -1.27
Trend for September since 2007: 0.0 ± 0.6 Mkm² /decade
Trend for March since 2007: -1.1 ± 0.5 Mkm² / decade
https://drive.google.com/file/d/1njGP94XZOg0CMky7h8U4lvM7NsadtJDt/view
The current problem is less the melting than the lack of refreezing, Krishna Gans…
Source: ftp://sidads.colorado.edu/DATASETS/NOAA/G02135/north/monthly/data/
Feel free to check.
Viele Grüße aus Berlin
J.-P. D.
As Dr Henrik Svensmark observed, low solar activity results in more cosmic rays hitting the atmosphere resulting in more clouds. Relatively minor changes in total cloud cover have an effect on atmospheric temperature. More clouds will cause cooling.
Well maybe, but that is not the point I was making.
I am saying that if this theory is true, we are in even more trouble than we thought. This is because the cooling due to low solar activity has been masking warming for the last several years. When solar activity recovers we could be in deep do-do. I don’t know why you are all congratulating yourselves over this.
What specifically are you worried about?
http://masie_web.apps.nsidc.org/pub/DATASETS/NOAA/G02186/latest/4km/masie_all_zoom_4km.png
Nope the two el Nino events of 1998 and 2016 should of been masked by your theory, they were not,
So the solar cycles are not masking anything, el Nino has a much greater amount of energy than any hypothesis of c02 warming the atmosphere.
El Nino and La Nina, the ENSO system, is an *oscillation*. The ‘O’ in ENSO stands for ‘oscillation’. An oscillation neither adds nor subtracts energy in a system over the long term. Otherwise it wouldn’t be an oscillation. (It would just be an ENS!)
ENSO typically exerts its influence, whether that be warming or cooling, a couple of times per decade; so if there has been long term warming or cooling over the course of 4 decades then ENSO can’t be to blame.
Sure a oscillation a 3 year oscillation it moves may be a better term a lot of heat/energy through the lower atmosphere which effects land temps as well ,the point was the sun cycles had no effect on the 1998/2016 el Nino events ,so the posters theory of heat being trapped by the low solar cycle does not stand up.
ENSO is likely a regulator system – regulator in the classical sense of system theory. A governor in a global heat engine.
ENSO tries to maintain a stable regime with feedbacks driving storage (La Nina) and release (El Nino) of heat energy.
ENSO has been maintaining an El Nino or near-El Nono state since late 2015. It can only go so long before it runs out of stored ocean heat energy to keep the system where it is.
A crash is coming in temps as ENSO will have to revert to La Nina to recharge.
And then it gets cold. Really cold for a bit. But a prolonged solar min will not help that recharge.
“if this theory is true,” –
kzb, that is NOT a theory, it is facts handed to you. We already have a higher cloud cover for this year than before, and humidity as well as precipitation rates and volume have picked up substantially. Those are FACTS, not theories. None of that is due to global warming. It started some time back and is increasing. If that were not the case, there would be ZERO reports of snow in 2018 in the Sahara Desert with photos: https://www.npr.org/sections/thetwo-way/2018/01/09/576747323/photos-the-sahara-desert-painted-white-with-snow
Not ONE bit of it is due to global warming. Increased cloud cover can and frequently does lead to increased precipitation levels and higher humidity.
You have a very naive, uninformed view of things. I suggest you spend some time looking for things like snow in the driest desert in the world, the Atacama Desert in South America. That place has been getting regular winter snows lately, when it hadn’t even had a drop of rain in several thousand years.
https://www.adventure-life.com/chile/atacama-desert/news/atacama-desert-driest-place-on-earth-hit-with-snow
Of course, if you choose to ignore this and just go on in ignorance, that’s your choice. However, we will NOT be in deep doo-doo when we come out of this solar cycle. It’s more likely we’ll see a return to what used to be normal weather. It’s that simple.
Sara
“None of that is due to global warming.”
Thanks for informing us how you know that. (I’m not interested in discussing global warming: I’m interested in your sources.)
“It started some time back and is increasing. If that were not the case, there would be ZERO reports of snow in 2018 in the Sahara Desert…”
Do you know, Sara, that there was snow in the Sahara in 1979?
seems to me your picking out your targets a pattern is emerging, Sara is correct increased Percipitatation is happening across the globe that’s what happens when clouds are formed due to CRF a effect of GSM do you still dispute this ,or is it still unintelligible for you,still waiting for the unadjusted data set for them fraudulent temperature readings you gave earlier.
Yes, I did. I only included the most recent Sahara desert snow, from 2018.
There was also snow in Kuwait in 2015, the first time anyone there had ever seen it, because there was no history of snow falling, never mind sticking, in Kuwait prior to 2015.
This is about cycles, nothing else. Where this particular cycle is going is a guess, but considering everything, I doubt that we will be seeing anything resembling a “deep doo-doo” event when the Sun does return to “normal” in the next solar cycle. And what if it does not do that? Then what?
What fascinates me is the peculiar notion that a +1C degree of rise in the mean global temperature is going to be fatal, somehow. One degree Centigrade is equal to 33.8 degrees Fahrenheit, and ZERO Centigrade is 32 Fahrenheit, so where is the extreme heat in that?
Perhaps if we leaned on that, instead of just repeating the centigrade/Celsius with no real reference to the same thing in Fahrenheit, some of the peculiarly dumb things that come out of this might be stopped.
Sara
“What fascinates me is the peculiar notion that a +1C degree of rise in the mean global temperature is going to be fatal, somehow. One degree Centigrade is equal to 33.8 degrees Fahrenheit, and ZERO Centigrade is 32 Fahrenheit, so where is the extreme heat in that?”
I understand what you mean.
But we all should also understand that an increase of 1 °C in the global average means much bigger increases in many corners. And these are the problem, much more than the corners helping the average not to bypass the 1 °C.
You and your kind have been predicting a rise of 1c for 30 years it’s never happened, the best you can do ,is push the date forward another 10 years , alarmist propaganda, meanwhile people are taxed more in the name of CAGW not the rich but the poor. All your doing is making the rich richer and the poor poorer, with green energy policys that will see people die from energy poverty and cold. Hows the conversion list going ? Your really in the place for conversion enrollments (not)
There are areas where the temperature increase is already beyond 1°C.
Google translator might help you:
Abb. 1: Development of the mean annual temperature worldwide 1850–2017 (violet) and in Austria 1767–2017 (red). Annual deviations from the mean of the years 1961–1990 (thin lines) and their smoothed trends (thick lines, 21-year Gaussian low-pass filter) are shown
Abb. 2: Development of the mean winter temperature (blue) and summer temperature (red) in Austria 1767–2017. Annual deviations from the mean of 1961–1990 (thin lines) and their smoothed trends (thick lines, 21-year Gaussian low-pass filter) are shown (Auer et al. 2007).
Here the link where you ind the graphs::
https://www.zamg.ac.at/cms/de/klima/informationsportal-klimawandel/klimavergangenheit/neoklima/lufttemperatur
Sara, scientists the world over use centigrade (or even better, Kelvin). Your idea that converting the unit to Fahrenheit would make anything any different is a good idea for a comedy sketch !
Anyhow, point #1, there have been many refutations of this solar activity versus temperature correlation. It quite likely does not exist, or if it does, it is much smaller than claimed. Point #2, if solar activity DOES have a big effect on temperature, we are in deep do-do when the sun goes back to normal. This is because we are still seeing warming, even in a period of low solar activity. When solar activity is restored and that is added to GHG warming, the increase in the warming gradient could be a big shock.
Do you not read anything put in front of you ,no warming sinse 2016 ,did you see the magnitude of the warm spike to 0.89c, and did you see the magnitude of the drop in temperature ,were is the effect of co2 sustaining that warm natural el Nino event ,exactly the same happened in 1998, no sustained effect .we are just entering the GSM , have a look and educate yourself.
Sara -“it’s facts handed to me” !! Well thanks. Henrik Svensmark’s theory is accepted by hardly any scientists, it does not count as an undisputed fact at all.
The rest of your post consists of the unusual weather events that we were warned would happen with increasing frequency. So you are just arguing against yourself with all that.
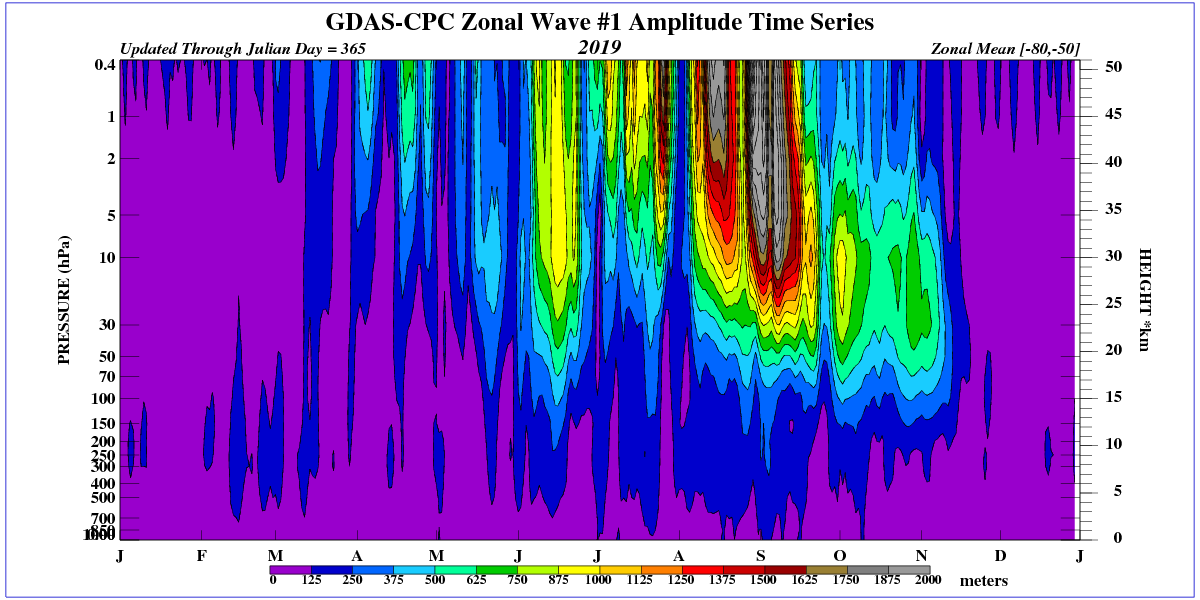
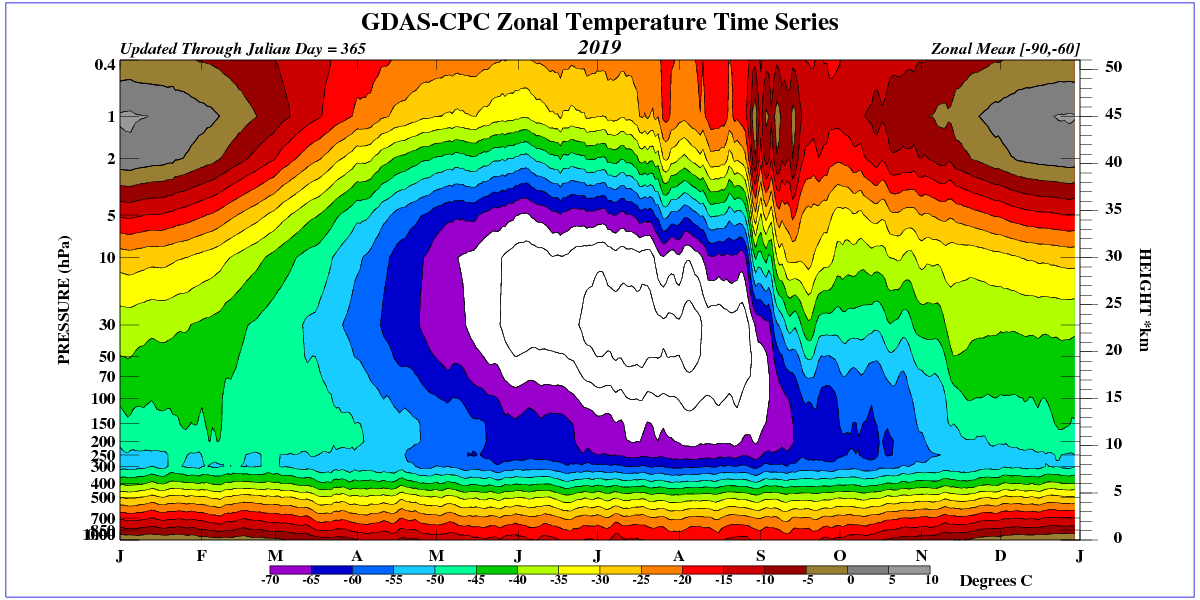
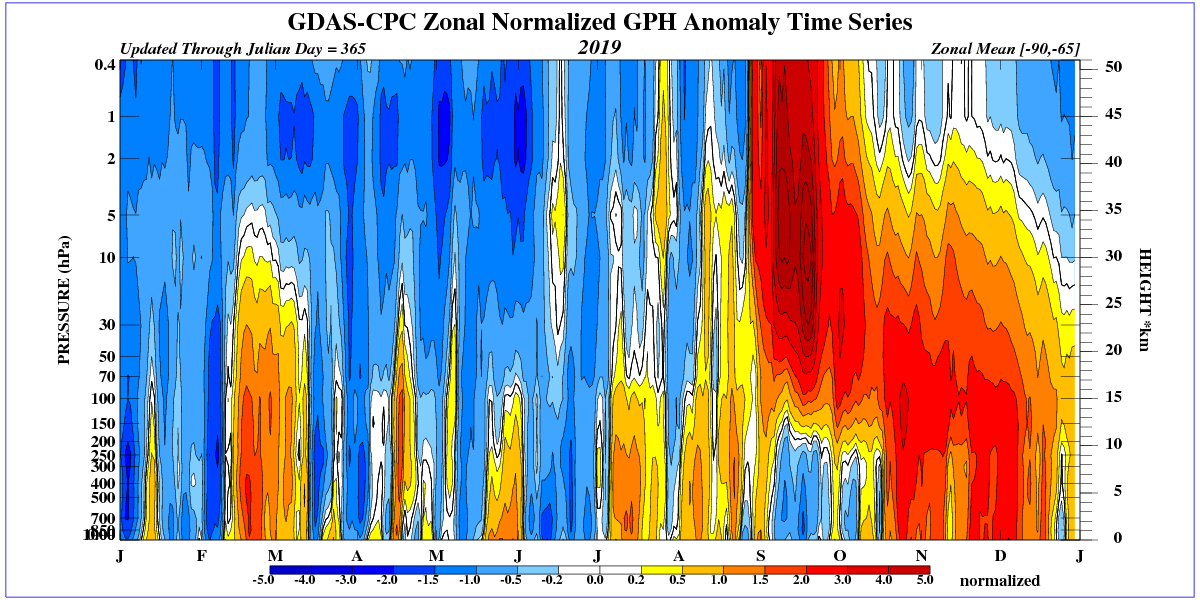
Strong waves in the upper stratosphere that break the polar vortex are very disturbing.
Good to see NASA had a perfect sine wave queued for their prediction.
I can’t predict solar activity. I’ve seen Valentina’s mathematical models and she claims a believable 97% accuracy. Saying that, there are other studies which collaborate her findings, not necessarily from a solar perspective, but sedimentary, and temperature spectral analysis.
Chinese scientists say a 250 year period cool phase is ushering in from studying patterns in sedimentary layers.
https://www.scmp.com/news/china/science/article/3022136/china-scientists-warn-global-cooling-trick-natures-sleeve
Carl-Otto Weiss. Spectral analysis. They claims all warming has been natural to this point. It could be that the last century we were fooled in to thinking CO2 did anything, let alone being in deep do-do when the sun recovers.
https://schillerinstitute.com/media/carl-otto-weiss-le-changement-climatique-est-du-a-des-cycles-naturels/
Whether or not any of these have merit, they do coincidentally point to the near future if not now, which happens to coincide with a possible GSM. The next few decades will see a push towards understanding areas of natural phenomena especially with CO2 failing to demonstrate its ability to warm.
This is playing absolute hell on amateur radio propagation which requires solar flux ionization of the upper atmosphere to reflect signals long distances.
But shouldn’t >100 meter signal propagation be great right now?
How low can you go? (MHz)
A little bit cold in Lincoln UK tonight and I was driving around until 1.30am there is a wide spread frost and I could see flakes of frost falling from the sky with my torch.
https://www.metoffice.gov.uk/weather/forecast/gcrwgdr98
Seen snow frost and hail in Wales at the weekend ,slightly below average temps here in west London tonight we have seen a few frosts.
Donald,
I spent 1985, 1986, 1987 living in Tadley, Hants.
Summer 1986 was the Solar Cycle (SC) 21-SC22 minimum.
I froze my nuts off that summer in England.
Stay warm Gentlemen. Stay warm.
lets take one quote: Atmospheric temperatures should be cooling in the near future – maybe they already are.
Now if the author and his cult were not come combination of lazy, stupid and ignorant they would have come across this:
which is from https://earthobservatory.nasa.gov/images/7122/chilly-temperatures-during-the-maunder-minimum and shows a maximum change of temperature of -0.7 degrees C from the norm.. IN the past 100 years global temps have risen over 1 degree C, And there is no evidence that this rise is slowing. https://www.google.com/url?sa=i&source=images&cd=&ved=2ahUKEwjz9_Gcv77mAhUPr54KHc7ICX8QjRx6BAgBEAQ&url=http%3A%2F%2Fberkeleyearth.org%2F2018-temperatures%2F&psig=AOvVaw1He8YHdfrNG6-EjAXyQeQc&ust=1576734313912972
Well no evidence unless you are one of the idiots who, unable to read a simple graph, claimed 1978, a year of El Nino, clearly showed that global warming had stopped or slowed,, or …
The AMO cycle will now be in the negative phase.
http://www.woodfortrees.org/plot/esrl-amo/from
https://www.google.com/url?sa=i&source=images&cd=&ved=2ahUKEwjz9_Gcv77mAhUPr54KHc7ICX8QjRx6BAgBEAQ&url=http%3A%2F%2Fberkeleyearth.org%2F2018-temperatures%2F&psig=AOvVaw1He8YHdfrNG6-EjAXyQeQc&ust=1576734313912972
(Rescued from spam bin) SUNMOD
Don’t forget:
“To everything, there is a season”.
Means that everything varies in time, even temperature.
Make this simple experiment: get four new thermometers for every face of your house. Make sure that they all show the same temp value lying together before you put them up.
Put them in place, make sure they are shadowed.
Read them every hour a full day.
Then, tell me how hot or cold the day was.
Extended: persuade your neighbours to do the same experiment. Compare the readings.
Current temperature anomalies in the US.

A look at how quick you can go wrong when claiming a relation between SC minima / low Sun Spot Number and low temperatures: Germany in 1986, 1963 and 1956. Temps in °C.
Yr/mth: Temp SSN
1986/01: -6.13 | 2.8
1963/01: -7.37 | 28.7
1956/02: -9.96 | 175.6
Feb 1956 was the coldest month in Germany (and in France) in at least the last 120 years.
For people living in e.g. Minnesota this average of -9.96 °C might look quite acceptable compared with their Feb 2019 (-14 °C on state average), but compared as departures from the 1981-2010 mean, Minnesota shows for the month 9.5 °C below mean whereas Germany was 10.8 °C below.
In Oct 1957, the SSN reached the top of the Modern Maximum with 359.4.
Climate affairs are by far too complex to be reduced to single forces like solar activity, or… CO2.
Co2 is not a single force it’s a hypothesis based around a unproven interaction with the planets atmospher as far as AGW goes,
Solar cycles are not a single force, the interaction with the planets atmospher and land and sub surface, oceans are complex relationships that drive many forces interacting with each other.
Below is the global temperature anomaly at the end of the previous solar cycle, SC23.
http://icecap.us/images/uploads/uah7908.JPG
The PDO went negative for a few years and then turned positive again. The global cooling that characterized the end of SC23 reversed and natural warming returned, culminating in the El Nino of 2015-2016.
http://woodfortrees.org/plot/uah6
The PDO is about to go negative again.
http://woodfortrees.org/plot/jisao-pdo
The AMO appears to be peaking and may also go negative – we will see.
http://woodfortrees.org/plot/esrl-amo
The current solar cycle, SC24 is much weaker than SC23 and is now ending. Total Solar Irradiance is now as low as the Dalton Minimum and still falling, almost as low as the Maunder Minimum.
http://woodfortrees.org/plot/pmod
Loading all this data into my “Super-Ouija” climate computer, the planchette moves inexorably towards “global cooling”, starting about now.
Thank you Allan
@Allan
Thank you. It is helpful to have this information put together in such an organized, accessible way. Bookmarked for future reference.
I understand the panic the alarmists are in. We are going towards really cold weather for quite a number of years now and there is nothing they can do about it now. They absolutely need to get those CO2 taxes passed into law before people find out about their scam which is why they threw such a fit in Madrid. Now it’s one more year and in the meantime the temperature will go down. every successive winter they look more foolish. For the longest time, time worked for them. Now it works for reality.
In response to these endlessly repeated claims concerning Earth just in front of a massive cooling, I show a few graphs within which nothing of that cooling is visible.
But before that, I would like to underline how quickly you can manipulate your readers with simple tricks.
Check out this graphic that at first glance seems so honest:
http://icecap.us/images/uploads/uah7908.JPG
Sorry, it isn’t. Because it is based on the use of a high order polynomial > 3, with the help of which you can tell everything:
https://drive.google.com/file/d/1dPJfJeYvEc80FJmh4E8HCzlccXb_rqJn/view
Moreover, you see in this graph many many places where the time series experiences drops even higher than that allegedly being caused by SC23’s end!
*
But let us come back to the main point, and compare, for the period 1900-2019
– the SILSO Sun Spot Number record;
– the AMO (here undetrended of course);
– the coolest surface temperature time series for this long period, managed by the Japanese Met Agency.
The detrended AMO series is useless here, as it only makes sense to demonstrate AMO’s cyclic behavior; but when you compare AMO to temperature time series, you have to use the original data (based on Hadley’s HadISST1).
Using the detrended variant gives your readers the impression that AMO is far lower than other series, what it is not at all.
Since these three series have very different value ranges, all values were uniformly converted to percentiles for an apple-to-apple comparison without tricky scaling and offsetting:
https://drive.google.com/file/d/12HtQq7eVIaJ4zn182I6Kzs5fhxxvZzT7/view
I’d like to see a commenter proving us here any kind of relation between SSN and AMO / global surface temperature!
I could add ENSO data (MEI starts 1871); but that wouldn’t change anything.
Let’s go one step further, by zooming into the satellite era from 1979-now, btw adding the UAH6.0 LT plot:
https://drive.google.com/file/d/1XwvXfhkL5XcRBbsT09CybDsVNI_d7s-m/view
Here too, some superficial eye-balling might let you think of a relation between SSN and the other series. But this guessing would quickly be stopped by a consistent statistical analysis.
*
It’s cooling in Northern America, and in UK/Eire – for very different reasons. And yes, it probably cools in some other places on Earth as well. Certainly NOT in the Arctic,however!
Cooling? Even global cooling? Are you serious? All surface series (land and sea) show warming, even UAH6.0 LT, the coolest time series does as well!
This is a bad joke. Why do you look only at cooling places, but not where it doesn’t cool at all?
Best regards from the pretty warming Germany (I appreciate! No Sydney syndrome visible here)
J.-P. D.
Sources
– SSN:
http://www.sidc.be/silso/DATA/SN_m_tot_V2.0.txt
– AMO undetrended (absolute values):
https://www.esrl.noaa.gov/psd/data/correlation/amon.us.long.mean.data
– JMA Globe anomalies:
https://ds.data.jma.go.jp/tcc/tcc/products/gwp/temp/list/csv/mon_wld.csv
– UAH 6.0 LT:
https://www.nsstc.uah.edu/data/msu/v6.0/tlt/uahncdc_lt_6.0.txt (column 3)
Interesting you did not respond to Allan who brought this graph to the thread nor did you mention allan, Allan’s point was how the temperature dropped at the end of CS 23 yet you circumnavigated this point and take his graph completly out of context from his post, seems to me your getting desperate. The facts dont change temperature drop at the end of SC23 temperature drop SC 24
Hi bin
It was at least useful for me to see the charts where Allan and others are getting their opinions from. And I did remember from past comments by you the problem with detending.
Anyway, hoping for a moderate to strong La Niña in the near future, plus continued low sunspot number. That way, if in ten years from now the various trends have returned to being as steep as ever, maybe all this nonsense will be put to rest.
Snape
“That way, if in ten years from now the various trends have returned to being as steep as ever, maybe all this nonsense will be put to rest.”
I agree. But when having a closer look at the reply above yours, you will see that there is few hope for any mental change over the long term.
The same people who accuse me to ‘circumvent’ their opinion are those who deliberately ignore the evidence, e.g. the fact that according to the same UAH data they misuse to magnify the alleged cooling effect of solar minima, it has been much cooler after huge volcano eruptions!
Amazing.
One can argue ad infinitum about causality, correlation, and which are the confounding and important variables. And it seems futile to try and predict from today forward, with all the variables, known and unknown. When you have more variables than equations, it does not seem feasible.
One thing you can take to the bank:
°Heat kills a few hundred or thousand people a year; especially those who have had cheap electricity taken away by well wishing people (or those people making a good living at the government trough). They can’t afford expensive Quixote-based electricity because of solar and wind subsidies—accentuated by availability brownouts! They have been put into this death box by us! (“We have met the enemy, and they are us” – Pogo)
°Cold kills a few hundred thousand people to a million a year, directly. (Europe alone had 40,000 cold-related deaths a winter ago). Indirectly, it also kills the poor, because people in developing countries have had coal and petroleum generating plants banned by the benevolent governments in the industrialized West. As a result, there is no preservation of food, no refrigerated medicines, no light, no progress, no education, and so on.
Regardless of what the future holds, which of two futures are we prepared best for? A cold one? I don’t think most people see that as even a possibility. How dumb! Personally, I am sure we would be happier in a warmer climate, with higher CO2 (1000 ppm CO2 is optimal for plant success), than in a CO2 starved world (below 500 ppm).
At the very least, let intelligent countries be prepared for either eventuality. Nuclear power should be an adequate compromise.