December 2nd, 2019 by Roy W. Spencer, Ph. D.
The Version 6.0 global average lower tropospheric temperature (LT) anomaly for November, 2019 was +0.55 deg. C, up from the October value of +0.46 deg. C.

The linear warming trend since January, 1979 remains at +0.13 C/decade (+0.11 C/decade over the global-averaged oceans, and +0.18 C/decade over global-averaged land).
Various regional LT departures from the 30-year (1981-2010) average for the last 23 months are:
YEAR MO GLOBE NHEM. SHEM. TROPIC USA48 ARCTIC AUST
 2018 01 +0.29 +0.52 +0.06 -0.10 +0.70 +1.39 +0.52
 2018 02 +0.25 +0.28 +0.21 +0.05 +0.99 +1.22 +0.35
 2018 03 +0.28 +0.43 +0.12 +0.08 -0.19 -0.32 +0.76
 2018 04 +0.21 +0.32 +0.09 -0.14 +0.06 +1.02 +0.84
 2018 05 +0.16 +0.38 -0.05 +0.01 +1.90 +0.14 -0.24
 2018 06 +0.20 +0.33 +0.06 +0.12 +1.11 +0.77 -0.41
 2018 07 +0.30 +0.38 +0.22 +0.28 +0.41 +0.24 +1.49
 2018 08 +0.18 +0.21 +0.16 +0.11 +0.02 +0.11 +0.37
 2018 09 +0.13 +0.14 +0.13 +0.22 +0.89 +0.23 +0.27
 2018 10 +0.20 +0.27 +0.12 +0.30 +0.20 +1.08 +0.43
 2018 11 +0.26 +0.24 +0.28 +0.45 -1.16 +0.68 +0.55
 2018 12 +0.25 +0.35 +0.15 +0.30 +0.25 +0.69 +1.20
 2019 01 +0.38 +0.35 +0.41 +0.36 +0.53 -0.15 +1.15
 2019 02 +0.37 +0.47 +0.28 +0.43 -0.02 +1.04 +0.05
 2019 03 +0.35 +0.44 +0.25 +0.41 -0.55 +0.97 +0.59
 2019 04 +0.44 +0.38 +0.51 +0.54 +0.50 +0.92 +0.91
 2019 05 +0.32 +0.30 +0.35 +0.40 -0.61 +0.98 +0.38
 2019 06 +0.47 +0.42 +0.52 +0.64 -0.64 +0.91 +0.35
 2019 07 +0.38 +0.33 +0.44 +0.45 +0.11 +0.33 +0.87
 2019 08 +0.39 +0.38 +0.39 +0.42 +0.17 +0.44 +0.24
 2019 09 +0.62 +0.64 +0.59 +0.60 +1.14 +0.75 +0.57
 2019 10 +0.46 +0.64 +0.27 +0.31 -0.03 +0.99 +0.50
 2019 11 +0.55 +0.56 +0.54 +0.55 +0.22 +0.56 +0.38
The UAH LT global anomaly image for November, 2019 should be available in the next few days here.
The global and regional monthly anomalies for the various atmospheric layers we monitor should be available in the next few days at the following locations:
Lower Troposphere: http://vortex.nsstc.uah.edu/data/msu/v6.0/tlt/uahncdc_lt_6.0.txt
Mid-Troposphere: http://vortex.nsstc.uah.edu/data/msu/v6.0/tmt/uahncdc_mt_6.0.txt
Tropopause: http://vortex.nsstc.uah.edu/data/msu/v6.0/ttp/uahncdc_tp_6.0.txt
Lower Stratosphere: http://vortex.nsstc.uah.edu/data/msu/v6.0/tls/uahncdc_ls_6.0.txt
“The linear warming trend since January, 1979 remains at +0.13 C/decade (+0.11 C/decade over the global-averaged oceans,…”
Decidedly un-scary!
Weather is not climate…and pretty much all the cold we “in the 48 States” are feeling is from shifting air masses…which “pulls” warmer air where normally it ain’t…somewhere else.
But DO take the opportunity to make a big deal out of the cold…that’s what voters will remember. They know nothing about climate.
The preservation of our Constitution and Western Civilization depends on controlling Washington in 2020 AND 2024…then hopefully (and unfortunately) the climate downturn will become obvious to all.
The Global-Lusting Globalist Socialists have a LOT of political capital invested in this Climate Hoax.
Globalism must die, or our freedoms may have to be defended in a shooting Civil war. Nobody…NOBODY…wants that…but there are limits to how far Busy Real Americans will bend.
The 2nd Amendment was NOT drafted to protect hunters’ rights…it was drafted to kill Tyrants if the unfortunate situation should ever arise. Authoritarian Tyrant Types are now seen in abundance everywhere. Government, Politics, Media, Academia, Entertainment, Finance, Big Social Media, Crony Capitalists, Law, Science, and now even the Church.
Fortunately, they are actually telling us what they plan to do:
• Open the borders (2,000,000 undocumented a year).
• Free Medical Care for those 2,000,000 immigrants at $15,000 each annually.
• 80% of domestic workers below $35,000 income per year lose their jobs to Illegals EAGERLY willing to take $20,000 for all of those same jobs.
• Increasing energy costs for EVERY FAMILY by $300-$500 per month by 2028….because CO2 (based on projections of Germany’s experience and future)
• Free higher education @ur momisugly ave. $8000/year * 20,000 ,000 projected students. (Expect Universities to raise tuitions with that demand).
• Pay off $Trillions of Student Debt.
• More censorship in public discourse “because of hate” (I can feel the love already).
• No free speech on Campuses….just like now.
• Impose WEALTH TAXES…and see about $30 Trillion of capital flee the US in one week…and probably into China.
• Resume Trade with China with the US “giving away the store”.
• Populate all of our major cities with millions of homeless drug addicts and mentally disturbed unfortunates. Sale of rubber boots will skyrocket.
• A million+ square miles covered by intermittent Renewable Energy (killing thousands brutally from the cold annually – all the trees north of Tennessee cut down for survival — and drive all birds of prey and many bats into extinction).
• Farming in mass bankruptcy…no meat…eventually no dairy. Not improbable mass starvation (as in Ukraine under Stalin).
• Medicare for All…and month long waits for urgent care WHILE INCREASING costs up to 20%.
• Banning Fracking…which will crash the stock market and destroy all pension funds…while making our very survival dependent on Russians and Arabs.
• Closing drilling on Fed lands and Offshore…killing the already dead economy several times over.
• Giving away…for free…Military protection for the Socialist regimes in Europe and NE Asia.
• Constitution ignored by their Courts…eventually re-writing the Constitution…or just dumping it.
Don’t rule out the *usual* RE-EDUCATION camps….and the Death Camps.
EVERY WAR EVER FOUGHT anywhere WAS FOUGHT FOR A far LESSER THREAT.
A refugee crisis was the beginning of the end for the Roman Empire. link If you let refugees get out of hand, you may be powerless to save yourself.
DocSiders
That’s really pathological paranoia.
My humble opinion: people like you are exactly those who contribute to aggravate the fronts of all kinds by irresponsible, hateful talk.
Great!
J.-P. Dehottay (Germany)
ok. tl:dr that’s just embarrassing. temps, according to the danes, for the arctic were NORMAL when we got all our record colds. so where do YOU suppose they came from?
DocSiders
You’re right that this climate ecofascist movement will lead inevitably to war. Your assessment is quite rational. The instigation to war is coming from the side of the alarmists. Here is a recent direct quote from a Danish academic:
… this is your emission target, it’s not negotiable, we can actually take military measures if you don’t fulfil it
Like you I say, bring it on.
Ecofascism was only ever going to end one way, once again it will lead to a catastrophic war. Ecofascist nations under a UN pretext will try to force all nations to comply with Luddite technology destroying and economy destroying (and people destroying) policies.
There is only one way to deal with fascism and it’s not pretty, but necessary. As before, Russia will be the best last hope against global fascism. Like all European fascist movements it will end in a graveyard in Russia. Fascists fare poorly there. Learn Russian. I have.
History repeats itself. Has to, no-one listens.
Is it fair to attribute the difference in the land and ocean long term trend to UHI and land use changes? That’s the real AGW.
At least we can agree about cleaning up pollution from land, sea & air. Let’s at least start that ASAP.
As long as you are not including carbon or CO2 I agree.
The BBC are reporting abnormally heavy rains and flooding in east Africa.
https://www.bbc.com/news/av/world-africa-50676782/east-africa-hit-by-weather-phenomenon
https://www.bbc.com/news/world-africa-50628420
That reminded me that Africa has had humid periods in past millennia, during which the current Sahara desert and Sahel has been fully covered with vegetation.
https://en.m.wikipedia.org/wiki/North_African_climate_cycles
This wiki article states that the Sahel flips between wet and dry periods by apparent attractor-switching, and three transitions can be rapid. They are driven by feedbacks linked to mutual effects between vegetation and climate.
Since CO2 is causing a greening of wilderness areas like the Sahel, it made me wonder if our recent enrichment of the atmosphere with CO2 could be pushing North Africa toward another flip back to a humid period and a green Sahel.
That would be one of the most wonders things to happen in the history of the world. It would mean that out CO2 emission have been and are an unmitigated good, the best thing the human race has ever done.
Mmmmm, this is does not sound good for rain prospects in Southern Africa.
Both these papers describe a negative correlation between heavy rain in East and Southern Africa.
WRC Report 903/1/02
Decadal Rainfall Dipole . . . modulated by variation . . .along East Coast of Africa by Zhang, Holmgren and Sundquist.
Yup from the last solar max to the coming solar min, temperatures been dropping like a rock
opps. not
Temperature is going up in perfect correlation with CO2 as well. Oops. Not.
Do you really believe that 40 years of +0.13C/decade is an emergency requiring vast destruction of wealth and freedoms? Somehow I think you were a leftist before the convenient AGW excuse came along.
So sad that supposedly smart people actually think humans can “fix” or “stop” climate change. The smarter ones say “Well, we must try anyway!”, the dumbest say “Oh, yes we can!”
“chrome-extension://oemmndcbldboiebfnladdacbdfmadadm/http://static.berkeleyearth.org/pdf/annual-with-forcing.pdf”
Actually they match pretty closely.
chrome-extension://oemmndcbldboiebfnladdacbdfmadadm/http://static.berkeleyearth.org/pdf/annual-with-forcing.pdf
It’s not leftest but group think. Other groups fall into the same trap of passing unproven information around as fact.
We are rapidly heading towards socialism(or something) with robots and computers as the workers, if we can think correctly enough to accomplish it.
Odd that Dr Spencer doesn’t mention this was the warmest November in the UAH record – by a country mile in fact. The previous warmest anomaly was +0.48C in 2016, which was itself head and shoulders warmer than the previous record, +0.34C, set just the year before. Those results where widely associated with the strong 2015/16 El Nino at the time. To see a new record set now in 2019, many months after the close of the much smaller 2018/19 El Nino is remarkable. For Roy to not even comment on it seems a bit strange.
Don’t know why Dr Spencer didn’t mention it — don’t really care.
The further we are from the coming inevitable glacial period, the better.
I live in a warm part of the US. Our thanksgiving day it was 70 degrees, which is remarkable because that’s the same temperature it was exactly 20 years ago when a friend decided we’d eat Thanksgiving dinner outside.
On the whole the last 4-6 weeks seem completely average except for one unusually early frost which killed half my garden.
As I enter middle age and they keep telling me about runaway temperature changes, and I live in a warm climate already, you’d think I’d have noticed a significant difference form my youth by now.
My location in the US mid-Appalachians can’t seem to get with the game — Nov for a nearby urban-affected site was 3.8F (2.1C) below avg.
Warming caused by CO2 has no impact on part of Earth under influence of water. Whole Earth temperature is controlled by clouds with with ~1000W/m2 range of control. That is difference between sun energy reaching surface and be reflected by clouds.
CO2 has ability to change energy in range of 4W/m2 at max. So only difference here will be, that we will reach temperature when clouds starts to form 0.4% sooner.
Only in dry areas like Sahara there will be some visible impact of CO2 greenhouse effect.
Result of Earth water cloud thermostat is, that Earth keeps maximum temperature above water at around 29C (thanks Willis).
So any additional energy to Earth budges simply causes widening of Earth tropical belt.
Increase energy sufficiently and we will have 29C tropics from pole to pole.
Inland parts of continent are still under control of oceans so with increasing energy temperature swings will increase, but average temperature remains same or similar to those 29C of oceans.
Sunsettommy
You wrote to Loydo:
“It is clear you didn’t look at the temperature change for the Arctic, where it cooled greatly from the previous month.”
I had a quick look in GHCN daily at the Arctic’s coldest corner:
https://www.google.de/maps/place/Verkhoyansk,+Sakha+Republic,+Russia,+678530/@67.5505912,97.5399244,3z/data=!4m5!3m4!1s0x5b9579da63386d09:0x1dda69f74af67b40!8m2!3d67.5505925!4d133.3993399?hl=en
RSM00024266 67.5667 133.4000 136.0 VERHOJANSK
for end of Nov / begin of Dec:
2019 11 22 -46.0 (°C)
2019 11 23 -52.0
2019 11 24 -52.1
2019 11 25 -53.2
2019 11 26 -53.6
2019 11 27 -49.9
2019 11 29 -42.0
2019 11 30 -41.2
2019 12 01 -44.8
2019 12 02 -50.1
Looks very cold indeed!
But Nov 2019, when put in relation to the mean of all the station’s Nov within 1981-2010, looks like this:
2019 11 -1.39 (°C)
Trends for the the average of all GHCN daily stations in the Arctic region (roughly 900 in each year since 1979) – in °C / decade
– 1900-2019: 0.26
– 1979-2019: 0.49
– 2000-2019: 0.65
– 2010-2019: 0.68
Anomaly graph for the period 1900-2019, wrt the mean of 1981-2010:
https://drive.google.com/file/d/11jnEotvImQk-87F1-M0NbNoWZM_nk_wP/view
Yeah. It’s cold during the winters in the Arctic. But wether or not it becomes colder is another question.
Keep hoping!
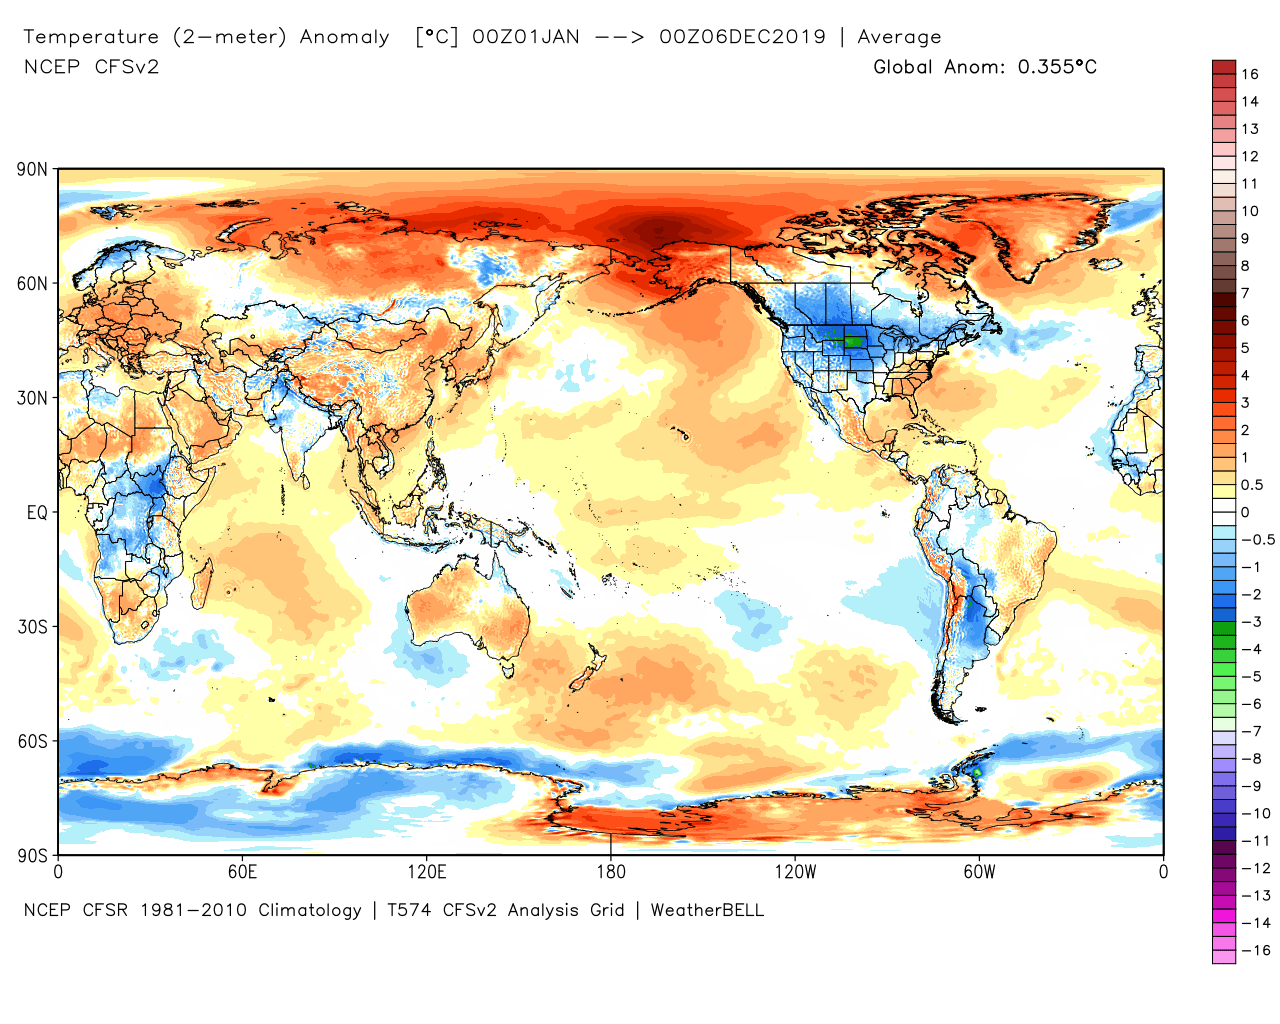
Latest 2019 year-to-date average surface temperature departures from the 1981-2010 average from the NCEP CFSv2 global data assimilation system (graphic courtesy of Weatherbell.com).
So many people talk here about cooling in the Arctic!
I just downloaded the daily Arctic sea ice extent data from
ftp://sidads.colorado.edu/DATASETS/NOAA/G02135/north/daily/data/
1. Daily absolute data
https://drive.google.com/file/d/1n5qRk-C6w0OdmX05XK8Twhh8VK0l-bTS/view
2. Daily anomaly data wrt the daily mean of 1981-2010
https://drive.google.com/file/d/1nFPvfKESL9WvxtFhDFgZIEXOP0xcGz_V/view
*
Since 2007, the September months show a rather flat trend; but the March trend is pretty negative, with about -1 Mkm² / decade. Thus, while the melting slows down, the ice refreezing till end of winter slows down too.
Sorry, but under cooling I understand something different.
Maybe nobody in CONUS feels concerned by that. But in Western Europe we all do, as diminishing sea ice levels mean an increase of atmospheric disturbances in Northwestern Atlantic regions (our weather kitchen).
No thanks!