December 2nd, 2019 by Roy W. Spencer, Ph. D.
The Version 6.0 global average lower tropospheric temperature (LT) anomaly for November, 2019 was +0.55 deg. C, up from the October value of +0.46 deg. C.

The linear warming trend since January, 1979 remains at +0.13 C/decade (+0.11 C/decade over the global-averaged oceans, and +0.18 C/decade over global-averaged land).
Various regional LT departures from the 30-year (1981-2010) average for the last 23 months are:
YEAR MO GLOBE NHEM. SHEM. TROPIC USA48 ARCTIC AUST
 2018 01 +0.29 +0.52 +0.06 -0.10 +0.70 +1.39 +0.52
 2018 02 +0.25 +0.28 +0.21 +0.05 +0.99 +1.22 +0.35
 2018 03 +0.28 +0.43 +0.12 +0.08 -0.19 -0.32 +0.76
 2018 04 +0.21 +0.32 +0.09 -0.14 +0.06 +1.02 +0.84
 2018 05 +0.16 +0.38 -0.05 +0.01 +1.90 +0.14 -0.24
 2018 06 +0.20 +0.33 +0.06 +0.12 +1.11 +0.77 -0.41
 2018 07 +0.30 +0.38 +0.22 +0.28 +0.41 +0.24 +1.49
 2018 08 +0.18 +0.21 +0.16 +0.11 +0.02 +0.11 +0.37
 2018 09 +0.13 +0.14 +0.13 +0.22 +0.89 +0.23 +0.27
 2018 10 +0.20 +0.27 +0.12 +0.30 +0.20 +1.08 +0.43
 2018 11 +0.26 +0.24 +0.28 +0.45 -1.16 +0.68 +0.55
 2018 12 +0.25 +0.35 +0.15 +0.30 +0.25 +0.69 +1.20
 2019 01 +0.38 +0.35 +0.41 +0.36 +0.53 -0.15 +1.15
 2019 02 +0.37 +0.47 +0.28 +0.43 -0.02 +1.04 +0.05
 2019 03 +0.35 +0.44 +0.25 +0.41 -0.55 +0.97 +0.59
 2019 04 +0.44 +0.38 +0.51 +0.54 +0.50 +0.92 +0.91
 2019 05 +0.32 +0.30 +0.35 +0.40 -0.61 +0.98 +0.38
 2019 06 +0.47 +0.42 +0.52 +0.64 -0.64 +0.91 +0.35
 2019 07 +0.38 +0.33 +0.44 +0.45 +0.11 +0.33 +0.87
 2019 08 +0.39 +0.38 +0.39 +0.42 +0.17 +0.44 +0.24
 2019 09 +0.62 +0.64 +0.59 +0.60 +1.14 +0.75 +0.57
 2019 10 +0.46 +0.64 +0.27 +0.31 -0.03 +0.99 +0.50
 2019 11 +0.55 +0.56 +0.54 +0.55 +0.22 +0.56 +0.38
The UAH LT global anomaly image for November, 2019 should be available in the next few days here.
The global and regional monthly anomalies for the various atmospheric layers we monitor should be available in the next few days at the following locations:
Lower Troposphere: http://vortex.nsstc.uah.edu/data/msu/v6.0/tlt/uahncdc_lt_6.0.txt
Mid-Troposphere: http://vortex.nsstc.uah.edu/data/msu/v6.0/tmt/uahncdc_mt_6.0.txt
Tropopause: http://vortex.nsstc.uah.edu/data/msu/v6.0/ttp/uahncdc_tp_6.0.txt
Lower Stratosphere: http://vortex.nsstc.uah.edu/data/msu/v6.0/tls/uahncdc_ls_6.0.txt
40 years of data would seem to refute any notion of runaway global temperatures and given mankind’s continued and increased use of fossil fuels, any anthropogenic footprint.
As does Connolly and Connolly radiosonde data.
I’ve been waiting for “good” peer review reports on the Connolly and Connolly Paper.
There are a few places where they certainly “crawled way out on a limb” as with their conjecture of a new energy transfer mechanism (Pervection) and the conjecture that there is a novel molecular bonding mechanism in the upper atmosphere. These would appear to be testable hypotheses. There should be a signature of the bonding energy on spectra analysis (unless ALL of that binding energy is transferred only kinetically). It should be possible to test Pervection by putting tracers into a “block” of the upper atmosphere then track the motion of the “block” under various conditions.
DocSiders: I cannot give you a “good” peer review of the Connolly-Connolly paper (oprj.net/oprj-archive/atmospheric-science/19/oprj-article-atmospheric-science-19.pdf), but this paper plus the “Balloons in the Air”, Youtube presentation, have convinced this engineer that the atmosphere obeys the ideal gas law and, hence is, by definition, in thermodynamic equilibrium. I agree with you that the Connollys’ attempt to find a reason for the definitive slope changes leaves me a bit skeptical, but they clearly are on to something…
“Pervection” is only their name for a well know scientific phenomenon that birds have used since they came into being.
I’ve been thinking in my own non-scientific, simple way that in an open system, if you add heat to a gas it must be emitted as fast as it is absorbed due to expansion. (and pressure reduction) Whether it’s heated from above, below or within. No one has yet convinced me I’m wrong. Of course that’s not to say I’m not! Have the Connollys not shown that the tropopause jumps up and down with temp variations? As they point out, thermodynamic equilibrium is not the same as thermal equilibrium.
Mike,
I am not sure what you mean by an “open system” but if you really think that gases
emit heat as fast as they absorb it then I suggest you try putting your hand above a fire
and seeing if it feels warm.
Izaak – that’s his point. The gas won’t just stay in one place and heat up, it will expand as in your fire example causing it to rise.
It’s the same with a hot air balloon – the extra heat causes the air to expand and the mass per volume to decrease, which is what allows it to rise. It’s an overly simplistic model of the world, because the gas won’t keep expanding, so he’s just describing the ideal gas law with temperature and pressure in equilibrium.
It’s a framing like Newtonian physics – good enough for almost all purposes, but not an accurate description of the real world.
Thats funny they think c02 cant change temperatures
They should talk to freemon dyson.
Freemon Dyson says ”we are effecting the climate but the question is – how much”.
My translation, he doesn’t know if we are affecting climate. If you ”know” we are, then you should have an idea of how it’s measured.
He says….” the effects of co2 in the atmosphere is so much easier to measure than it’s effect on climate”
My translation, he is not sure if co2 causes a permanent jump in warming.
Fact seems to remain…..co2 caused warming is still a hypothesis.
Not quite on topic , but I must share this one in case everybody has not seen it .
https://youtu.be/5GNDyBlKdxg
If this link works , it is well worth watching .
I know it has been used for other topics before , but this one is so good .
Thank you, World. That is priceless!
In the Real World:
Yeah…I’ve been watching that movie in real time for 3 Decades now.
nobody predicted runaaway warming for 1979 to 2020.
you crush that strawman everytime you face him. Awesome job!
True, but what about to 2030?
https://www.pnas.org/content/115/33/8252
40 years of adjusting down the past
Onward and Upward! To Narnia and the North!
Looked onward and downward from 2016. I guess you miss that. We’re talking 0.3c change, well within errors.
Climate data doesn’t have errors, it’s perfect. That’s why we are able to tell what the temperature was back in the 1700’s to within a thousandth of a degree.
MarkW:
Even over the 80% of the globe where there were NO thermometers until 1960…and at a time where the temporal resolution of proxies is around 125 years at best…and the proxy error bar amplitudes are roughly equal to half the amount of warming since the 1700’s…when we were escaping from the grip of the Little Ice Age.
Thank you, World. That is priceless!
Doc,
This shows just how bad the data has been.
#DataGate! First ever audit of global temperature data finds freezing tropical islands, boiling towns, boats on land
http://bit.ly/33V7cmS
HadCrut4 Global Temperature, 1850 – 2018.
Absurdity everywhere in Hadley Met Centre data
…Data is incredibly, brazenly, sparse
The Hadley Met Centre team have not even analyzed this data with a tool as serious as a spell checker.
For two years the entire Southern Hemisphere temperature was estimated from one sole land-based site in Indonesia and some ship data. We didn’t get 50% global coverage until 1906. We didn’t consistently get 50% Southern Hemisphere coverage until about 1950.
McLean’s findings show there is almost no quality control on this crucial data. The Hadley Met Centre team have not even analyzed this data with a tool as serious as a spell checker. Countries include “Venezuala”,” Hawaai”, and the “Republic of K” (also known as South Korea). One country is “Unknown” while other countries are not even countries – like “Alaska”…
Also, here.
Climategate’s “Harry Read Me” File is a Must Read!
As another pundit said: this isn’t just the smoking gun pointing to the fraud of global warming, it’s a mushroom cloud!
http://bit.ly/2KAglcK
…The computer coding, along with the programmer’s apparently unsuccessful efforts to complete the project, involve data that are the foundation of the study of climate change — recordings from hundreds of weather stations around the world of temperature and precipitation measurements from 1901 to 2006, sun/cloud computer simulations, and the like…
As you read the programmer’s comments below, remember, this is only a fraction of what he says.
– “But what are all those monthly files? DON’T KNOW, UNDOCUMENTED. Wherever I look, there are data files, no info about what they are other than their names. And that’s useless …” (Page 17)
– “It’s botch after botch after botch.” (18)
– “As far as I can see, this renders the (weather) station counts totally meaningless.” (57)
– “COBAR AIRPORT AWS (data from an Australian weather station) cannot start in 1962, it didn’t open until 1993!” (71)
– “What the hell is supposed to happen here? Oh yeah — there is no ‘supposed,’ I can make it up. So I have : – )” (98)
– “You can’t imagine what this has cost me — to actually allow the operator to assign false WMO (World Meteorological Organization) codes!! But what else is there in such situations? Especially when dealing with a ‘Master’ database of dubious provenance …” (98)
We only get 50% coverage in 1906 if you assume that a single thermometer is able to cover everything within 500 miles of that thermometer.
Until the satellite data was available, total coverage was closer to 10 to 20 percent.
Yes, and the average PH of the oceans is 8.1, down from an average of 8.2 before industry began polluting our pristine environment hahaha… Believe it or not, NASA claims to have a data set back to 1861 seen here:
https://sos.noaa.gov/datasets/ocean-acidification-surface-ph/
I don’t believe NASA’s claim for one second and I doubt they believe it, either.
The Total Myth of Ocean Acidification: Science! Edition
https://wattsupwiththat.com/2019/07/25/the-total-myth-of-ocean-acidification-science-edition/
NOAA scientists admit in private that they can’t name any place affected by ocean acidification «
bit.ly/2MPFm3K
JoNova
Patrick MJD
“Looked onward and downward from 2016.”
Exactly as it did from 1998 till 2001.
I guess you miss that.
Bindidon:
And the El Nino 2016 “Jump” (just like the 1998 discontinuity) was caused by CO2….where MAGICALLY all the CO2 warmed atmosphere and ocean surfaces gathered together along the equator (don’t ask…it’s a mystery) and then was further heated by solar radiation only along the equator…because CO2.
And then general oceanic circulation distributed that heat all over the globe. It’s obviously all the miracle of CO2.
DocSiders
Why are people like you writing all the time about this CO2?
Did I mention it?
Try to forget your CO2 fixation, DocSiders, and take some little time to have a look at this graph:
https://drive.google.com/file/d/1y1zmzMt_1gD5jxCOH13UVYvbocYulbNz/view
Maybe you understand what I meant with ‘Exactly as it did from 1998 till 2001’.
You sound disappointed your faith in CAGW is being disproved.
Loydo must have been issued new drugs.
It is clear you didn’t look at the temperature change for the Arctic, where is cooled greatly from the previous month.
Loydo strikes out…. again!
He sees the same thing no matter what he sees – thus the wonders of predetermined opinion.
A common trait, btw.
Sun
And yet the Arctic Sea Ice Extent had a low increase trend for November.
How about that, it has little to do with temperature.
Yeah…in the North where tree stumps are found 600 km north of the current permafrost line. And where crops grew in Greenland for hundreds of years not so long ago.
https://www.google.com/amp/s/www.macleans.ca/news/canada/this-mysterious-arctic-tree-stump-could-reveal-ancient-secrets/amp/
https://wattsupwiththat.com/2009/10/26/on-the-vikings-and-greenland/
Maybe I’m missing something but this is global coverage, right?
The first day of summer in the So. Hemisphere was 12/1, so Nov. is their Spring, no? Are these temps in any way unusual for the So. Hemisphere? Is it not normal for their temps to rise in Nov. and effect global averages?
That would be “affect” global averages. I once read in a student essay that Hitler effected the entire population of Germany. That would make him a very energetic fellow.
Northern Hemisphere at 0.56 and USA48 at 0.22 are at odds to the actual experiences of those living there.
Because what we experience is weather not climate. We cannot feel 0.56C.
true, but we do feel record cold, so this past february’s USA48 of -.02 is laughable
Just like the 1930’s where both EXTREME hot and Dry (weeks to months over 100 F and years of drought unlike anything remotely seen today) and also Extreme Dry cold occurred.
Those Extremes were Historical and Devastating (mass Climate Death and Climate Migrations). But the Average Global Temperatures were unremarkable.
So, your hair is on fire and your feet have frozen off…but on average you’re doing just fine.
We should be tracking MOSTLY the trends of the Extreme Temperatures…not Just the Relatively Unimportant Averages. It is, with rare exception, only the extremes that matter.
See Tony Heller’s videos that show gradually declining “Days above 100 F”, Days above 90 F°, and Days above 80 F° since the NOAA (unaltered) records began. All of those cooling trends are perfectly linear (13 yr. averages) and show no CO2 signatures whatsoever. The extremes are becoming less extreme.
“See Tony Heller’s videos that show gradually declining “Days above 100 F”, Days above 90 F°, and Days above 80 F° since the NOAA (unaltered) records began. ”
Yes in early years when stations were located on rooftops you got a bunch of hot days.
And when you used sensors that are biased hot relative to todays sensors you get
a lot of hot days.
And yes, when you move those sensors from urban areas to rural areas, you get fewer hot days.
heller doesnt account for any of these changes.
And he never looks at data that shows the opposite. Data Outside the usa
Prove it!
Snicker……………..
Mosher has the cheek to talk about badly sited Stations in the old days when all we see today are badly sited stations at Airports and still on tin roofs and in the middle of Cities.
He lives in his own fantasy land where everything he does is perfection.
Sunsettommy
“Prove it!
Snicker……………..”
No reason at all for you to snick here!
1. Last year in July, Roy Spencer posted a head article about Summer causing “Climate hysteria”, within which he published a chart made by John Christy:
http://www.drroyspencer.com/wp-content/uploads/US-extreme-high-temperatures-1895-2017-550×413.jpg
The chart plotted the average number of daily maxima per station per year in the US.
2. A commenter having asked for a similar chart with plots for the Globe, I first made a char for CONUS but out of GHCN daily data – because Mr Christy used USHCN, a data set hardly able to show anything outside of the US.
The graph showed enough similarity with Mr Christy’s to be accepted as a start:
https://drive.google.com/file/d/1qGV5LfKw_lFKNdZMlq15ZHz6sA1CA294/view
3. Then I tried to produce a similar graph but this time with all GHCN daily stations:
https://drive.google.com/file/d/1GMuNs9ptRzDd7KxFQbKv0o5ySR5VNc9b/view
Wow! Should the Globe really look as CONUS people think it is, namely like CONUS’ backyard?
Impossible.
4. Here is a graph made out of all the Globe’s data but excluding CONUS:
https://drive.google.com/file/d/1UcLK3usYjICeHeAsAb5ivcusW0Y0EdNe/view
You see what Steven Mosher means when he writes that Heller aka Goddard does not like to publish information whenever it does not fit to his narrative.
What is this incredible discrepancy due to?
It is due to the fact that nearly in each American temperature data set, there are nearly as many stations located in CONUS as there are outside of it. Thus, in a global average, 50 % of the data comes from CONUS, though it represents no more than laughable 6 % of the Globe’s land surface.
5. If you now distribute all station data into the cells of e.g. a 2.5 degree grid (like used by UAH), you move from a situation where 18000 CONUS stations compete with the rest to a situation where 200 CONUS grid cells compete with 2000 cells outside of CONUS.
Giving this:
https://drive.google.com/file/d/1TFdltVVFSyDLPM4ftZUCEl33GmjJnasT/view
Like Mosher, I doubt that you ever would see such a graph published at Heller’s blog.
And incidentally, this is the best proof that on a global scale, the 1930’s were by no means as warm as they were in the US. There might be locally here and there similar patterns, but that was certainly not a global phenomenon.
Rgds
J.-P. D.
When Feb was 10s of degrees below normal for most of north America, -0.02° is indeed laughable.
Jeff in Calgary, billtoo
“When Feb was 10s of degrees below normal for most of north America, -0.02° is indeed laughable.”
Sorry, but
– the temperatures measured at an altitude of 4-5 km may correlate with those from the surface but are nonetheless completely different;
– the CONUS average for the GHCN daily stations was -0.69 °C, not too far from UAH’s USA48 average.
You seem to forget that these numbers are anomalies wrt a mean over 30 years and do not necessarily reflect absolute values.
Minnesota for example was on average of all its absolute temperatures colder in February 2019 than has been Montana, but wrt the mean of 1981-2010, Montana has shown for the same month a lower departure from that mean than did Minnesota.
This is a fortiori valid when comparing these two with New Mexico and Texas.
You can feel 0.56C when paying your heating bill(s.)
“You can feel 0.56C when paying your heating bill(s.)”
Agreed. My heating bill won’t be as high as it normally would.
“Northern Hemisphere at 0.56 and USA48 at 0.22 are at odds to the actual experiences of those living there.”
Precision, please! Temps up here, temps down there — It’s called “the weather” for a good reason…
“Precision”, when 100s of long term cold and snow records have been broken, where are offsetting warm records?
Yet the Satellites think it is warmer than the baseline average.
You can believe it if you want, but I continue to say that the satellites measure the heat leaving the Earth and not what we experince on the Surface.
Yep. Don’t believe your lying eyes, and power bills, the path to salvation is through satellites, computers and arrogant phd’s who know how bad things will be 100 years from now.
Climate Scientists all need to be find real work including those at UAH.
Climate “scientists” need to talk to geologist about what the climate is. The geologist say we have been in a long-term ice age for 2.6 million years called the Quantary Glaciation that isn’t expected to change any time soon. https://en.wikipedia.org/wiki/Ice_age
The temperature in Greenland was 8 degrees warmer that today in the last interglacial 120,000 years ago and still the Greenland Ice Cap didn’t melt away. https://www.nbi.ku.dk/english/news/news13/greenland-ice-cores-reveal-warm-climate-of-the-past/
Agreed ,I live in the NH the last two months in my area have been cooler than the previous few years ,I have a theory that dr Spencer needs to look into,ER have a green powered space ship they covertly fly into space once a month ,fiddle with the data while shouting Rome is burning.
For sure, I have a hard time reconciling all of the record cold temps set in Nov for the US and the reported warmer temps on West Coast when our temps were well below normal. Something is fishy.
Even a couple of degrees would be insignificant in the overall day-to-day and yearly temp fluctuations. A look at the last ice age coverage progression would indicate that some kind of anomaly (possibly solar?) causing jet stream swings to south might result in the increasing snow/ice coverage. Note also on those figures that most of Alaska is ice free during the continental icing, so warming there might be a warning.
A C Osborn
“… at odds to the actual experiences of those living there” ?
NH doesn’t begin with Texas, let alone would it end with Montana. NH, that’s also the Tropics starting with 0° N, the Arctic from 60 °N till 82.5 °N and all that stuff inbetween.
Even in UAH’s lower troposphere record, the Arctic region warms twice as fast as the Globe.
And as you wrote a bit downthread, UAH does not measure anything just above surface; it does at altitudes around 4-5 km. And there it measures O2 molecules’ 60 GHz emissions within huge advection streams moving poleward from the Tropics.
Last not least, Roy Spencer and all others publish what is above or below the mean of 30 year periods, and not what people really experience.
For “USA48”, or the “continental US”, the experience of last November depends on where a person lives. Many people in the Midwest or Northeast were shivering under below-normal temperatures, but Salt Lake City and the surrounding areas had about three weeks of sunny weather in November with highs in the upper 50’s to low 60’s, which is unusually warm. The last week of November brought cold and snow, but on average it was a warm November for the western US.
Of course, changing weather can result in strange human behavior. There was a group of “Extinction” protesters that apparently saw the warm November as a chance to make a point, but they waited until Thanksgiving to protest in front of the Utah State Capitol building, under 6 inches of white “global warming” (which normal people call “snow”). They probably brought a lot of snarky smiles to passers-by!
“Northern Hemisphere at 0.56 and USA48 at 0.22 are at odds to the actual experiences of those living there.”
UAH is not measuring where they live.
Neither was the temperature record prior to satellites. Strangely the satellite data was initially calibrated to the old temperature record.
US-CRN for October was -2.27°F, -1.26°C. November’s will be available in a few days. It shouldn’t be as bad as October.
Watch that ENSO Meter. Is the cold coming?
It sure arrived in Eswatini. Two days ago it was 39 C and today it is 18. According to climate model projections it will be -528 C by the end of the month.
My science based reading of the Models proves it will bottom out at -273 C.
I’d be willing to bet on it.
No, no, Doc.
It’s CO2.
It’s so special – that CO2.
It’s not called ‘The Magic Molecule’ for nothing!
Don’t even ask the temperature at the end of January . . .
Auto
Good news, cloud tops are warming, the Earth is shedding more heat, life on the surface is sweet.
We really need surface air temperature variations that we can trust.
climanrecon:
Instead, lots of weather stations are being retired all over the US and the globe…without replacement.
If Climate is such an existential threat, wouldn’t it be wise to spend just $Millions…not even $Billions to establish a global network of a bare minimum of ~20,000 additional CERTIFIED automated stations…that could provide continuous temperature and humidity readings FROM WHICH we could integrate heat content over the entire day…and integrate temperatures over the entire day.
E.g. In the tropics it is often hot until noon when storms pass through…it gets near to 100 F for less than an hour, then around 80 F degrees the rest of the day and overnight and with low humidity for up to 18 of 24 hours. A report that only shows 100H/80L misrepresents the heat content at that location by almost 2 orders of magnitude. WUWT?
The whole science of Climate is trash compared to real science where the emphasis on gathering good supportable data is paramount.
In today’s Climate Science the data started out really sparce bad and it’s being allowed to get more sparce and worse. WUWT?
So a mahoosive increase in anthropogenic CO2 has made no difference at all….
It’s making the planet greener.
Chris
I’m not sure it matters – I did read that oxygen levels are decreasing globally. Considering that burning fossil fuels creates extra CO2 molecules but the process essentially uses up one O2 molecule in the atmosphere to create one C02 molecule, the net change in atmospheric molecules between CO2 and O2 would be zero.
So no extra ‘additional’ molecules from burning fossil fuels = no significant increase in atmospheric volume = no increase in the height of the effective emission temp = no change in the lapse rate = no hotspot = no warming. No worries!
Listen, could someone send some of that elusive Globull Warming my way? The forecast for next Tuesday is 19F daytime and 7F at night. I’m afraid. There may be some of those strange ice formations called “ice ickles” hanging from my roof again, and I don’t want them!
Send Globull Warming my way, willya? It’s chilly up here. Chillier further north.
Both the UK and the US had an ‘unusually’ cold November. Eastern Europe no different. Yet it was 0.5 above nominal. Was the Southern hemisphere really that much above nominal?
I smell a rat.
The data is presented on a global map. link There were, indeed, a few cool places but most of the globe showed slight warming.
Either you trust Dr. Spencer and the UAH data or you don’t. I do…
He’s not the only one processing satellite data. link As far as I can tell, UAH is the most credible.
It is not a case of Trust, it is a case of understanding.
ie the northern hemisphere had hundreds of cold records broken by whole degrees, in some cases many degrees.
Yet there were no offsetting hot records broken by degrees.
That says that the Satellite is not recording what is happening at the Surface because it is recording what is happening in the Atmosphere. What is happening in the Atmosphere is the Earth’s heat leaving for outer space.
How long will it take before there is a lot less heat leaving the Earth, just how cold does it have to get?
After all the TSI has not changed much, so the Earth shedding it’s heat on a nightly basis also won’t change much and the Seas & Oceans have a lot of energy stored to keep it all going.
Over the land not so much.
A C Osborn
“… Yet there were no offsetting hot records broken by degrees.”
Wow! How do you know that?
Can you show us any data confirming such a claim?
Depends which satellite and data set. The tempratres are recorded gobally and at equal density in the troposphere and at the surface. . So stating which data sets are . we are talking about is good start.
Because if there were they would have been plastered over every newspaper and on every TV program.
Well they weren’t were they?
Plus it was not just the USA that had record breaking cold & Snow, there was
Yakutia
Turkey
Switzerland
Austria
Canada
Iran
France
Kashmir
New Zealand
Algeria
Sweden
Siberia
Spain
Pakistan
Greenland
Kamchatka
Andes
Alps
Norway
Still there must have been lots of record breaking hot weather elsewhere that didn’t make the news.
“ Plus it was not just the USA that had record breaking cold & Snow ….”
There doubted was (as is only normal) BUT when added up ALL the regions covered by USH LT V6 recorded above average temps.
So warmer weather (obviously) predominated.
According to the MO, the UK in November was 0.9°C below the 1981-2010 average.
According to UAH parts of the lower troposphere above the UK where over 1.5°C below the 1981-2010 average.
I wouldn’t expect the lower troposphere temperatures to exactly mirror the temperature on the ground, and I’m skeptical of the accuracy of satellite data, but I don’t smell any rat here.
mid atlantic was way below normal as well
Here’s a link to the Met Office Central England Temperature record (CET). It goes back to 1659.
Have a look at the November temperatures. No worries here….
https://www.metoffice.gov.uk/hadobs/hadcet/cetml1659on.dat
If you squint you can see greta!
Bellman, Bob boder & co
The best is to look at this info (UK last month: November 2019):
https://www.metoffice.gov.uk/research/climate/maps-and-data/summaries/index
It is evident that Scotland was a lot colder than UK as a whole, what inevitably lets some people think we stay just in front of a GSM.
And that despite excellent contradiction here at WUWT by people who really know it better (Leif Svalgaard, Bob Weber, Javier for example).
Where do you think I get the data from? Yes Scotland was colder than England, and hence England was warmer than Scotland. The question I was answering was specifically about the UK.
I’m not sure what you mean by “in front of a GSM”. I see no evidence in the UK weather so far that we are about to enter a new ice age.
Bellman
” I see no evidence in the UK weather so far that we are about to enter a new ice age.”
I did not mean you personally, of course.
I meant a person naming me a troll.
Yes, sorry for my tone, I completely misread your comment.
Bellman
Thanks for this convenient reply.
UK November temperatures were only slightly below normal. Not unusually cold.
UK temp for November was 0.9c below average, that’s a long term average ,that’s nearly a full 1c that is unusual
With scottlands long term average 1.4c below average that’s a little more than unusual
These are long term averages .
An anomaly of 0.9°C isn’t that unusual when you are talking about just the UK.
November 2016 was colder than this November, 2010 was a degree colder than 2019. Since 1980 there have been at least 5 colder Novembers, including 1985 that was more than 2°C below 2019.
Cold, certainly, but not unusually cold compared with the last 40 years, and less unusual if you compare it with the whole of the record.
70% of the Earth’s surface is ocean. It has a huge impact on climate and is a massive buffer of heat from all sources (solar and ocean floor geothermal/volcano).
Water retains thermal energy 5 times better than dirt. That is why oceans have such a massive effect on climate. When the AMO goes negative then you will see substantial cooling.
https://www.e-education.psu.edu/earth103/node/1005
I just read an article yesterday about some researchrs who have concluded that several migratory bird species have become lighter and their wings shorter in the last four decades AND they suspect the changes are due to, you guessed it, climate change.
I’m no expert on evolution, but 40 years??? I’d love to know what Darwin would have to say.
My theory is that the wings have become shorter to make it easier for the migrating birds to avoid the blades of the windmill guilotines. 🙂
A smaller bird will be lighter and have shorter wing size. I am fully willing to believe that land use could cause some birds to become smaller.
If global warming were significant, you would expect birds to evolve longer wings to compensate for the reduced air density.
“I’m no expert on evolution, but 40 years???”
Not to mention that there is no evidence human-caused climate change is real, so connecting bird evolution to human-caused climate change is unsupportable scientifically.
People have become taller in the last 100 years. link That’s nutrition not evolution.
Assuming a change in a species’ size is due to evolution is a bad mistake unless there is a change in DNA.
A lot gets blamed on global warming that should be blamed on changing land use, etc.
Greeniew wanna put a stop to THAT too!
TomAbbott:
Natural variation within a species get more expression to changes in conditions fairly rapidly.
If a bug migrates through the territory that only eats the tiny worms, you’ll see fewer tiny worms in just two generations.
Not a bird, but peppered moths underwent rapid change because of coal emissions in England.
https://www.forbes.com/sites/grrlscientist/2019/10/30/industrial-britains-black-moths-one-gene-can-darken-them-all/#5cd34000641f
Debunked.
Also, that is not evolution. The ability to express the noted colors were always genetically present. No genes were added. I see this logical mistake all of the time. Evolution requires new genetic information. If the variability in these moths gets winnowed down to having less variability in the gene pool, you are devolving, and moving toward extinction, if anything.
Finally, at the end of it, you have a moth. Started with a moth and ended up with a moth.
Actually it is a form of evolution known as ‘directional selection’ . In this process natural selection causes an extreme phenotype to be preferred over others causing the allele frequency to change over time in the direction of that phenotype. When there is directional selection the advantageous allele increases as a result of differential survival. This is what occurred in the case of the moths in the UK.
There is an odd (unexpected) relationship between UAH and solar activity since then.
http://www.vukcevic.co.uk/UAH-SSN.htm
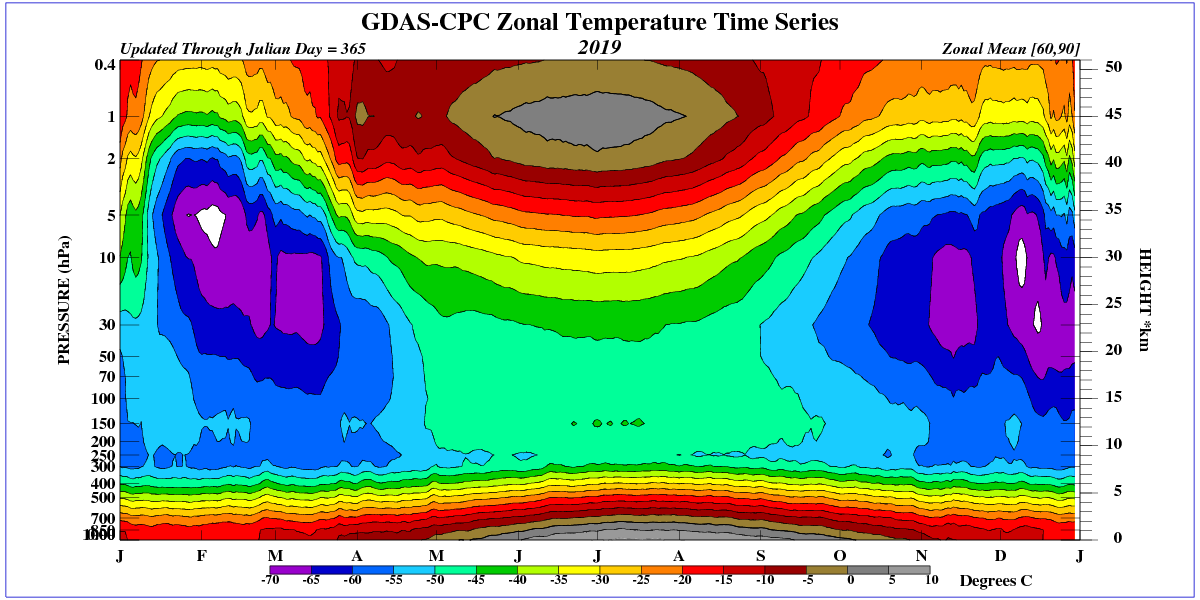
It is not difficult to predict that ionization of the lower stratosphere by galactic radiation increases during the minimum solar activity, which causes the temperature of the lower stratosphere to increase.
“About once a week, Spaceweather.com and the students of Earth to Sky Calculus launch a helium balloon with radiation sensors to the stratosphere over California. This is a unique monitoring program aimed at tracking the cosmic ray situation in Earths atmosphere. During each flight, our balloon passes through something called the Regener-Pfotzer Maximum, a layer of peak radiation about 20 km above Earths surface.”
https://spaceweatherarchive.com/2018/06/07/what-is-the-regener-pfotzer-maximum/
Ionization by GCR is not evenly distributed. It depends on the geomagnetic field and is concentrated in high latitudes.
http://sol.spacenvironment.net/raps_ops/current_files/Cutoff.html
See temperature anomalies of the lower stratosphere (82.5 S to 60.0 S).
http://images.remss.com/data/msu/graphics/TLS_v40/plots/RSS_TS_channel_TLS_Southern%20Polar_Land_And_Sea_v04_0.short.png
Temperature in the lower stratosphere in the north.
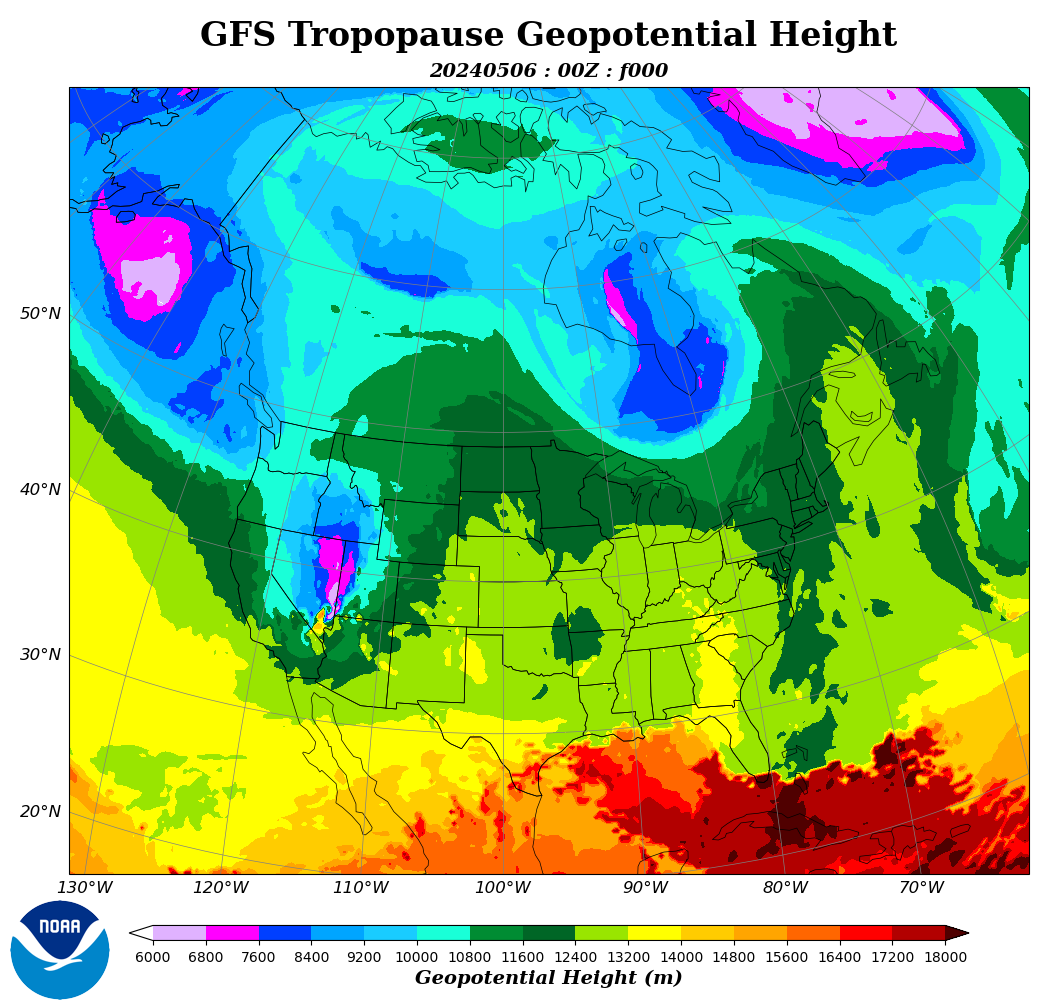
The problem is that the height of the tropopause in high latitudes changes a lot.
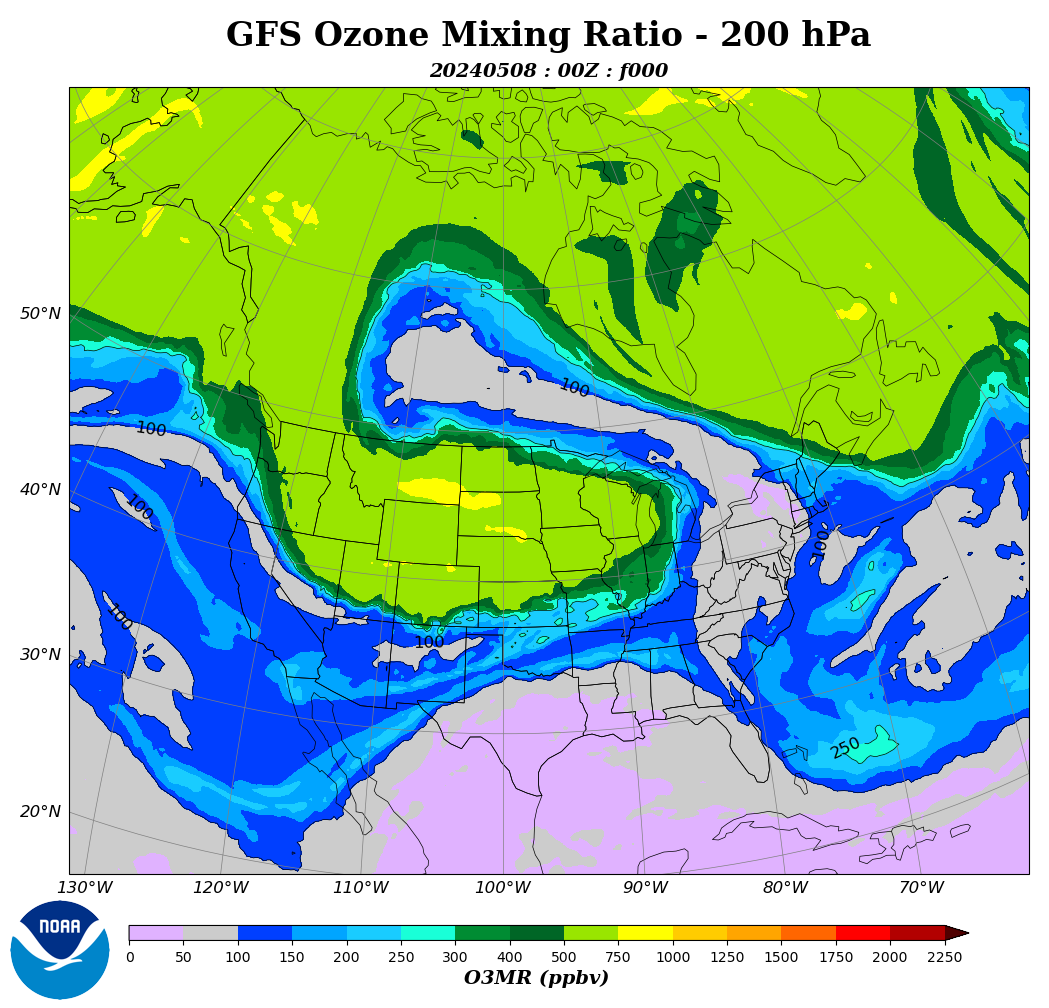
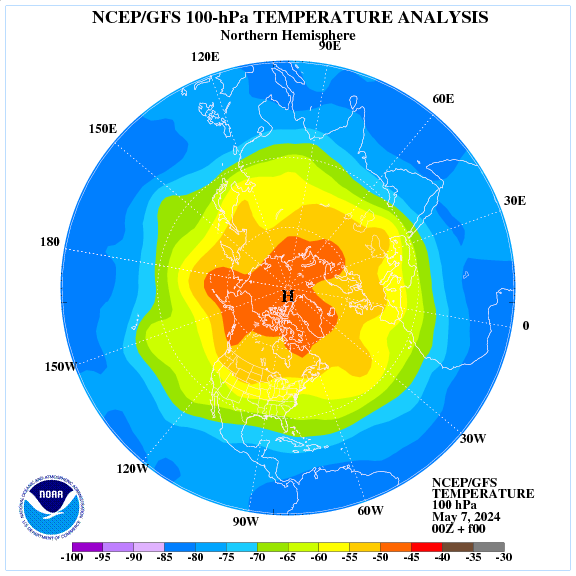
Stratospheric ozone is very well visible at the jetstream level.
I have a fundamental request for SST data, preferably satellite and unadjusted by the dark side at NASA/NOAA/Hadley et al. Please respond here if you know where I can check this safely and reliably.
END OF REQUEST. The rest is scientific explanation plus some opinion.
WHY? Shouldn’t temperatures be falling by now, if global climate is solar driven?
PROBLEM: Per the predictions according to the more deterministic, hence more likely to predict reality, approach to climate variability, caused by known solar cycles detectable in the temperature record, surface temperatures should be falling now, from roughly 2,000 to at least 2050 or so.
The records used for that determination are surface continental temperature, both proxies and direct values. Not the steadily climbing atmospheric temperatures above. But the 2000-2050 period will be a serious validation of solar cycles as causal of STs that solar cycle as dominant climate change science predicts will fall over 50 years to 2050, before a hiccupwards. Per Ludecke and Weiss, the best prediction of solar based change based on real observational evidence I have seen by far. But is it wrong somehow?
QUESTION: Is there a “safe” unadjusted set of ocean SSTs with the untampered merit of the UAH tropospheric figure? e.g. not adjusted to better represent their beliefs by the agents of the climate inquisition at NASA/NOAA/Met Office, etc..
Satellite best. Has uniform coverage, albeit very shallow definition of “surface”. I have a suspicion of buoys whose manipulation is so easy for the inquisition to do. Remote sensing is harder to mess with undetected.
WHY THE QUESTION? BECAUSE SSTs SHOULD BE GOING DOWN, IF THERE WAS NO AGW AND SOLAR CYCLES CONTROL GLOBAL TEMPERATURES, AS MORE RATIONAL SCIENTISTS BELIEVE THE EVIDENCE SHOWS, OR RATHER HAS SHOWN……
The satellites should show this trend at the ocean surface over 20 years, whatever the accuracy or systematic error.
POINT: I recall reading that upper atmospheric/GHE temperature lag SST temperatures, I hope that’s the correct way around, so SST could still be falling now while UAH atmospheric (LTTs?) are still rising, so the approach still works IF solar cycles do dominate climate variability AND the long term atmospheric change in the Troposphere lags SSTs by decades, but this needs testing,20 years after the downturn appeared due on 2,000 (see link)
If not, then there is something wrong with the idea of solar cycles as dominant cause in the record (but still very credible and repeatable so better than models that force their chosen ingredients to fit reality they invent and ignore other significant contributions by declaring them to be small or of no effect).
PERHAPS this problem is just in absolute timing, a phase lag in LTTs, but whatever it is will need some explaining IF SSTs are not falling now, 20 years after they should have started, based on the solar cycle science we have.
nb: I’m not concerned by continental STs, which are basically controlled by the oceans where most of the planets surface heat energy is absorbed and also stored. Continental temperature records are also flaky because of changing physical conditions at their location and the corruption of climate scientists who adjust them to suit their narrative before using the changed values in reports paid to prove a belief. Rigged evidence. While SSTs will vary regionally under the influence of relatively short term MDOs, this is all a natural part of the whole, so I consider that the average global average SST, unadjusted and acquired globally and remotey by satellite, is the safest measurement we have, also harder to justify adjustments to.
So that’s what I am asking for a reference to. If I am wrong anywhere, please do say why/how. Thanks for any practical directions to satellite SST’s for the last 2 decades.
ENDS
PS OPINION: Obviously the local temperatures people comment on above are irrelevant and rather US Centric, a very small percentage of the global surface with too much of its GDP and paid leisure time to type, as Maurice Strong also believed and the IPCC still tries to correct. US conditions are regional weather affected by MDO’s in pathetically short human lifetime scales, more climate noise than climate change, but snow is good for sceptics case with such received opinioneers, so matching the climate “scientists” and their box of frogs exaggerators like AOC and Saint Greta the angry with equally irrelevant and unqualified nonsense that clearly says the opposite based on the same changing weather is all good, creates more uncertainty in the great unknowing, uncertainty which hasn’t settled at all. Because they’re wrong (Freeman Dyson of the modellers). Steal the weapons of those who would control you and take your wealth from you to proft themselves, and use them against them.
nb: but do it better than the Native Americans did.
Also snow is great for skiing whilst also exposing Al Gore et al up for the lying con men they are, promoting bogus solutions to a non problem for the own profit.
El Niño & La Niña activity may be the wildcard with their own cycles of cool and warm.
Brian R Catt
“The satellites should show this trend at the ocean surface over 20 years, whatever the accuracy or systematic error.”
Aha. UAH’s trend over global sea surfaces since 1979 is around 0.11 °C / decade, compared with 0.18 over land, and 0.13 global.
Be patient, maybe it moves down somewhat later in the future!
Please feel free to look at UAH’s data itself:
https://www.nsstc.uah.edu/data/msu/v6.0/tlt/uahncdc_lt_6.0.txt
There you can see lots of LT sat data above oceans (Globe, NH, SH, Tropics, NH Ext, SH Ext, North Pole, South Pole).
*
Maybe I can help you a little bit in getting rid of your negative SST attitude by showing you a fair comparison of UAH6.0’s Global Ocean data with e.g. Hadley’s SST3 for the Globe (which of course has to be shifted from the mean of 1961-1990 up to UAH’s of 1981-2010, that is 0.21 °C):
https://drive.google.com/file/d/10FWtzbw-R8FUjI9SX5MoFahbLFIcIMg5/view
Brian R Catt:
There’s this on SST Trends from Tisdale.
https://web.archive.org/web/20190801213807/https://bobtisdale.wordpress.com/2011/11/19/17-year-and-30-year-trends-in-sea-surface-temperature-anomalies-the-differences-between-observed-and-ipcc-ar4-climate-models/
Thankyou. Still need the last 10 years but this is useful for what there is….
Brian R Catt:
There’s this from Tisdale…showing declining SST’s in all ocean basins since ~2000…in contrast to all the models.
https://web.archive.org/web/20190801213807/https://bobtisdale.wordpress.com/2011/11/19/17-year-and-30-year-trends-in-sea-surface-temperature-anomalies-the-differences-between-observed-and-ipcc-ar4-climate-models/
Thanks again. FYI I just found some satellite records from ESA in Nature, which go to 2016 and are satellite based, with cross checks to “buoys, talkin’ ’bout Buoys now, yeah yeah, buoys” etc. Anyway, I haven’t found the data in the papaper yet…
BTW I did find the HADSST data which shows a rise consistent with the LTTs, but has much less dense coverage, and is usually manipulated by corrupted climate scientists who depend on supporting the CO2 as causal consensus for their funding.
Here is the ESA paper if it is of interest. : https://www.nature.com/articles/s41597-019-0236-x.pdf
Brian,
The link to the raw data is in the Nature paper. The raw data is at
http://data.ceda.ac.uk/ neodc/aatsr_multimission/
I am curious to know why you think that all the climate data is “manipulated
by corrupted climate scientists” rather than accepting that the earth is actually
warming as every single data set shows? You claim
“SSTs SHOULD BE GOING DOWN,
IF THERE WAS NO AGW AND SOLAR CYCLES CONTROL GLOBAL TEMPERATURES,
AS MORE RATIONAL SCIENTISTS BELIEVE THE EVIDENCE SHOWS”
Surely a more rational approach would be to accept that global warming is real given that
temperatures are rising as measured by every single data set of global temperatures.
Since climate gate exposed so called scientists admitting to falsifying data and even more importantly the in house inquiry that was a total farce , I can well understand people not believing in any climate data. Nature are you kidding me they allowed a ocean temperature paper through that was later shown to be full of errors, funny how it passed the peer review process, the authors own review and natures review process, it took a independent researcher to expose the errors.
For a body the size of the Earth I would expect to see a very gradual slow down over a number of years then a plateau for a number of years where the temps will be seen to be doing nothing then a very gradual decline. It may even take several years to extract this signal from the noise. We must wait!
(I don’t really want it to cool down thanks)
We could use some of that global warming in Michigan… especially in winter. We’ve had the second January-in-November in a row.
Looking quite likely now that 2019 will be third warmest in the UAH data set, beaten only by the two super El Niño years of 1998 and 2016.
shame about all the snow
This is the warmest November in the UAH record, beating the previous record set in 2016 by 0.07°C.
2015, 2016, 2017 and 2019 are the 4 warmest Novembers on record. (2018 was the 6th warmest).
El Nino
How does a week El Niño in 2019 cause record breaking monthly temperature?
In his recent video presentation, Anthony pointed out that global warming is mostly due to night time and winter temperatures not being as low as previously. Folks have done that analysis on the thermometer data.
Has anyone used the satellite data to tease out the daily highs and lows as well as the winter vs. summer highs and lows?
commieBob
You might perform a descending sort of UAH’s monthly data, and to look at how many winter months appear at top of the sorted list once you have extracted all greatest El Nino anomalies appearing in summer months.
The latter you can observe by looking at the MEI (Multivariate ENSO) Index:
https://www.esrl.noaa.gov/psd/enso/mei/
clicking on the ‘MEI.v2 Values’, and shifting MEI by the 4-5 month lag between ENSO and UAH.
“Has anyone used the satellite data to tease out the daily highs and lows as well”
Satellites don’t measure daily highs and lows. They only get a couple of readings a day at any one location. And anyway, diurnal cycles are different in the range measured.
I think that’s because the majority of Earth survey satellites get up as close as they can and are orbiting at 18,000 mph on Polar orbits while the Earth spins underneath them to provide global surface data on a consistent surface density to a single satellite. Are there any geostationary climate related satellites?
PS I started to wonder if we were spinning 18 times faster so the centrifugal force on the surface was 1g, would our wafer thin tectonic plate covering just fly off? It’s only held on, and loosely together, by gravity, after all.
cb, It probably has a direct correlation to fossil fuel use – but before you get the knife out – I mean that the increase in energy use means more heat from expanding cities (increase the UHI effect) average that out and you will (must!) see warming. It won’t stop nature though it may slow it a tad.
Can the UHI effect really be detected at ~4 km above the surface and above the mid Atlantic and Pacific?
“In his recent video presentation, Anthony pointed out that global warming is mostly due to night time and winter temperatures not being as low as previously.”
As others have said, satellite data doesn’t give daily max and min temperatures, but looking at the seasonal differences in UAH there differences in overall trend trend, but the fastest warming is happening during the spring.
For the Northern Hemisphere
Winter (DJF): 1.7°C / century
Spring (MAM): 1.8°C / century
Summer (JJA): 1.3°C / century
Autumn (SON): 1.5°C / century
For the Southern Hemisphere, summers and winters are pretty much the same, with spring warming twice as fast as autumn.
Summer (DJF): 1.1°C / century
Autumn (MAM): 0.7°C / century
Winter (JJA): 1.0°C / century
Spring (SON): 1.5°C / century
There’s a lot of difference between individual months, so I expect different definitions of the seasons might produce different results. I’m not sure what, if anything, this proves. It’s assumed with a greenhouse effect, colder parts of the year will warm faster than hotter parts.
It’s a mixing problem in 3D. Warmer at one location means cooler at another, given that the over all, day to day energy balance of the atmosphere doesn’t really change much. We need to do a triple integration of the data. A simple “average” is meaningless. I’ll be wearing my union suit again here in WI even tho it’s 46*C in New Delhi today. So will the Sherpas on Mt Everest, and that’s not very far from New Delhi.
Guess that makes it the HOTTEST November on record, LOL, or at least that’s how it will be spun by the media the next several days.
Not sure why we constantly worry about global temperature when it really is about how much heat energy is in the atmosphere. Heating a parcel of air from 250K to 251K takes a whole lot less energy than heating one from 300K to 301K, so a degree increase in Barrow AK isn’t the same as Miami FL. There is basically no water vapor in the air at 250K.
It also takes a WHOLE to more energy to heat water than air, which means it also means water has to give up a lot more energy to drop a degree than air. And since we have water, water everywhere and the Sun has been particularly intense the last few decades, this change in Sun state might just take a while to play out. Why are we always looking for instant results?
A quiet Sun begets stratospheric warming which also influences temperatures in the polar and temperate parts of the world during the winter. Already we had a huge SSW in the Antarctic and we are looking at SSW’s in the Arctic this year that would mean bitter cold for the US and Europe if they form and persist. Also pushing the polar air down means the storm tracks at the edge of the polar/tropical air can get pretty vigorous. Should be a very interesting winter.. just glad I’m heating with natural gas and my electricity comes from a nuclear power station. Hope those of you in the NE US don’t run out of fuel.
rbabcock December 5, 2019 at 6:27 am
Already we had a huge SSW in the Antarctic and we are looking at SSW’s in the Arctic this year that would mean bitter cold for the US and Europe if they form and persist.
____________________________________
strong SSW too means quasi biennial oscillation:
https://www.google.com/search?q=quasi+biennial+oscillation+index&oq=quasi+bie&aqs=chrome.
Looking at the linked map, ….. what happened to that arctic amplification? Looks to be warmer over Antarctica, which I’m not sure I believe given there is no way for water to carry heat into the heart of Antarctica …. but again, other than what appears to be the hottest spot of the negative PDO, I don’t see any arctic amplification. The models don’t lie, and the Arctic should be cooking.
It will take awhile for the 2018-19 El Nino warmth to dissipate. Same thing happened after the 2016 El Nino. It took all of 2017 for the energy to fade away. This seems to be related to no Bjerknes feedback. With this feedback you tend to quickly switch over to La Nina conditions. That has not happened recently. However, the cooling does eventually play out.
So, I expect to see continued warm UAH values for the next few months. Probably won’t see a return to the baseline until next summer.
When I was earning my chemistry degree, it was pounded into us that our lab measurements always carried a margin of error and that reporting any numbers without a margin of error was wrong and resulted in an incomplete grade. Our statistics professors and our chemistry professors emphasized how important a margin of error was in correctly interpreting data. A large margin of error might make it impossible to claim any proof of theory based on those measurements.
Perhaps I’m missing it, but I don’t see any margins of error reported with the statement that November’s measurement was .09C greater than October’s measurement. If the margin of error is large enough, you might have to say it is unchanged. What is the proper margin of error? Include any systemic errors that might contribute to the difference.
I have an engineer son who often points out to me how frequently climate data graphs are missing the error bars and he believes this deliberate and dishonest. Engineers cannot get away with this but climate academics are not held to the same standards.
Ok, I know we don’t have old satellite data, but … What does the trend line look like going back to 1933? 1750? Probably not statistically significantly different from today’s “gradually warming for now”. So, how much decrease in warming should we expect based on past performance if we reduce CO2 emissions to 1800 levels?
“So, how much decrease in warming should we expect based on past performance if we reduce CO2 emissions to 1800 levels?”
We don’t know how much increased warmth is added by a doubling of CO2, therefore, we cannot know what the temperature would be by reducing CO2 a certain amount.
The official guess for a CO2 doubling (ECS) is 1.5C to 4.5C. But they are just guesses. The most recent studies of this subject indicate an ECS of less than 1.5C. But still a guess. We just do not know this number. Yet some people are proposing to turn our economy and our society upside down in order to fix a problem whose magnitude they can’t quantify.
There is a possiblity that the ECS is equal to zero. It hasn’t been ruled out. Yet the Elites want to go full steam ahead with drastic measures. Insanity. The voters need to vote these insane people out of office if they know what’s good for them.
According to the Guardian, climate models have accurately predicted global heating. It discusses a paper published by Zeke Hausfather. I haven’t had a chance to read it yet but it sounds a bit like turning water into wine but not as useful.
https://www.theguardian.com/environment/2019/dec/04/climate-models-have-accurately-predicted-global-heating-study-finds
Author is Dana Nuccitelli, say no more.
Because the climate models are fundametally flawed that would be remarkable indeed.
Are the data measured to a precision of 0.01 deg C?
actually 0.01 +- 1.00 /s
most likely not, it’s an average of hundreds of individual readings taken during 30 days across the globe