By Allan MacRae and Joseph D’Aleo, October 2019
Introduction – Catastrophic Anthropogenic Global Warming – A Failed Hypothesis
The Catastrophic Anthropogenic Global Warming (“CAGW”, aka “Global Warming”, “Climate Change”, “Climate Crisis”, “Climate Emergency”) scare is a failed hypothesis and the greatest scientific fraud in history. Global warming alarmism has been promoted by political extremists and believed in by their gullible acolytes for decades, even though there is no credible evidence that catastrophic global warming exists in reality, and ample evidence that the CAGW hypothesis has been falsified.
The failed CAGW hypothesis assumes that increasing atmospheric CO2 from fossil fuel combustion drives dangerous runaway global warming. The alleged evidence for this fraud is climate computer models that greatly over-predict current observed warming, typically by 300 to 500%. These climate models deliberately employ excessively high assumed values of climate sensitivity to CO2, and are designed to create false alarm.
Global warming has slowed since the mid-1990’s, so the climate alarmists alleged that increased atmospheric CO2 from combustion of fossil fuels will cause wilder, more chaotic weather. There is ample evidence that this allegation is also false. Weather has actually become less chaotic.
The Mann hockey stick (MBH98 etc.), the Climategate emails, historical temperature data revisions and the thuggish tactics of the climate extremists provide ample evidence of fraud.
Credible Evidence That CO2-Driven Global Warming/Climate Change Alarmism Is A False Crisis
Atmospheric CO2 concentrations have been much higher in geologic time, and runaway global warming has never occurred in the billions of years of Earth history. Global temperatures have been much warmer and also much colder over geologic time. Earth is now in a glacial period, when mile-thick ice sheets cover much of the planet for about 100,000 years, interrupted by interglacials that last about 10,000 years. Earth is now in a warm interglacial, but the last glaciation ended only about 10,000 years ago, so Earth is due for another glaciation.
Temperatures were much higher during the Medieval Warm Period circa 900-1300 AD, and then humanity experienced the Little Ice Age circa 1300-1850 which caused enormous suffering and the deaths of millions.
The USA has some of the best surface temperature data in the world. The hottest USA surface temperature records occurred in the 1930’s, before fossil fuel combustion accelerated circa 1940.

Fossil fuel combustion accelerated strongly at the start of World War II, and global temperatures COOLED significantly from 1940 to 1977. That one observation is sufficient to disprove the CAGW hypothesis – global temperatures do NOT rise catastrophically due to increasing atmospheric CO2.
Even if it is assumed that ALL the observed global warming is ascribed to increasing atmospheric CO2, the following two studies calculated that the MAXIMUM climate sensitivity to a hypothetical doubling of atmospheric CO2 is only about 1 degree C, which is too low to cause dangerous global warming.
Christy and McNider (2017) analysed UAH Lower Troposphere data since 1979.
Lewis and Curry (2018) analysed HadCRUT4v5 Surface Temperature data since 1850.
That 1C/doubling is not an average, it is a MAXIMUM climate sensitivity, since some or most of the observed warming could be due to natural causes. Repeating, climate computer models used by the IPCC and other global warming alarmists employ climate sensitivity values 3-to-5-times higher than 1C/doubling, in order to create false fears of dangerous global warming.
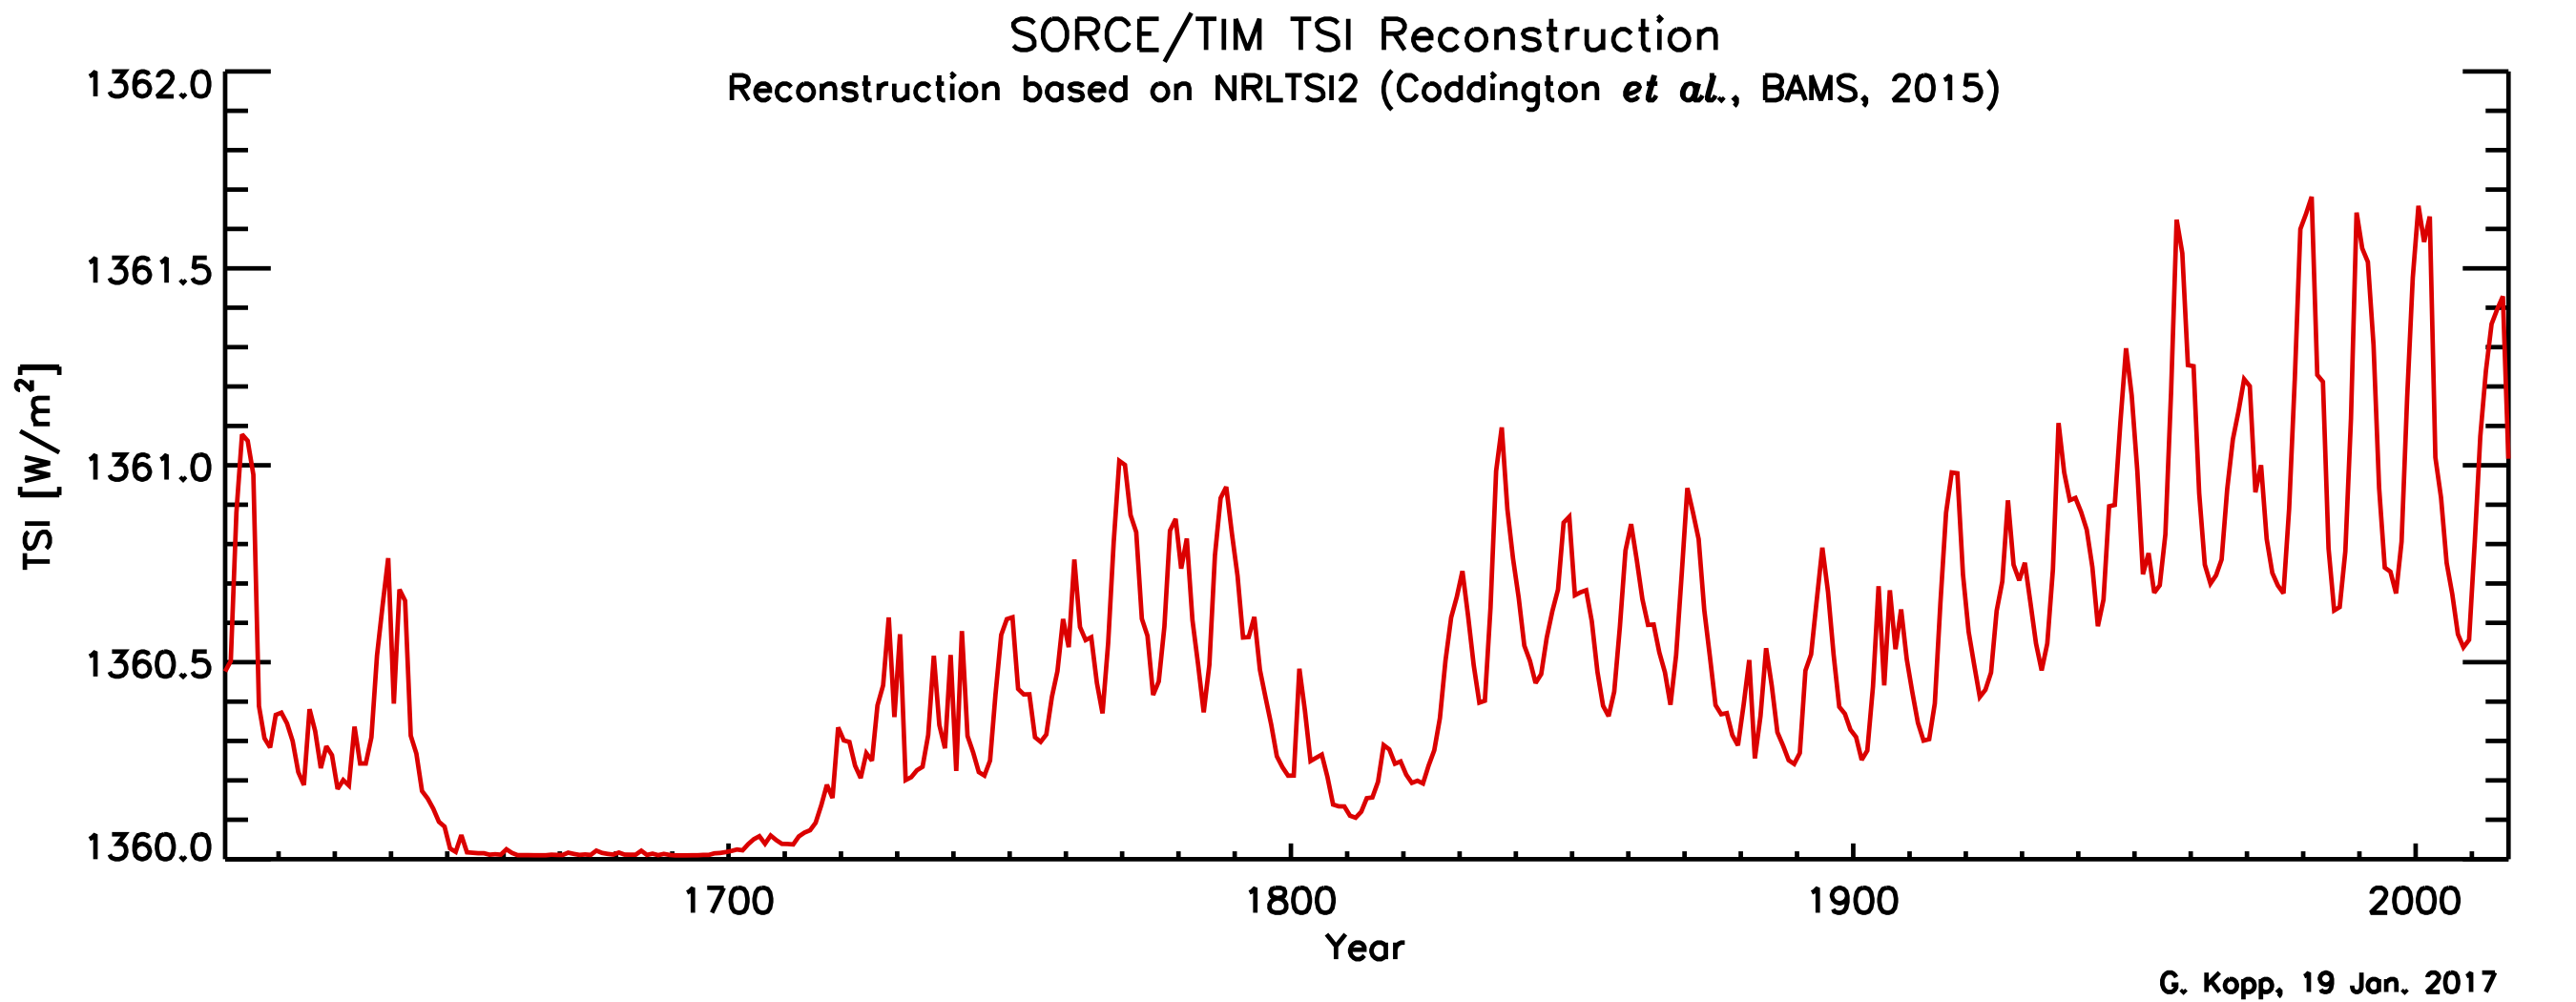
It is highly probable, based on the evidence, that solar activity, not atmospheric CO2, is the primary driver of Earth’s temperature. In astrophysicist Willie Soon’s recent video, he shows the Sun-Climate relationship and provides his conclusions. There is strong correlation between the Daily High Temperatures and the Solar Total Irradiance (54:51 of the video):
… in the USA (55:02),

Canada (55:16),

and Mexico (55:20).

Solar Total Irradiance is now close to 1360 W/m2, similar to the lows of very cold periods circa 1700 and 1800. Atmospheric temperatures should be cooling in the near future – maybe they already are.

http://woodfortrees.org/plot/pmod/offset:-1360/scale:1 Note: Offset = -1360 means 0 = 1360.
We do know that the Sun is at the end Solar Cycle 24 (SC24), the weakest since the Dalton Minimum (circa 1800+), and SC25 is also expected to be weak. We also know that both the Dalton Minimum and the Maunder Minimum (~1650 to ~1700) were very cold periods that caused great human suffering.

http://lasp.colorado.edu/home/sorce/files/2011/09/TIM_TSI_Reconstruction-1.png
Global temperature is certainly NOT primarily driven by increasing atmospheric CO2, because CO2 changes LAG global temperature changes in time, both in the ice core proxy record and also in the modern data record. The Vostok ice core record shows a lag of CO2 after temperature of ~~800 years.

In January 2008, Allan MacRae made the following major observations in this paper.
Reference: “Carbon Dioxide Is Not The Primary Cause Of Global Warming”, January 2008
http://icecap.us/images/uploads/CO2vsTMacRae.pdf
a. The velocity of changes of atmospheric CO2 [dCO2/dt] varies ~contemporaneously with changes in global temperature.
b. Therefore the integral of dCO2/dt, changes in atmospheric CO2, lag changes in global atmospheric temperature by ~9 months.
The very close relationship of dCO2/dt (red) vs global temperature (blue) is clearly apparent. Major volcanoes (some VEI5 and most VEI6 events) disrupt the relationship.

Integrating the dCO2/dt data gives changes in CO2, which lag changes in temperature by ~9 months.
The above figures employ Mauna Loa (mlo) CO2 data. Similar results were observed using global CO2 data, as in MacRae 2008. The impact of major volcanoes is apparent.
The 12-month delta in CO2 is used to allow for the “seasonal sawtooth” in the Keeling Curve.
The ~9-month lag of atmospheric CO2 changes (red) after temperature changes (blue) is apparent.

In January 2013, a similar observation was made by Humlum, Stordahl and Solheim – that atmospheric CO2 changes lag global sea surface and air temperature changes by 9-12 months.
Reference: “The phase relation between atmospheric carbon dioxide and global temperature”
https://www.sciencedirect.com/science/article/pii/S0921818112001658
a. Changes in global atmospheric CO2 are lagging 11–12 months behind changes in global sea surface temperature.
b. Changes in global atmospheric CO2 are lagging 9.5–10 months behind changes in global air surface temperature.
c. Changes in global atmospheric CO2 are lagging about 9 months behind changes in global lower troposphere temperature.
“The phase relation between atmospheric carbon dioxide and global temperature”, January 2013

Our Predictive Track Record Is Excellent; The IPCC and Acolytes Have Been Consistently Wrong.
The ability to predict is probably the best objective measure of scientific competence. The IPCC and its global warming alarmists have consistently failed – every one of their scary global warming/climate change predictions has failed to happen.
“Climate science does not support the theory of catastrophic human-made global warming – the alleged warming crisis does not exist.”
“The ultimate agenda of pro-Kyoto advocates is to eliminate fossil fuels, but this would result in a catastrophic shortfall in global energy supply – the wasteful, inefficient energy solutions proposed by Kyoto advocates simply cannot replace fossil fuels.”
Both these above statements are demonstrably correct to date. Despite accelerating combustion of fossil fuels, especially since 1940, and increases in in atmospheric CO2 measured since 1958, the world has experienced only hugely beneficial increases in crop yields and mild, beneficial global warming.
Despite the decades-long campaign to eliminate them, fossil fuels have retained their 85% share of global primary energy, and the rest is mostly nuclear and hydro. Despite tens of trillions of dollars in squandered subsidies, green energy still comprises only 4% of global primary energy. Due to intermittency, grid-connected green energy schemes do not even significantly reduce CO2 emissions, since they require almost 100% spinning-reserve, typically fossil fueled, to fill-in when the wind does not blow or the sun does not shine.
CO2 Concentration is Far Too Low; Earth Is Colder-Than-Optimum for Humanity and the Environment
The radical greens could not be more wrong. Contrary to green propaganda, atmospheric CO2 is far too low, and Earth is colder-than-optimum for humanity and the environment.
Atmospheric CO2 concentration is not too high – it is far too low for optimal plant and crop growth, and far too low for the continued survival of terrestrial life on Earth. CO2 reduction and sequestration schemes are not just wrong; they are costly, destructive and imbecilic.
Cold weather kills about 20 times as many people as warm and hot weather. Excess Winter Deaths in the USA average about 100,000 per year – equivalent to two 9-11’s per week for 17 weeks EVERY YEAR.
Excess Winter Deaths are calculated as the difference between deaths in the four winter months (December to March in the Northern Hemisphere) less half the deaths in the eight non-winter months.
Excess Winter Deaths occur worldwide, even in warm countries like Thailand and Brazil. An approximate-low estimate of Excess Winter Deaths is 2 million souls per year worldwide.
More than 50,000 Excess Winter Deaths occurred in England and Wales during the winter of 2017-18 – an Excess Winter Death rate about THREE TIMES the per-capita average in the USA and Canada. Proportionally, that is about 35,000 more deaths in the UK than the average rates of the USA and Canada. Excessively high energy costs in the UK due to false global warming/anti-fracking hysteria are a major part of the cause of these Excess Winter Deaths – driven by global warming alarmists and their corrupted minions in governments and institutions.
Predictions of Imminent Global Cooling, Starting Anytime Soon
“Over the past one thousand years, global temperatures exhibited strong correlation with variations in the sun’s activity. This warming and cooling was certainly not caused by manmade variations in atmospheric CO2, because fossil fuel use was insignificant until the 20th century.
Temperatures in the 20th century also correlate poorly with atmospheric CO2 levels, which increased throughout the century. However, much of the observed warming in the 20th century occurred before 1940, there was cooling from 1940 to 1977 and more warming after 1977. Since 80 per cent of manmade CO2 was produced after 1940, why did much of the warming occur before that time? Also, why did the cooling occur between 1940 and 1977 while CO2 levels were increasing? Again, these warming and cooling trends correlate well with variations in solar activity.
Only since 1977 does warming correlate with increased CO2, but solar activity also increased during this period. This warming has only been measured at the earth’s surface, and satellites have measured little or no warming at altitudes of 1.5 to eight kilometres. This pattern is inconsistent with CO2 being the primary driver for warming. If solar activity is the main driver of surface temperature rather than CO2, we should begin the next cooling period by 2020 to 2030.”
For the past ~five years, MacRae has written that global cooling would start closer to 2020. This global cooling will start sporadically, at different locations in the world. Similar predictions of global cooling are included in the Appendix.
It is notable that planting of crops has occurred one month later-than-usual in North-central growing areas of North America in both 2018 and 2019. In 2019, there were many more record U.S. all-time daily low temperatures than record highs for the last 30 days, 365 days and year-to-date. These events may just be weather, not climate, or they could be the early indicators of global cooling.
The U.S. Department of Agriculture publishes a weekly crop report:
Crop Progress NASS Weekly, Mondays
https://usda.library.cornell.edu/concern/publications/8336h188j
The October 21, 2019 report is here: https://downloads.usda.library.cornell.edu/usda-esmis/files/8336h188j/qr46rf238/fx71b191j/prog4319.pdf


The North-central 2019 harvest was hit hard by wet, cold weather. Meteorologist Joe D’Aleo explains:
The growing season in North America has been especially challenging.
| Crop Challenges 2019
· Greatly delayed or aborted planting ° 19 million acres did not get planted. ° Late cold, snow, rain and flooded fields. · Shallow roots caused by excess rain · Soil Compaction · Mid to late summer dryness and heat to the South and East. · North-central growing areas saw excessive rainfall AND not enough sun or Growing Degree Days · Early snows in Northwest growing areas · Half the corn and soybean crop was not mature enough to harvest until mid-October · The soybeans and corn still in the field are delaying the planting of winter wheat |

The cold weather that developed early in the year persisted through the summer into the fall in the North-central region, which helped move warmth into the Southeast. Heavy rains fell along the contrast zone between the extremes.

With the cold, the Growing Degree Days were well below normal in North-central growing areas, and above in the Southeast.

See the heavy rains in the central Corn Belt early in the growing season, shifting Northwest late.

Corn and soybeans progress on average trailed well behind the normal.

Corn maturity as of October 20th 2019 was most behind in the Dakotas Southeast to the Great Lakes and Ohio Valley. Note the much better conditions in the South.

Newman’s analysis of 1980 showed the ideal growing areas of the Corn Belt would shift North with warming and South with cooling by approximately 144 kilometers per 1°C. The current corn growing area is shaded.

Newman, J. E. (1980). Climate change impacts on the growing season of the
North American Corn Belt. Biometeorology, 7 (2), 128-142.
The 2019 soybean harvest also trailed the 5-year average by 18% though the leaf drop was just 3% behind average.

Even where the first freezing temperatures came on time, the delays meant losses of corn not reaching black layer maturity and soybeans that had not dropped their leaves.

Very early snows arrived with the early cold in the North-central region affecting corn, soybeans, spring wheat and small grains, there and in parts of the Canadian Prairies.

The yield estimate on October 10th marks the first season in 6 years below the trend line.

Production estimates are down slightly but are expected to decline further after the effects of the early cold and snows are considered.

The soybean yield also is below trend line for the first year in 6 years. Projected soybean production is down more than corn production.


More areas will see below freezing temperatures and even snow before November.


Summary and Conclusions
It is notable that crop planting has occurred one month later-than-usual in the North-central growing areas of North America in both 2018 and 2019. While warm summer weather saved the 2018 crop, in 2019 the Northern corn and soybean harvests were devastated by a cold summer and early cold weather. In 2019, there were many more record U.S. all-time daily low temperatures than record highs. These events may just be weather, not climate, or they could be the early indicators of global cooling.
Appendix – Other Predictions of Global Cooling, In Chronological Order Since 2003:
In 2003, Dr. Theodor Landscheidt wrote a paper predicting serious global cooling:
“Analysis of the sun’s varying activity in the last two millennia indicates that contrary to the IPCC’s speculation about man-made global warming as high as 5.8° C within the next hundred years, a long period of cool climate with its coldest phase around 2030 is to be expected.”
In 2005, Piers Corbyn predicted cooling by 2040.
On the 2nd February 2005, he gave this presentation to the Institute of Physics Energy Management Group. It contained the following statement:
“In the next 5 or 10 years warming is likely to be maintained as a transpolar shift occurs. This will be followed by the magnetic pole moving away from the geographic pole, a decrease in solar activity, a Southward shift in the Gulf Stream and considerable world cooling by 2040 AD.”
In 2006, NASA predicted that
“Solar Cycle 25, peaking around the year 2022, could be one of the weakest in centuries”.
Khabibullo Abdusamatov and colleagues at the Russian Academy of Science stated in 2006:
“Global cooling could develop on Earth in 50 years and have serious consequences before it is replaced by a period of warming in the early 22nd century…
On the basis of our [solar emission] research, we developed a scenario of a global cooling of the Earth’s climate by the middle of this century and the beginning of a regular 200-year-long cycle of the climate’s global warming at the start of the 22nd century.”
Khabibullo Abdusamatov said he and his colleagues concluded that a period of global cooling similar to one seen in the late 17th century – when canals froze in the Netherlands and people had to leave their dwellings in Greenland – could start in 2012-2015 and reach its peak in 2055-2060.
He said he believed the future climate change would have very serious consequences and that authorities should start preparing for them today because “climate cooling is connected with changing temperatures, especially for Northern countries.
Nigel Weiss, University of Cambridge, stated in 2006:
“If you look back into the sun’s past, you find that we live in a period of abnormally high solar activity. Periods of high solar activity do not last long, perhaps 50 to 100 years, then you get a crash. It’s a boom-bust system, and I would expect a crash soon.”
Leif Svalgaard, Stanford University, stated in 2006:
“Sunspot numbers are well on the way down in the next decade. Sunspot numbers will be extremely small, and when the sun crashes, it crashes hard. The upcoming sunspot crash could cause the Earth to cool.”
In 2007, Lin Zhen-Shan and Sun Xian wrote in “Multi-scale analysis of global temperature changes and trend of a drop in temperature in the next 20 years”:
“… Signs also show a drop in temperature in China on century scale in the next 20 years. (4) The dominant contribution of CO2 concentration to global temperature variation is the trend. However, its influence weight on global temperature variation accounts for no more than 40.19%, smaller than those of the natural climate changes on the rest four timescales. Despite the increasing trend in atmospheric CO2 concentration, the patterns of 20-year and 60-year oscillation of global temperature are all in falling. Therefore, if CO2 concentration remains constant at present, the CO2 greenhouse effect will be deficient in counterchecking the natural cooling of global climate in the following 20 years. Even though the CO2 greenhouse effect on global climate change is unsuspicious, it could have been excessively exaggerated. It is high time to re-consider the trend of global climate changes.”
Correction: in this thread (above) I used the word “undo” when I meant “undue”, as in undue suffering due to global cooling.
Or more specifically, Northern Hemisphere cooling, which has been happening for ~6,000 years ever since the Holocene Climatic Optimum. The recent (post-LIA) warming has been slight relative to the longer trend, and it is ending. The worm is turning back towards cooling.
The good news is that there is not going to be a Hotpocalypse. The IPCC, AOC, Al Gore, and all the alarmist modellers are wrong about that. The bad news is that even slight cooling, which is apparently inevitable, is going to be disastrous.
Alarmism is not completely useless — if there is actually a disaster looming. Point of fact is that the Earth is already too cold and getting colder. Doing crazy stuff like carbon sequester, carbon taxation, atmospheric aerosols, banning fossil fuels, etc. is totally counter productive for what ails our Planet.
We are the fire creatures. We were put here by Darwin (metaphorically speaking) to warm the place up. We need to get after that. We need at least to be open to suggestions.
One idea, offered (above) by Allan MacRae, is albedo control of ice sheets. Not easy but possibly doable — however, will it work? Another is increase greenhouse gases. Careful here, though, because the most potent GHG is water vapor and clouds = albedo. Another is improve oceanic circulation, possibly by breaking off Antarctic ice shelves and towing them to Equatorial waters. Or mass dredging of the Bering Straight to get that heat exchanger working. Black roofs, not white ones.
Whatever the solution set, we need to concentrate on that and not on cooling the Earth. She’s already cold enough and getting colder. Warmer Is Better. Fight the Ice.
“Mike Dubrasich October 28, 2019 at 6:45 am
Correction
One idea, offered (above) by Allan MacRae, is albedo control of ice sheets. Not easy but possibly doable — however, will it work? Another is increase greenhouse gases. Careful here, though, because the most potent GHG is water vapor and clouds = albedo. Another is improve oceanic circulation.”
___________________________________________
OK, changing albedo of ice sheets, clouds are thermostats for the atmosphere …
https://www.google.com/search?q=ice+sheets+albedo+change&oq=ice+sheets+albedo+change&aqs=chrome.
In the end it’s null sum games,
incoming energy – work done on Planet Earth ( thermodynamics, fluid mechanisms … ) equals outgoing energy.
The big mover is the Sun.
Excess ozone over eastern Siberia modifies the polar vortex pattern. This pattern has an effect on extremely low temperatures in the west of the US.
https://www.netweather.tv/charts-and-data/stratosphere
Not much of a crisis,just cooling,and times have been cooler before. Please no cooling alarmism after a single below standard crop season.
Well we have a forecast high of 33 F in Wichita on Oct 30th 2019. That is a mere 31 F below average. No big deal right? If it were 31 F above average and we had a forecast high of 95 F (beating record by 7 F) then the media would be reminding us that weather is not climate, right? If we were going to be 10-30 F average all week they wouldn’t be saying anything about a climate change driven heat wave right?
Global temps will fall like a rock once a strong La Nina actually forms – haven’t had one since 2011-12. I’m with Allen, I bet the next decade will have a cooling trend.
“The alleged evidence for this fraud is climate computer models that greatly over-predict current observed warming, typically by 300 to 500%. ”
I have a serious problem with this claim. Hansen (1988-A) has a hot bias over 2 but the rest of the prominent model runs over the years have a bias somewhere in the 1.3 to 2.0 range (1.0 being unbiased). The models run hot and I suspect intentionally so, but I would urge the authors to stick more to the data, use less inflammatory and accusing language, and carefully support their claims. Otherwise, they just get chucked into the ‘denier’ trash bin.
Two facts falsify AGW: 95% of all models have been wrong & there has been a 15 year pause in global warming.
Neither falsifies AGW but both suggest that AGW is much smaller than advertised
Both fact, and many others, falsify CAGW.
Both facts, and many others, falsify CAGW.
Mary Brown spoke of AGW. You say CAGW is falsified. Apples and oranges. Tell us Mr. Macrae, where and when has AGW (what Mary spoke of) been falsified?
To Karl:
James F. Evans October 28, 2019 at 8:26 am
Two facts falsify AGW: 95% of all models have been wrong & there has been a 15 year pause in global warming.
_____________________________________
Both facts falsify AGW.
Both facts falsify CAGW.
Both facts falsify both AGW and CAGW.
Thanks for another superb article, and for your impressive work to expose these ridiculous global scale frauds.
btw – here’s another video of the Canning Town protesters: https://www.youtube.com/watch?v=kHOr2WH7V1k
Keep up the great work.
Last month the warmers were writing about an unusually warm September, which has turned into a cold “Snowtober”, which probably shortened the growing season even more after an unusually cold and wet spring. Carbon dioxide in the air doesn’t seem to have much effect on temperature, but it does speed up plant growth, which could be useful in short growing seasons.
Drill, baby, drill and frack, baby, frack!
OMG, the only thing worse than a global warming alarmist is a global cooling alarmist… Amazing how can somebody criticize global warming alarmists because of real world data… and then go and predict cooling! Based on which real world data? Haven’t we just finished a weak solar cycle? Where is our temperature decline? My god… I would be laughing if it weren’t so sad.
“Where is our temperature decline?”
All over North America, for a start. We’ve been breaking ‘coldest temperature ever’ and ‘earliest/most snow ever’ records in many, many places in the last few weeks.
Yeah, maybe the weather will all suddenly return to ‘normal’ next year, but given the predictions that we’re heading into even lower solar activity in the next cycle, I doubt it.
@ur momisugly Joe D’Aleo, (OT) could you maybe get Mr Shanahan, Mr Barak and Mr Taylor to consider a senior citizen discount for Weatherbell membership?
I just competed a study of all warm and cold periods over the past 800,000 years and discovered what must be the cause of the Ice Ages and other climate changes. I looked at oxygen isotope temperatures, deuterium temperatures, CET temperatures, sunspot numbers, total solar irradiance, production rates of beryllium-10 and radiocarbon, and cosmic ray intensity for every warm and cold period (for which data is available) in the past 800,000 years. The data is truly remarkable˗˗every cool period without exception was characterized by low sunspot numbers, indicating low strength of the sun’s magnetic field, and high production rates of beryllium˗10 and radiocarbon, indicating high intensity of cosmic rays. Every warm period was coincident with high sunspot numbers and low production rates of beryllium˗10 and radiocarbon. Thus, it is unequivocally clear that climate changes, large and small, are driven by fluctuations of the sun’s magnetic field. A book, “The solar magnetic cause of climate changes and origin of the ice ages” with full documentation is available on Amazon.
Don
Thanks so much for that remark. It makes so much sense. And I know exactly what you mean. A lower strength of the solar magnetic field strength on the sun means that more of the most energetic particles are able to escape from the sun, There is a window TOA through which only that much energy is allowed. I call it God’s window.
I was just trying to explain to someone on the other end of the world how the GB cycle works.
https://www.climategate.nl/2019/10/84861/comment-page-2/#comment-2280961
I doubt if he will understand it. Click on my name to read the English version of my article.
Thank you DonE. I agree with your conclusion. How about a paper on wattsup?
Bingo, Don! You’re about to hit another Home Run, with Shaviv in the batting circle and Svensmark and Soon already on base.
Nicely done!!!
Don Esterbrook:
Although you considered a large number of variables, you failed to consider the ACTUAL cause of our changing climate, which is simply the amount of dimming SO2 aerosols in the atmosphere , which are primarily of volcanic origin. There is no observable effect apart from changing levels of SO2 aerosols.
A case in point: Between 1310 and 1315, there were annual VEI5 volcanic eruptions which spewed dimming SO2 aerosols into the atmosphere, causing extreme cooling and causing the Great Famine of 1315-13i7.
Essentially every example of temperature increases or decreases can associated solely with changing SO2 aerosol levels.
Burl Henry October 31, 2019 at 10:03 am
[ ] the amount of dimming SO2 aerosols in the atmosphere , which are primarily of volcanic origin. There is no observable effect apart from changing levels of SO2 aerosols. [ ] volcanic eruptions which spewed dimming SO2 aerosols into the atmosphere, causing extreme cooling and causing the Great Famine of 1315-13i7.
Essentially every example of temperature increases or decreases can NOT BE associated SOLELY with changing SO2 aerosol LEVELS –
because NOx aerosols first are condensation nuklei for atmospheric humidity starting falling rain.
Shakespeare Years aren’t irrésistiblement associated with “famine” years:
https://www.google.com/search?q=shakespeare+and+the+rain+it+raineth+every+day&oq=Shakespeare+and+the+rain+&aqs=chrome.
Irrésistiblement associated with “famine” years are hungerstones:
https://www.google.com/search?q=hunger+stones+europe&oq=hungerstonez&aqs=chrome.
Johan Wundersamer:
You state that “NOx aerosols are first condensation nuklei for atmospheric humidity starting falling rain”
For this to be true, there would have to be average anomalous global temperature changes associated with changing levels of NOx aerosols, and there is no evidence of any such changes apart from those caused by changing levels of SO2 aerosols
Thank you for your reference to the Hunger Stones!
We are having a second snowfall this year in Colorado at New Mexico border, and it’s way too early. Today at noon the temperature is still below freezing point.
I think that observations and predictions in this article are overwhelmingly correct.
A. Mac Rae & J. D’Aleo
“The hottest USA surface temperature records occurred in the 1930’s…”
Correct.
A far better presentation of that fact, without any restriction to stations’ life time, was made by John Christy as well, and published e.g. on Roy Spencer’s blog:
http://www.drroyspencer.com/wp-content/uploads/US-extreme-high-temperatures-1895-2017.jpg
The same can be shown using 18000 CONUS GHCN daily stations instead of those few of the USHCN data set:
https://drive.google.com/file/d/1qGV5LfKw_lFKNdZMlq15ZHz6sA1CA294/view
But then, when you extend your focus from the little US corner (no more than 6 % of the land masses) to the Globe as a whole (nearly 40000 GHCN daily stations), you obtain this:
https://drive.google.com/file/d/1TFdltVVFSyDLPM4ftZUCEl33GmjJnasT/view
You see that the 1930’s are a pure CONUS story.
Btw, please stop telling us that US weather stations are worldwide the only accurate ones, that is simple manipulation.
Rgds
J.-P. D.
“You see that the 1930’s are a pure CONUS story.”
See the charts I posted above, Bindidon. They show the 1930’s warmth was not restricted to the CONtinental United States. The 1930’s were as warm as today all over the globe. Or at least, the places that recorded the temperatures, and agreed, there were not a large number of recording stations but the records we do have, resemble the US surface temperature chart.
Tom Abbott
Typical reaction of a ‘skeptic’ who sees a global view and refutes it with the help of a few examples.
And even more typical is for ‘skeptic’s to
– always refute data not fitting to their egocentric narrative because of a “number of recording stations” being not large enough,
but
– silently agree with the same, arbitrarily sparse data when it suddenly confirms what they guess.
Finally, it is one more time typical for ‘skeptic’s to ignore the fact that the warming does not come from increasing maxima, but from increasing minima all over the world, CONUS INCLUDED.
– always refute data not fitting to their egocentric narrative…
You mean like altering historic data?
the fact that the warming does not come from increasing maxima, but from increasing minima…
AKA UHI.
So just what is the UHI adjustment that alarmists use to compensate for growing infrastructure?
Gator
Why should I reply to a polemist lacking even smallest knowledge concerning what he writes about? Many of the comments you publish here are somewhat ‘below the belt’.
Instead of keeping polemic, try (1) to (really) digest this:
http://static.berkeleyearth.org/papers/UHI-GIGS-1-104.pdf
and (2) to look at this:
https://drive.google.com/file/d/1zg9M-GZwNoIBln404Ay0voAL8V4PmSdK/view
This is a comparison of
– all available USCRN station records (a bit over 200)
with
– all GHCN daily records available for CONUS (over 8000).
As you know, USCRN is the ‘pristine’ station set acknowledged by surfacestations.org; these stations are know to have far less UHI influence than all others.
Why then are the running means over the two sets so similar?
I’m sure you will invent something ‘accurate’ to explain 🙂
Alarmists are the inventors, inventing new temp records, inventing feedbacks, inventing doomer fantasies.
I have no need to invent. The study has been done.
http://www.surfacestations.org/
It found that roughly 80% of the stations studied had a warm bias of 1-5+ centigrade. So if data sets match, they are simply reflecting the same issue.
What is the UHI adjustment?
Where I live, relative humidity decides the diurnal temperature range, low and high. Proof that water is in control as the only relevant greenhouse gas. I see higher humidity in ocean generated air masses, due to warm SSTs in key geographical areas. Can you link CO2 to SSTs and rule out all other components?
“Bindidon October 29, 2019 at 11:22 am
Why should I reply to a polemist lacking even smallest knowledge concerning what he writes about? Many of the comments you publish here are somewhat ‘below the belt’.”
_________________________
Astounding, settled science & preparing death rows:
https://www.google.com/search?client=ms-android-huawei&sxsrf=ACYBGNTUpOeHxCa8FP_CQ0VedGF6u6xo6Q%3A1572909795446&ei=47LAXefpGsWlmwWTkZvYCw&q=university+graz+professor+death+penalty+climate+deniers&oq=university+graz+professor+death+penalty+climate+deniers&gs_l=mobile-gws-wiz-serp.
Bindidon October 29, 2019 at 9:28 am
[]
“typical reaction of a ‘skeptic’” –
reminds on a howlin wolf: not the baddest.
https://www.google.com/search?q=howlin+wolf+song+list&oq=Howling+Wolf+song+list+&aqs=chrome.
I owned a ranch in east Texas with grapes from 2008 until 2016. Grapes mature based upon temperature and sunlight. When I bought the place, my grapes matured at the end of May. Each year the grapes came later and later until by 2016 they matured in August. I think my grapes were saying it was getting cooler.
I have a question about the daily record high occurrences. ( ?resize=438%2C240&ssl=1 )
I’ve noticed for my little spot on the globe, when going to the NWS the year listed for a record high is now the latest year it occurred. That is, ties are no longer listed as they once were.
(Side note: I think the first occurrence should be the year listed. That’s when it was “set”.)
The question: Does the daily record high occurrences include all the ties? Or is it the year “set” or the latest year it occurred?
(Or maybe this a question for Dr. Christy?)
To clarify.
Back in 2007 and Al’s “Inconvenient Fluff” stuff, to satisfy my own curiosity, I copied my little spot on the globe’s record temps into Excel. (Ties were not included in that list.)
Most of the record highs were before 1950 and most of the record lows were after 1950. (That confirmed for me personally what I suspected about “Honest Al” and what he produced.)
(This was before I found WUWT.)
I copied later lists and found ties were now included in them.
I’m just wondering if “occurences” includes ties. If so, how they are handled.
We’re in the first year of the Zharkova Solar Minimum, called by her to be from 2019 to 2055.
https://www.nature.com/articles/s41598-019-45584-3
Time will be telling.
The real fraud is not about the validity of failed predictions but the deliberate re-engineering of the past. In any discussion one would assume that the past is verifiable but the Australian Bureau of Meteorology has rewritten the past regularly. If one takes into account UHI and weather station siting issues the adjustments go the opposite way from what is logical, past records probably slightly overstate temperatures. Furthermore when one realises that most of the world has no temperature data available due to remoteness of large continents and the percentage of the world which is ocean ,then methods to guesstimate temperatures by reference to homogenisation of weather stations often hundreds of miles away is fraught with corrupt practices leading to logical error bars so large as to make much data useless.
President Trump famously called global warming a Chinese hoax. It is however a global hoax and until people are held to account it will continue.
If Australia could take a lead and audit its Bureau of Meteorology , charge it’s leaders with fraud hold a very public trial and highlight to the world the deliberate nature of the deception then I think a cascade of other similar examples of manipulation will emerge globally.
This post shows Allan throwing everything he’s got against the wall to see if anything sticks.
More like he’s wiping the wall “like with a clothe” to remove the Green Gunk that still remains.
For “Karl”:
IN THE 20TH CENTURY, THE FOLLOWERS OF MARX IN THE SOVIET UNION AND CHINA KILLED ABOUT 130 MILLION OF THEIR OWN PEOPLE.
Do we really have to do this all again? Why can’t you extremists learn from your past horrific mistakes?
Oh! You say “It will all be different this time?” No, it won’t!
______________________________
https://wattsupwiththat.com/2018/12/20/economists-love-carbon-taxes-lots-of-regular-folks-dont/#comment-2563040
[excerpt]
This video by Stefan Molyneux describes Karl Marx as an incompetent, dishonest, cheating, thieving, repulsive, hypocritical and parasitic POS.
In summary, Stefan describes “Das Kapital” by Marx as “a diet book with Jabba the Hutt on the cover”. He was being kind to Marx – the man was a despicable rat.
https://youtu.be/yA2lCBJu2Gg
It is ironic that Marx’s tomb is (to some) a shrine in London, where he died in exile. The tomb was relocated and a bust erected of Marx in 1956 by the Communist Party of Great Britain.
IN THE 20TH CENTURY, THE FOLLOWERS OF MARX IN THE SOVIET UNION AND CHINA KILLED ABOUT 130 MILLION OF THEIR OWN PEOPLE.
According to wiki, Karl Marx’s “Das Kapital” is the most-cited book in the social sciences published before 1950, followed by “An Inquiry into the Nature and Causes of the Wealth of Nations”, by Adam Smith.
“Das Kapital” has been described as “a diet book with Jabba the Hutt on the cover”. Marx the man was despicable – incompetent, dishonest, cheating, thieving, repulsive, hypocritical and parasitic. In the 20th century, the followers of Marx in the Soviet Union and China killed about 130 million of their own people. Quelle surprise!
https://youtu.be/yA2lCBJu2Gg
Does anyone else find it distressing that “Das Kapital” is cited more often than “The Wealth of Nations”? Does this reflect our current crop of academics, who apparently think it is acceptable to espouse the teachings of Marx, a man who was a monster in his private life and created mega-killers though his teachings? Can’t anyone learn from history? Do we have to do this all over again? Life is precious – it is the greatest possible gift – but it is all too often destroyed by scoundrels and their imbecilic acolytes.
Karl Marx’s tomb is a leftist shrine, located in London where he died in exile. The tomb was relocated and a bust erected of Marx in 1956 by the Communist Party of Great Britain.
https://en.wikipedia.org/wiki/Tomb_of_Karl_Marx
Adam Smith was an infinitely better man than Karl Marx. Smith’s book “The Wealth of Nations” is one of the greatest and most positively influential treatises of all time.
https://www.adamsmith.org/news/news/bbc-adam-smith-the-great-economist
Adam Smith was born and raised by his widowed mother in Kirkcaldy. Smith studied at Glasgow and Oxford universities. From 1748 he became one of the circle in Edinburgh that included David Hume. In 1751 he became Professor of Logic at Glasgow University, then Professor of Moral Philosophy in 1752. In 1759 he published his ‘Theory of the Moral Sentiments’. In 1776 his ‘Inquiry into the Nature and Causes of The Wealth of Nations’ was published. He died in Edinburgh and was buried in the Canongate Churchyard.
My friend Bob Lamond, who was born in Kirkcaldy, proudly flies the Scottish flag over his home in Calgary. In 2006 Adam Smith’s badly-neglected grave was restored with £10,000 donated by Bob.
https://adamsmithslostlegacy.blogspot.com/2006/06/adam-smiths-grave-made-respectable.html
I recall Bob telling me there was a bust in London of Karl Marx, but no statue to Adam Smith, and the Adam Smith Institute was going to rectify that deplorable situation. On the 4th of July, 2008, a statue of Adam Smith was erected on the Royal Mile in Edinburgh by the Adam Smith Institute. Finally! 🙂
https://www.adamsmith.org/the-adam-smith-statue/
Regards to all, Allan
Mr. Macrae, you are confused. There is a difference between “climate science” and “political science.”
Worse, he thinks his confused opinions are a substitute for evidence. It’s like Tim Ball except in CAPS. Is there something in the water up there?
Karl, Loydo and Griff – separated at birth?
Or all the same lying cowardly troll, taking false anonymous potshots from the weeds?
Dr. Tim Ball is more of a man than you will every be.
Allan, comprendre with Karl Marxism.
Now – compare to Beethoven slander:
https://www.google.com/search?q=nasty+Beethoven&oq=nasty+Beethoven+&aqs=chrome.
The cooling has been going on for 8000 years!

So you understand why the alarmists are in such a hurry now? It’s getting colder and soon it will be so cold that the global warming theory will have joined a pile of other false theories that scared the hell out of a significant number of people but evaporated. I am quite sure though that nobody will hold the Alarmist feet to fire on it as they will turn around and talk about the impending global ice age and sell their wonder cure for it. The racket never ends.
It’s political science. The pause began and they shifted away from “Warming” to “Change”.
But the goal has always been and remains for the Public to willingly surrender Freedoms and give Government (A Global Government?) authority over all of us.
To be clear, I’ve always said that I would rather be WRONG about my “imminent global cooling” prediction, and if I am correct, I’d rather the cooling is mild, not more severe.
If atmospheric CO2 continues to increase and mild warming continues, that would be ideal. CO2 is far too low, and humanity and the environment suffer during cold periods.
Our three clear predictions were published in 2002 – the first two are correct-to-date:
“Climate science does not support the theory of catastrophic human-made global warming – the alleged warming crisis does not exist.”
“The ultimate agenda of pro-Kyoto advocates is to eliminate fossil fuels, but this would result in a catastrophic shortfall in global energy supply – the wasteful, inefficient energy solutions proposed by Kyoto advocates simply cannot replace fossil fuels.”
In contrast, all the CAGW alarmists’ very-scary climate predictions have failed to materialize. The global warming alarmists have a perfectly negative predictive track record, and nobody should believe them.
My purpose for making these predictions is to enable society to avoid serious policy errors and to mitigate the consequences of potential disasters. I predicted in 2013 (possibly earlier) the probability of increased Excess Winter Deaths (EWD’s) in the UK, and these increased EWD’s, unfortunately , are now a historical fact.
We are already seeing the consequences of destructive climate-and-energy policies, especially in the UK, Continental Europe, and the developing world.
Society is utterly unprepared for possible mild-or-severe global cooling. Energy systems have been compromised due to high costs and intermittency, all based on a catastrophic human-made global warming hypothesis that never had any scientific credibility.
Your “imminent global cooling” in 2002 (17 years ago) was wrong. It is now 2019 and there is no sign of cooling.
Another falsehood by “Karl”. What’s your other name? Loydo, Griff?
I published the following prediction in 2002, as quoted above in my article:
“If solar activity is the main driver of surface temperature rather than CO2, we should begin the next cooling period by 2020 to 2030.”
There is no such thing as: ” theory of catastrophic human-made global warming,”
.
.
Do you know the difference between a hypothesis and a theory?
What a super analysis.
The YTD N America temp anomaly map (from Weather Bell) caught my attention. The LAT’s keeps claiming – pushing ACC/AGW as the cause of the fires – that CA has had a record hot year. I don’t think this is true.
Can anyone here find me a YTD anomaly map for CA (w/ link). Appreciate it.
https://www.google.com/search?client=ms-android-huawei&sxsrf=ACYBGNQwEu-_wBtI4uhik-icEm9YyzhI6g%3A1572910947374&ei=Y7fAXau3FvCPmwXmsqHYDg&q=YTD+North+America+California+temp+anomaly+map+%28from+Weather+Bell%29&oq=YTD+North+America+California+temp+anomaly+map+%28from+Weather+Bell%29&gs_l=mobile-gws-wiz-serp.
The conditions that I document in my new book are in the process of occurring right now during the present Grand Solar Minimum, so we will see if my conclusion is correct in the next several decades. In all three of the Solar Grand Minimums that have occurred since 1600 the climate turned severely cold. The present GSM very much resembles the Dalton GSM. In 1999, I predicted that global cooling was coming and we have had gradual cooing for the past 20 years. Now that we are in the GSM, I predict that global cooling will become more severe in the next several decades.
Don, we aren’t in a GSM (yet). The Dalton and Centennial were a notch above the Maunder, the last true GSM.
Interesting post. In yesterdays Great Falls MT Tribune ” More than 31 inches of snow already has been recorded in Great Falls in September and October, shattering a 35-year-old record, according to the National Weather Service in Great Falls. The previous record was 1984’s 18.1 inches. As for the October average temperature, it’s been 40.3 degrees, which is 5.9 degrees below normal. ”
https://www.greatfallstribune.com/story/news/2019/10/27/snow-below-zero-temps-forecast-great-falls-montana/2479020001/
Say hello to the new solar minimum..
2019 may end up with the most spotless day (sun spots) since 1913. Current stretch is 26 spotless days and 225 for the year which is 75%. Last year’s total was 221 days for 61%. There were 268 spotless days in 2008.
Looks like a deep solar minimum is at hand. The questions are: how long will it last and what effect, if any, will it have on global temperature?