NASA image/ screen grab
![]()
Jason Hopkins Immigration and politics reporter
October 22, 2019 12:18 PM ET
The hole in the ozone layer shrank to its smallest size since scientists began recording it, NASA and the National Oceanic and Atmospheric Administration said Monday.
The ozone layer hole, which roughly sits above Antarctica, experienced massive retraction in September and October due to “abnormal” weather patters in the upper atmosphere, resulting in its smallest size since scientists began observing it in 1982, NASA and NOAA scientists announced.
NASA and NOAA satellite measurements observed the ozone hole reached a peak size of 6.3 million square miles on Sept. 8, but then dwindled to less than 3.9 million square miles for the rest of September and October. However, scientists tracking the ozone hole cautioned the changes are mostly a reflection of atypical weather patterns and not because of a dramatic recovery.
“It’s great news for ozone in the Southern Hemisphere,” Paul Newman, chief scientist for Earth Sciences at the Goddard Space Flight Center in Greenbelt, Maryland, said in a statement Monday. “But it’s important to recognize that what we’re seeing this year is due to warmer stratospheric temperatures. It’s not a sign that atmospheric ozone is suddenly on a fast track to recovery.”
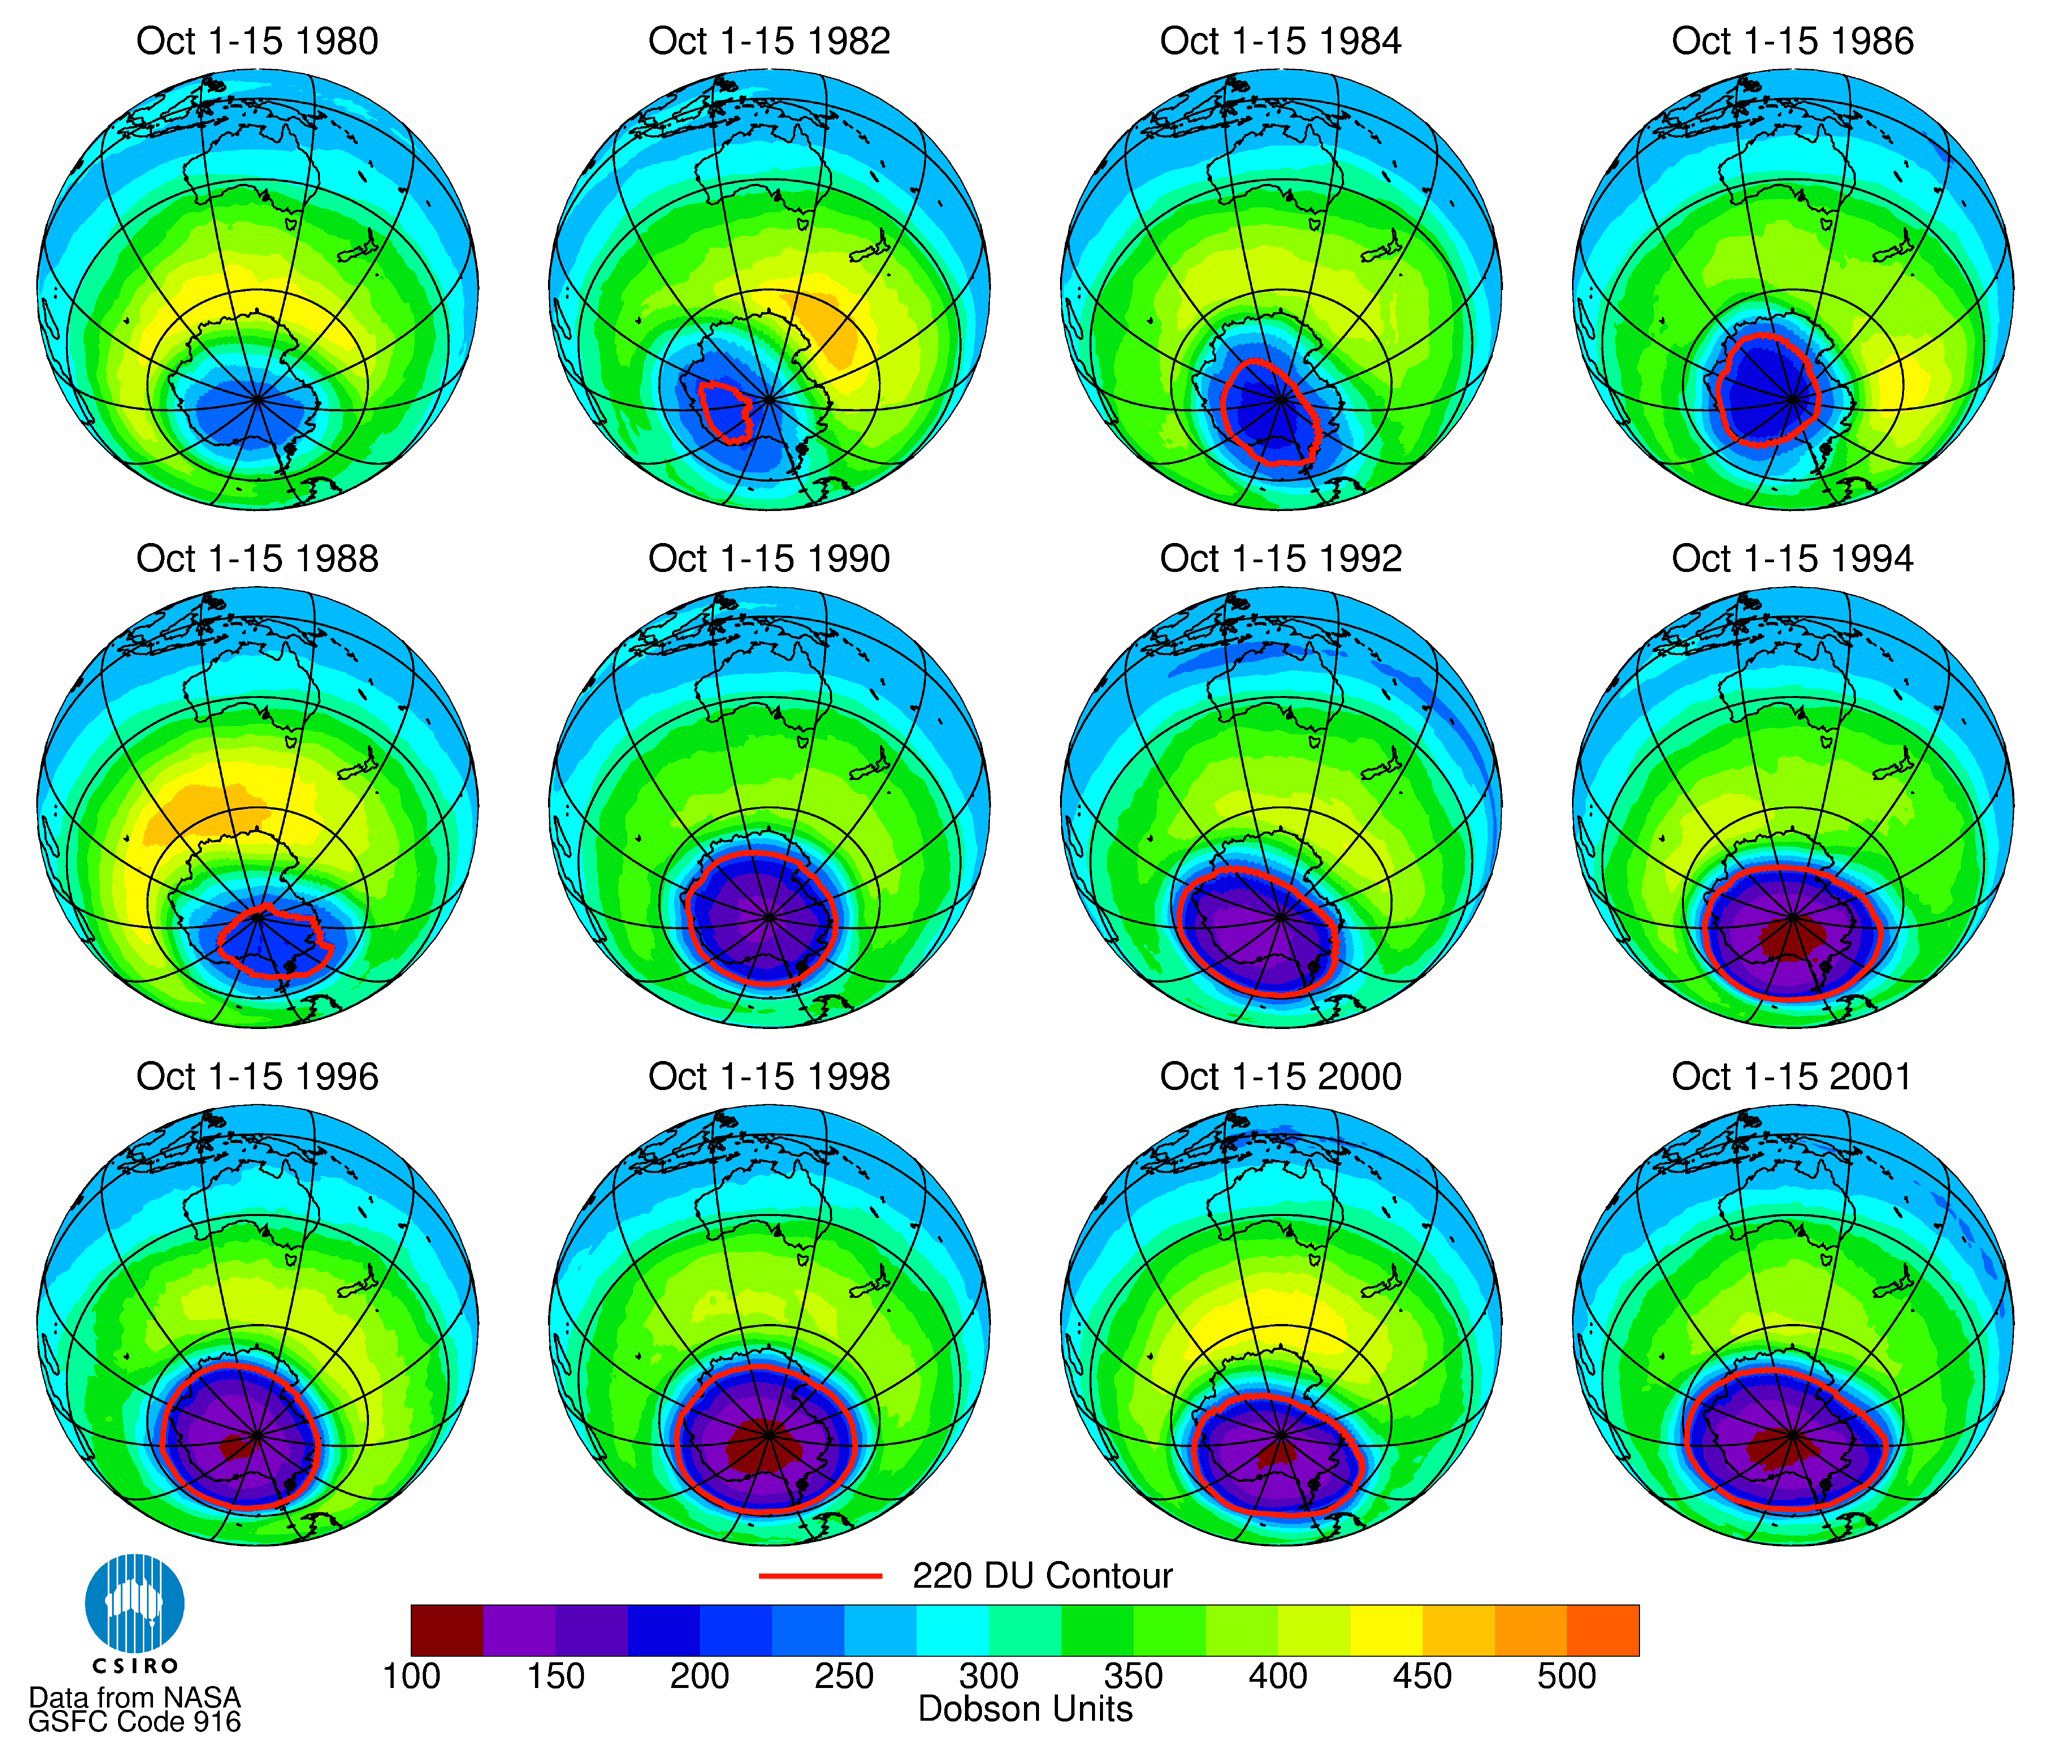
The hole in the ozone layer above Antarctica is seen in a series of satellite images over a 21-year time span. (Photo: Reuters)
Like a sunscreen for Earth, the ozone layer makes up a section of the planet’s atmosphere and absorbs nearly all of the sun’s ultraviolet radiation, leaving just enough for life to thrive. The ozone layer itself is a thin section of the stratosphere, where the ratio of ozone gas molecules to molecules of air is about 3 to 10 million, according to National Geographic. Nonetheless, this thin layer protects humans from skin cancer, cataracts and other illnesses.
The hole in the ozone layer fluctuates throughout the year. The hole usually expands to a maximum size of around 8 million square miles by late September to early October. More specifically, the hole forms when sun rays interact with the ozone molecules and man-made compounds during the late winter in the Southern Hemisphere. (RELATED: LIEBERMAN: Trump May Adopt An Obama-Era Climate Policy)
However, such patterns can be mitigated under usually high temperatures.
“In warmer temperatures fewer polar stratospheric clouds form and they don’t persist as long, limiting the ozone-depletion process,” a joint NASA-NOAA post said.
“It’s a rare event that we’re still trying to understand,” Susan Strahan, an atmospheric scientist with Universities Space Research Association, said in a Monday statement. “If the warming hadn’t happened, we’d likely be looking at a much more typical ozone hole.” Strahan noted that such usual weather patters have produced small ozone layers in the past, as it did in 1988 and 2002.
The record-small ozone hole was a result of warm weather; however, NASA scientists noted the hole is, in fact, slowly shrinking in size — a result of the 1987 Montreal Protocol, which phased out chlorofluorocarbons across the world.
How do we know the hole is not a regular occurrence that may have always just been there?
They’re working on finding proxies that will give an indication of how much UV is making it to the planet’s surface. link One theory is that volcanoes caused a huge hole in the ozone layer that resulted in the Permian extinction.
Oh great…
More Proxy Dust
now that there is funny!
Actually, I built a model back in the 90s, based on TOMS data. It didn’t show anything to get excited about. CIESIN formerly had a more sophisticated model on the internet, which also used meteorological cloud data. I ran historical analyses of several major US cities and, again, they did not show anything to be concerned about. Several years ago, the CIESIN model disappeared from the internet.
The history of the Ozone Hole is a most curious topic.
I remember as a child reading about the discovery of the Ozone Hole by an expedition during the fabulous International Geophysical Year 1959.
Then I was puzzled when a European research team was credited for the discovery made during a research project nearly 20 years later, about ~1976.
Now I see that the Ozone Hole was discovered by Molina and Farman in 1985.
So as near as I could tell:
1959-1975: Discovered in 1959, a natural phenomena.
In 1976 and beyond, the Ozone Hole was discovered in 1976, and is All Your Fault.
1985: I have no idea.
The Basics:
Ozone is formed by the reaction of oxygen with hard UV from the sun. During the long Antarctic winter night, with months without sunlight, the ozone naturally decays. Obviously, the level drops so you get a “hole”. In the spring, the sun comes up and ozone production resumes.
The sudden ozone reduction when the sunlight returns in late September is clearly driven by chemistry of chlorine on very cold ice crystals interacting with light to catalyze ozone destruction. How much is natural and how much was man-made due to CFC’s is the Trillion dollar question.
Replacing A/C units that wear out anyways is a far cry from replacing a concentrated liquid fuel source that powers almost every bit of human society and food production. Genocidal famines, gobal depopulation, and an energy poverty-induced return to Feudal Times seems to be the real goal there against fossil fuels for the masses. Gotta save those fossil fuels for the private jets and yachts to get to those Swiss Ski Chalets and Aegean Islands.
Natural sources include space dust carrying halides: Solar Cycle Variations in Ice Acidity at the End of the Last Ice Age: Possible Marker of a Climatically Significant Interstellar Dust Incursion.
So there is a difference in the Chemistry of halides and elementary halogen /halogen radicals.
CFCs are source of halogen / halogen radicals. Interstellar Dust dilivers halides: these are not part of the oznoe depletion.
The space dust may contain a number of binary halide species, some of which may disassociate in the stratosphere into their respective halogen ion- and their elemental or radical ion+ counterpart.
Subsequently, the halogen ions wreak havoc with the stratospheric ozone, similar to the damage done by halide aerosols transported to the stratosphere from the oceans.
The paper Atmospheric aerosol models for systems including the ions H+, NH4+, Na+, SO42−, NO3−, Cl−, Br−, and H2O catalogs the aerosols of terrestrial origin, though, space dust is also a source.
Eventually, much of the space dust falls to earth where some of it finds its way into the ice domes. See previous paper.
@ur momisugly migueldelrio:
Quote:”[…] disassociate in the stratosphere into their respective halogen ion- and their elemental or radical ion+ counterpart.”
Miguel: could you please explain
– _dissiziation_ of Hal-/Me+ in the (solid) “dust phase”?!?
– The mechanism for : disassociate […] respective halogen ion- and their elemental or radical ion+ counterpart.”
-waht a “_radical_ _ion+_ counteroart is?
And last but not least : who jumped in for you and took the Chem 101 exam?
There is infinite supply of chlorine at the surface of 3/4th of the earth. You can smell it. wht ever the contributions of CFl compounds were. They were trivial.
@MFKBoulder
A binary halide molecule dissociates into a halogen ion and an element or radical ion on the surface of a polar stratospheric cloud. See http://juser.fz-juelich.de/record/29698/files/Mueller2003_prl.pdf (The conclusion of this paper, Impact of Cosmic Rays on Stratospheric Chlorine Chemistry and Ozone Depletion, is that there is no cosmic ray impact, however, the description of the chlorine chemistry is of interest.)
A CFC molecule may have a residence time of a few years before degradation in the stratosphere releases chlorine which destroys ozone: https://ueaeprints.uea.ac.uk/51577/1/acpd_14_31813_2014_print.pdf
While the CFC molecule remains intact, it is chemically inert.
It was the accumulation of CFCs and the subsequent releases of chlorine in the stratosphere that was the genesis of the Montreal Protocal.
The troposphere transports CFCs and halide aerosols to the stratosphere. Once in the stratosphere, these halogen containing substances may reside a few years. In the case of CFCs, they eventually degrade to release the halogen ions which destroy ozone.
As the polar stratospheric clouds dissipate, the air can circulate the halide aerosols, both the naturally occurring and from the degraded CFCs, back to the troposphere where they nucleate as precipitation.
Some of these halides are of interstellar origin: https://www.eurochlor.org/wp-content/uploads/2019/04/sd6-organohalogens-final.pdf
Walter Sobchak October 23, 2019 at 11:03 am
There is infinite supply of chlorine at the surface of 3/4th of the earth. You can smell it. wht ever the contributions of CFl compounds were. They were trivial.
The problem with that is that the destruction of the ozone occurs above 15km altitude not at sea level. The chlorine compounds released from the ocean are typically inorganic and water soluble and are washed from the atmosphere and don’t reach the tropopause. The CFCs on the other hand are not water soluble and are inert in the troposphere, it is only when they reach the stratosphere and are photolysed by UV releasing very reactive Cl radicals.
There were a lot of A/C’s that weren’t worn out that had to be replaced because freon either couldn’t be had, or was too expensive.
Joel O”B
Bromine is very important in the chain of chemistry.
Most of it is from the ocean.
Samuel C Cogar, you wrote :
“MFKBoulder, ….. and Phil., …… watch this YouTube video of the seasonal sunshine on Antarctica.”
Thanks for the visualization of what I said before Halley and Troll have the ‘spring sun rise’ begin of August.
Every solar calculator will bring the same results but you brought a nice visualization.
Excerpted from published article:
“YUP”, …… by late September to early October, ….. which is after the Autumnal equinox of September 21st …….. and the “start” of springtime in the Southern Hemisphere with the Sunshine beginning to return to the Antarctica atmosphere after 6 months of darkness.
And “NOPE”, …… the hole forms when there are no sun rays(sic) to interact with the oxygen molecules.
TonyL got it right, …… so pay attention to what he tells you, to wit:
To Samuel C Coger and TonyL
Begin of Quote
And “NOPE”, …… the hole forms when there are no sun rays(sic) to interact with the oxygen molecules.
TonyL got it right, …… so pay attention to what he tells you, to wit:
TonyL – October 22, 2019 at 7:26 pm — “ Ozone is formed by the reaction of oxygen with hard UV from the sun. During the long Antarctic winter night, with months without sunlight, the ozone naturally decays. Obviously, the level drops so you get a “hole”. In the spring, the sun comes up and ozone production resumes.”
End of Quote
Hi Samuel,
Nicely laid out theory from you and TonyL. So let’s have the Feynam-check:
Richard P. Feynman: “It doesn’t matter how beautiful your theory is, it doesn’t matter how smart you are. If it doesn’t agree with experiment, it’s wrong.”
And now let us look at the data:
Norwegian Troll Station in Antarctica. After the Antarctic Winter sun comes up there in August (72°S).
Minimum values of the total ozone column there were in October since 2016 (this year probably as well) or even later (like 2018). This is far in Antarctic spring. The depletion is mailny in spring
Details here at page 22
https://www.miljodirektoratet.no/globalassets/publikasjoner/m1462/m1462.pdf
The leads to: Samuel’s and Tony’s theory is wrong.
@ur momisugly MFKBoulder – October 23, 2019 at 1:32 pm
MFKBoulder, …. me thinks you have a “science literacy” problem and possibly a “reading comprehension” problem.
First of all, where it states “Winter sun comes up there in August” …. simply implies its the 1st time in the past several months that the Sun can be seen above the eastern horizon. And at that “angle of incidence” it has very little “warmth” for heating up the atmosphere.
And secondly, ….. October is NOT …. “This is far in Antarctic spring”. Maybe November and/or December is far into the Antarctic spring, ….. but not October.
And thirdly, ….. “NO”, ….. “The depletion is NOT mailny in spring”, ….. the ozone depletion is mainly during the cold, dark winter months of zero sunshine, ….. April thru August.
MFK Boulder
Tony’s theory is wrong
Ozone, once formed by hard UV action on O2, has a finite lifetime.
After that lifetime is decays and is removed.
So the minimum concentration of ozone – the biggest ozone hole – is not at the time of minimum production of ozone, i.e. the SH winter solstice of June 21.
It is the winter solstice plus the lifetime of ozone, i.e. ~October.
TonyL is right.
And thirdly, ….. “NO”, ….. “The depletion is NOT mailny in spring”, ….. the ozone depletion is mainly during the cold, dark winter months of zero sunshine, ….. April thru August.
Not true, typically there is no reduction until August, the main cause of ozone decay in the absence of CFCs is dissociation due to UV light, in the absence of UV the ozone does not decay significantly during the winter. It is the return of sunlight to the altitudes between 15 and 22 km that causes the reactions to occur which deplete the ozone. Ozone doesn’t normally start to recover until December.
to Phil Salmon
As you can see from the OTOC graphs of Neumayer and Troll Statiion your assumption is probably not true.
If it were as you stated, the curve had to drop like a “decay curve” from July latest begining of August.
But the considerable decay sets in as soon as the UV hits the atmosphere after Spring sunrise. At this time (even according to Sameul C Cogar) the Ozone build up should start, but we see decay.
This does not fit to your theory, Thus according to Feynstein: drop it.
“But the considerable decay sets in as soon as the UV hits the atmosphere ”
MFKBoulder, …… iffen the UV destroys the ozone (O3), …… then tell us what creates the ozone (O3) in the first place.
Samuel C Cogar October 24, 2019 at 4:09 pm
“But the considerable decay sets in as soon as the UV hits the atmosphere ”
MFKBoulder, …… iffen the UV destroys the ozone (O3), …… then tell us what creates the ozone (O3) in the first place.
Photons of wavelengths less than 240 nm can photolyze the O2 molecule. Such high-energy photons are present in the solar spectrum at high altitude.
Photolysis of O2 yields two O atoms:
O2 + hν ➝ 2O
where the O atoms are in the ground-level triplet state O(3P) and are highly reactive due to their two unpaired electrons. They combine rapidly with O2 to form ozone:
O + O2 + M ➝ O3 + M
The O3 molecules produced in reaction (R2) go on to photolyze. Because the bonds in the O3 molecule are weaker than those in the O2 molecule, photolysis is therefore achieved with lower-energy photons:
O3 + hν ➝ O2 + O(1D) 𝜆 less than 320nm
O(1D) + M ➝ O + M
O3 + O ➝ 2O2
So O3 is created by wavelengths more energetic than 240nm and destroyed by wavelengths less than 320nm. The lifetime of the O3 is controlled by the slow rate of the last reaction, in the absence of UV light there is no mechanism for further destruction of the O3.
Other species (eg NOx) are involved in destroying the O3 but these are suppressed by their condensation on the PSC which exist in the low temperatures of the S Polar stratosphere. In the absence of UV chlorine is present in the form of Cl2 which is not reactive however once UV returns the extremely reactive Cl radicals are formed and the rapid depletion of O3 begins.
Phil. – October 24, 2019 at 7:09 pm
Phil, … Phil, …. Phil, …….. Phil, ……. to wit:
Does not the “380 nm” to about “10 nm” wavelengths of UV correspond to your above stated “less than 240 nm”?
And does not said UV radiation only exist in earth’s atmosphere where Sunlight is passing through said atmosphere?
And if Sunlight is blocked from passing through the atmosphere then UV radiation is also blocked from passing through the atmosphere?
Samuel C Cogar October 25, 2019 at 4:36 am
Does not the “380 nm” to about “10 nm” wavelengths of UV correspond to your above stated “less than 240 nm”?
No! Sam your lack of understanding of elementary physical chemistry is disturbing.
And if Sunlight is blocked from passing through the atmosphere then UV radiation is also blocked from passing through the atmosphere?
Which is why O3 does not decay during the winter over the S Pole.
https://ozonewatch.gsfc.nasa.gov/meteorology/figures/ozone/to3mins_2019_toms+omi+omps.pdf
Phil. October 25, 2019 at 8:17 am
“Which is why O3 does not decay during the winter over the S Pole.”
Phil, that was sure an odd comment after citing this pretty NASA ozone graph of the Southern Hemisphere
Phil, get yourself a cold beer, take a couple swallows and then take another look-see at that graph.
Please note that the plotted O3 ppm starts decreasing in mid-July, ….. which was the start of winter in the SH, …… and bottoms out bout October 2nd just a week after the Autumnal equinox on September 21st. ….. which was the start of Springtime in the SH.
Sorry Phil, but me thinks you were looking at a SH graph …….. but thinking NH seasons.
But you don’t have to believe me, ……. just ask someone from Australia if their winter is just beginning or ending here on 10-25-19.
To Samuel C Cogar,
Winter in the southern hemisphere starts with winter solstice in June not July. Winter night at South Pole starts even with equinox in March.
And the botton of the graph you were referring to is rather in mid October than on October 2nd.
MFKB, you are doing a wee better now, …….. but your understanding of all the aspects of earth’s axial rotation is still quite limited, … to wit:
“Winter night at South Pole starts even with equinox in March.”
Iffen you want to learn more about how the seasonal changes in the SH affects atmospheric CO2 then a study of the Keeling Curve Graph would be of great benefit, to wit:
to Sameul C Cogar: who said:
“Iffen you want to learn more about how the seasonal changes in the SH affects atmospheric CO2 then a study of the Keeling Curve Graph would be of great benefit…”
– Discussion here is on Ozone (O3) not Carbon dioxide (CO2; Keeling Curve)
– Keeling curve is measured in the northern Hemisphere
And you say: “…but your understanding of all the aspects of earth’s axial rotation is still quite limited , … to wit:
[Quote from MFKBoulder] “Winter night at South Pole starts even with equinox in March.””
What indicates a limited unterstanding on the side of MFKBoulder?.
Looks more like deficits at SC Cogar’s side who trys to divert the discussion to the NH CO2 data ot the Keeling curve, instaed of discussing Antarctic Data (etiher satellite or British, Norway or US Ground based measurements).
@ur momisugly Johann Hemmer
Oh my my, Johann, ….. you “caught” my unintentional “copy & paste” error and I thank you for doing said. But anyway, I will try to do better in the future. But in the meantime, Johann, please explain the “un-strike through” portion of the following to MFKB, as defined by the included “Polar night”, …..to wit:
“DUH”, the South Pole’s winter night starts on May 11th, ….. not on the Vernal equinox (March 21st).
Johann Hemmer
But Johann, the discussion is centered on the Southern Hemisphere and it is the temperature of the SH ocean waters that determines the atmospheric CO2 ppm quantity, aka: Keeling Curve Graph.
And it matters not where one measures CO2 as long as water (H2O) vapor is absent, ….. so Johann, best you study up on Dalton’s Law (Law of Partial Pressures)
Cheers, Sam C
Phil
You said, “Not true, typically there is no reduction until August, …” By mid-August, the ozone level is down to about one-half of what it had been at the peak in the June-July timeframe.
MFKBoulder
You said, “Winter in the southern hemisphere starts with winter solstice in June not July.” That is late-June to be more precise! Also, there is variation in the peaks and troughs of the ozone and one should expect some time delay from the astronomical events.
Hi Clyde
My comments to your and Sam‘s postings are regularly blocked.
Do not know why
BR
MFKBoulder
Clyde Spencer October 27, 2019 at 11:33 am
Phil
You said, “Not true, typically there is no reduction until August, …” By mid-August, the ozone level is down to about one-half of what it had been at the peak in the June-July timeframe.
Which was in response to the following:
And thirdly, ….. “NO”, ….. “The depletion is NOT mailny in spring”, ….. the ozone depletion is mainly during the cold, dark winter months of zero sunshine, ….. April thru August.
Since the depletion doesn’t start until August this claim is refuted.
The mean value reaches a maximum in July of about 240DU and then starts to drop rapidly in August. Note that I didn’t say ‘until mid-August.
MFKBoulder
You said, “The depletion is mailny in spring.” I’m not contesting that there is strong depletion in Antarctica in Spring. However, the graphs show that the depletion STARTS with the peak in the the June-July time frame, that ozone has declined by half by mid-August, well before the sun shows up on the horizon in September. That is, 2-4 weeks after minimum sunlight the ozone has declined by about half. On the other hand, 2-4 weeks before the peak (same light intensity) the ozone is still increasing. It seems to me that the key here is when the circumpolar vortex sets in, which I haven’t found much info on.
Your Norway article is interesting and I have saved it for more thorough digestion later. However, a couple of things from it strike me. First, Figure 11 suggests that changes in the ozone levels tend to lag the UVI by about a month, and there are times when the correlation between them is negative. [Incidentally, 1 month is about the time it takes for the Antarctic Ozone Hole to ‘heal’ after the vortex breaks up.] The article states, “The seasonal variation in observed UV dose rate is closely related to the solar elevation. Consequently, the highest UV levels normally occur during the summer months when the solar elevation is highest.” This speaks to my initially questioning the importance of the Antarctic Ozone Hole and what the measured surface UV fluxes are. The Norwegian article suggests that clouds are a secondary influence, and ozone ranks third in the impact on surface UV.
In summary, the behavior of the Antarctic ozone depletion, which is somewhat different from the ozone in the Arctic, is of academic interest. However, I think that the impact on living things, and consequences for the few organisms present in Antarctic in the Spring, is exaggerated. It appears that the UV Index for the tropics is regularly higher than the worst case in Antarctica.
Clyde you said:
„I’m not contesting that there is strong depletion in Antarctica in Spring. However, the graphs show that the depletion STARTS with the peak in the the June-July time frame, that ozone has declined by half by mid-August, well before the sun shows up on the horizon in September.”
We are talking about the graph in of the Norwegian station here in the paper
Details here at page 22 Fig.11
https://www.miljodirektoratet.no/globalassets/publikasjoner/m1462/m1462.pdf
At this station sunrise has already happened on 1st of August. With the increase of intensity of solar radiation (see UV-index in the lower part of the Figure) the “Molina/Rowland” process starts and ozone us depleted. This continues until end of November. UV-Index rises due to the increase of the solar elevation (and the lack of Ozone) until Ozone depletion falls back behind UV-induced Ozone generation. Not really hard to understand once you accept the Molina/Rowland process including PSCs. PSCs were the surprising part in the process.
You say: “That is, 2-4 weeks after minimum sunlight the ozone has declined by about half. On the other hand, 2-4 weeks before the peak (same light intensity) the ozone is still increasing.”
I do not see in the Norwegian graphs reduction of O3 during Polar night to “about half”. And Peak ozone is during Summers peak.
Could you explain or give reference to the graphs you are discussing?
MFKBoulder, ….. and Phil., …… watch this YouTube video of the seasonal sunshine on Antarctica.
“Animated Seasonal Surface Changes of Sunlight on Earth’s surface”
Clyde Spencer October 28, 2019 at 12:24 pm
I’m not contesting that there is strong depletion in Antarctica in Spring. However, the graphs show that the depletion STARTS with the peak in the the June-July time frame, that ozone has declined by half by mid-August, well before the sun shows up on the horizon in September. That is, 2-4 weeks after minimum sunlight the ozone has declined by about half. On the other hand, 2-4 weeks before the peak (same light intensity) the ozone is still increasing.
A key parameter is astronomical twilight when light starts to return to the polar region.

Astronomical dusk is about May 13 and dawn is about Aug 2nd at the S pole. As I’ve shown you before there is very little change until early August.
Take last year:
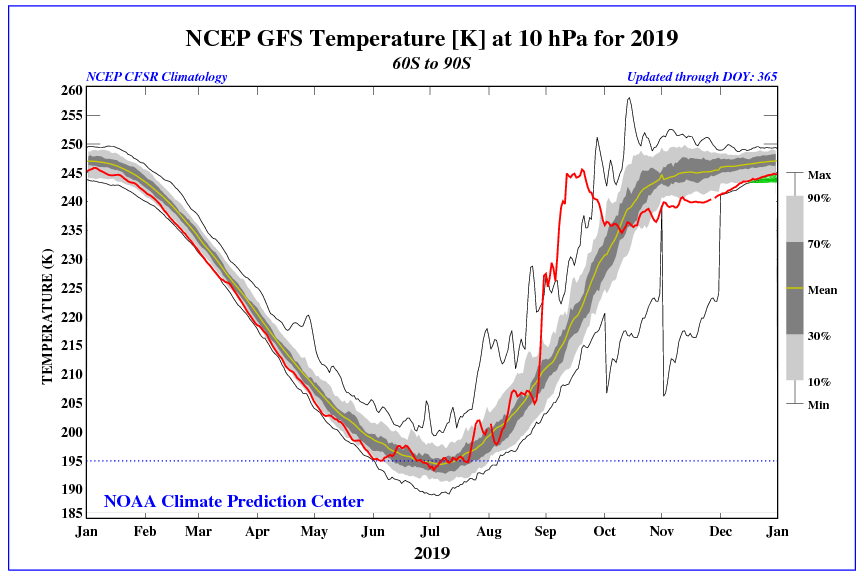
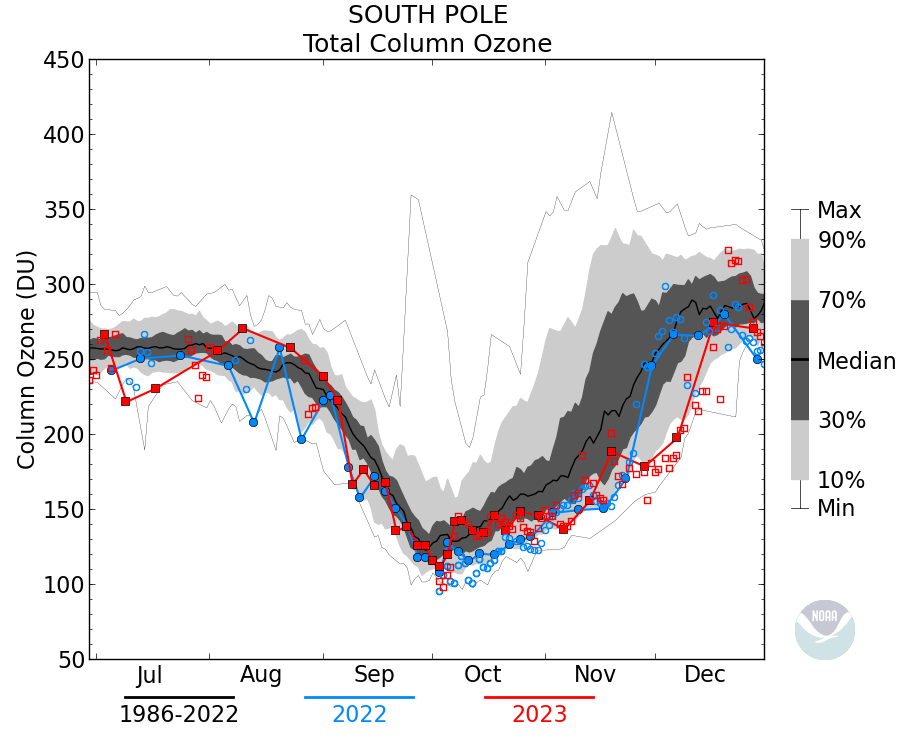
Doesn’t get below 200DU until early September which is when the temperature at altitude starts to warm up.
The median TCO at the S pole doesn’t drop significantly until late August.
So saidith did: Phil. – October 28, 2019 at 3:57 pm
Phil., why are you adamantly claiming that the “decrease” in Antarctica ozone (O3) is directly contrary to what NASA states is the cause of the “increase” in Antarctica ozone (O3), to wit:
NASA states that:
A curious mind would love to know why you are ignoring scientific facts.
To engage in an “intelligent conversation”, ….. both parties should be reasonably intelligent.
from Samuel C. Cogar:
(Quote)
Phil., why are you adamantly claiming that the “decrease” in Antarctica ozone (O3) is directly contrary to what NASA states is the cause of the “increase” in Antarctica ozone (O3), to wit:
NASA states that:
[Samuel is quoting from: https://ozonewatch.gsfc.nasa.gov/facts/SH.html ]
A curious mind would love to know why you are ignoring scientific facts.
To engage in an “intelligent conversation”, ….. both parties should be reasonably intelligent.”
(EndQuote)
Yes Samuel both parties should be “reasonably intelligent” enough not to read only stuff you like (NASA page on “What is Ozone” but as well stuff you do not like “What is the Ozone hole”.
https://ozonewatch.gsfc.nasa.gov/facts/hole_SH.html
NASA: “From an aircraft field mission over Antarctica we also know that a total column ozone level of less than 220 Dobson Units is a result of catalyzed ozone loss from chlorine and bromine compounds.”
NASA: “… When the sunlight returns to the South Pole in October, UV light rapidly breaks the bond between the two chlorine atoms, releasing free chlorine into the stratosphere, where it takes part in reactions that destroy ozone molecules while regenerating the chlorine (known as a catalytic reaction). A catalytic reaction allows a single chlorine atom to destroy thousands of ozone molecules.”
Quoting only one part from NASA ignoring the remainder leads me to the assumption that’s there is some cognitive distortion on your side Samuel.
Samuel C Cogar October 29, 2019 at 4:16 am
So saidith did: Phil. – October 28, 2019 at 3:57 pm
“A key parameter is astronomical twilight when light starts to return to the polar region.
Astronomical dusk is about May 13 and dawn is about Aug 2nd at the S pole. As I’ve shown you before there is very little change until early August.
The median TCO at the S pole, as per this cited graph, doesn’t drop significantly until late August.”
Phil., why are you adamantly claiming that the “decrease” in Antarctica ozone (O3) is directly contrary to what NASA states is the cause of the “increase” in Antarctica ozone (O3), to wit:
They don’t say that, they are referring to the formation of ozone in general, principally over the tropics. The ozone trapped over the pole during winter has no significant mechanism for loss hence the concentration remains fairly constant until later (August) when Cl released due to reactions on the PSC starts to catalytically destroy the ozone.
NASA states that:
“ Ozone is created when the kind of oxygen we breathe—O2—is split apart by sunlight into single oxygen atoms. Single oxygen atoms can re-join to make O2, or they can join with O2 molecules to make ozone (O3). ”
https://ozonewatch.gsfc.nasa.gov/facts/SH.html
A curious mind would love to know why you are ignoring scientific facts.
I’m not, that’s actually the mechanism I described to you above, bear in mind it’s mostly true in the tropospheric stratosphere and then that ozone is transported to the pole by the Brewer-Dobson circulation.
To engage in an “intelligent conversation”, ….. both parties should be reasonably intelligent.
True, unfortunately you don’t meet that requirement.
MFKBoulder October 29, 2019 at 8:00 am
MFKBoulder, please explain to us “dummies” how those “chlorine and bromine compounds” manage to travel all the way from their source in the middle of the Norther Hemisphere, ……. way down to the South Pole of the Southern Hemisphere WITHOUT creating an ‘elongated’ Ozone Hole the full length of their travels?
Maybe you are transporting them down there by boat, ….. HUH. Or maybe they just “flow” close to the surface until they get to the South Pole and then rise up like a hot air balloon?
“DUH”, …. iffen said “chlorine and bromine compounds” will destroy the ozone at the SP, they will destroy it in the stratosphere overtop of where you are.
End of discussion until you better your education.
To Samuel C Cogar:
You state:
“To engage in an “intelligent conversation”, … both parties should be reasonably intelligent.”
And:
“End of discussion …”
Thanks for the promise of EoD, since you do not meet the requirements for your first statement above. And You obviously are ignoring all facts presented here including these parts of the NASA pages which contradict your “private theory”.
It was not a pleasure.
Samuel C Cogar October 29, 2019 at 11:53 am
MFKBoulder, please explain to us “dummies” how those “chlorine and bromine compounds” manage to travel all the way from their source in the middle of the Norther Hemisphere, ……. way down to the South Pole of the Southern Hemisphere WITHOUT creating an ‘elongated’ Ozone Hole the full length of their travels?
Well they will as long as the stratospheric temperature gets low enough for long enough to form PSC.
“DUH”, …. iffen said “chlorine and bromine compounds” will destroy the ozone at the SP, they will destroy it in the stratosphere overtop of where you are.
Only if the necessary conditions are met, in the absence of PSC the depletion does not amount to a hole, over the period from 1979-1995 the O3 concentration in the N hemisphere mid-latitudes dropped by 6%.
I am wrong, ……… you are right, you are right, you are right, ……. the Ozone Hole never materialized over the South Pole until late in the 20th Century after NASA was capable of investigating its presence.
Ells bells, there was no reason or purpose for the Ozone Hole to even be there before humans were capable of studying it.
Even when NASA had the techniques to observe the Ozone Hole they didn’t discover it because they didn’t believe the results. It wasn’t until BAS told them their results that NASA went back and rechecked their data and realized what had happened.
The hole is a natural phenomenon. CFCs didn’t create it.
Also, a refrigerator today is 50% the efficiency of refrigerators from 1950s due to the Montreal Protocol.
Also, a refrigerator today is 50% the efficiency of refrigerators from 1950s due to the Montreal Protocol.
Not true, efficiency today is about four times what it was in 1972.
http://magaimg.net/img/9dmx.png
Also: https://www.engineeringtoolbox.com/refrigerants-properties-d_145.html
Someone stood to gain when CFCs were banned. Critical DuPont patents on Freon production expired in 1979. DuPont developed alternatives to Freon so they could sell those, under patent protection, when it was banned. Otherwise, other companies could sell cheaper Freon and cut into DuPont’s profits. link Coincidence? Cui bono?
Jeeze, Bob, not that tripe again. The patents had already expired.
n 1978 the United States banned the use of CFCs such as Freon in aerosol cans, the beginning of a long series of regulatory actions against their use. The critical DuPont manufacturing patent for Freon (“Process for Fluorinating Halohydrocarbons”, U.S. Patent #3258500) was set to expire in 1979.
Following the money is often very revealing.
“It ain’t so much the things that people don’t know that makes trouble in this world, as it is the things that people know that ain’t so”
Check this graph (and the text) provided in the link and please reconsider your posting:
https://ozonewatch.gsfc.nasa.gov/facts/history_SH.html
The ozone depletion which is often named “ozone hole” occurs from the 80ies of the last cerntury.
Before that it was the “southern anomaly” as Dobosn called it. The “Ozone hole” was expected to occur and scientist were looking for a depletion in the beginning of the 80ies. The Antarctic ozone depletion to half of the levels measured before in the mid of the 80ies was then called Ozone hole.
We have this now for over 30 years and the best explanation was granted with the Nobel award for chemistry.
yeah thats what they say
but
an ozone hole formed over uk a couple yrs back caused by extreme cold up high
now those cute pics above?
they END at 2001
and here the curious thing
our Bom chappies say this weird highlevel warm event has happened before and the last event was???
try 2002(another in the 8s but unsure what yr)
so whats the bet 2002s piccy would have shown a reduction as well
presonally I dont think its the chemicals its just a NORMAL event over the coldest places on the planet
ie the poles
and the cfc scam was just like the warming c02 stunt theyre pulling right now.
https://www.eldersweather.com.au/news/record-small-ozone-hole-as-stratospheric-warming-reaches-the-surface/530389
ok they reckon it happened in the 70s
well sats were pretty crap then?
no actual records mentioned
and their ref to if going to just affect qld and nsw is more than a little weird also
conveniently already droughted so who the hell would be able to claim what a bit more drounght effect came from?
also
if its giving easterlies then they bring moist sea air inland
stinks to high heaven
Actually, it was first noticed in 1956.
1955.
Why is there no picture in the last 18 years?
We do know, it is a natural occurrence.
To David 2018-1022 at 7:34 pm stating:
“We do know, it is a natural occurrence.”
Could you explain?!?
Or is ti this way:
“It ain’t so much the things that people don’t know that makes trouble in this world, as it is the things that people know that ain’t so”
Its natural because ……… solar irradiance (Sunshine) contains UV (Ultra Violet) radiation and earth’s atmosphere contains 21% Oxygen (O2) …… and Ozone (O3) is created when the UV interacts with the O2 ………. but the O3 decays quite rapidly.
Thus, the reason an Ozone Hole forms over Antarctica during the SH wintertime.
Your theory does not fit to the data.
Dear Samel C Cogoar,
You might repeat this 100 or 1000 times: yet it ain’t right.
You are spreading your (somewhat) limited understanding of the ozone hole formation.
You obviously do not look at the data (experiment).
Data from Neumayer-Station III, Antarctica. Latitude: -70.6680 Longitude: -8.2670.
(Day of year 245 is begin of October)
The spring sunrise is End of July in (winter half year). This is the time the Neumayer-ozone graph start to steepen downwards.
Dear MFKBlunderer, … since you seem to not “have a clue” where Antarctica resides on the earth, ….. please “click” the following url link and study the ‘world map’ for 2 or 3 weeks and then , hopefully, you will be able to intelligently discuss the subject in question.
Yours truly,
S C Cogar, AB Degree, Biological and Physical Science, GSC 63’.
Dear Sameul C Cogar (sorry for misspelling),
I gave you the link to the ozone graph for Neumeyer III Station which resides in Antarctica,
and before I gave you the Data from Troll Statin (Norway) in Antarctica,.
https://www.miljodirektoratet.no/globalassets/publikasjoner/m1462/m1462.pdf
p. 22
Sicne I assume google as well as googel maps is working in your place you should finde them.
Now let’s dicuss the graphs.
How do we know the hole is not a regular occurrence that may have always just been there?
Bingo!
By 61 years of measuremnts, maybe?!?
https://ozonewatch.gsfc.nasa.gov/facts/history_SH.html
Bingo, too.
Measurements which show the existence of the hole for as far back as we have measurements.
The 61 years of measurement that showed the appearance of the ozone hole about 20 years after the measurements started.
In case you see not two and a transition you might check with your optometrist.
So the world began 61 years ago?
The Ozone Hole has been over Antarctica ever since aquatic plant life in the oceans had created enough atmospheric oxygen (O2) for the UV radiation to create the atmospheric ozone (O3).
The antarctic ozone depletion AKA Ozone Hole is when the TOC (total ozone column) drops considerabele AFAIR 180 or 150 DU was the threshold.
As you can see here in the grah from Bristish Antarctic Survey
the Threshhold was firsst met in the 80ies. And since then in almost ervery year.
Or do you have an explaantion for the clearly visible pattern in this grph Samuel C Cogar?
“Or do you have an explaantion for the clearly visible pattern in this grph Samuel C Cogar?”
MFKBoulder, …… you are far, far, far better at explaining JUNK SCIENCE graphs than I am, …… so go for it, ……. explain it to us,
Voltron
About 10 years ago I asked that exact question of the Max Planck institute and Cambridge University. They said they didn’t know as measurements only began in the 1950’s. At the time they were about to launch a study to ‘back track’ but I don’t know whether anything ever became of that
tonyb
The Ozone Hole has existed for as long as there has been sufficient oxygen in earth’s atmosphere to create the ozone “layer” in the stratosphere.
Without the ozone ‘layer’ ……. there couldn’t be a ‘hole’ in it.
In 1978 the United States banned the use of CFCs such as Freon in aerosol cans, the beginning of a long series of regulatory actions against their use. The critical DuPont manufacturing patent for Freon (“Process for Fluorinating Halohydrocarbons”, U.S. Patent #3258500) was set to expire in 1979.
“YUP”, ……. and Dupont had its new refrigerant approved and ready to ship when the ban on Freon went into effect.
I remember having this thought when the date thing first showed up in the bed in the early 1980s I was 16 or so, and my first thought when I learned that “A hole has developed in the ozone layer!!!1!” was, “What? If they just started observing the ozonee later at the South Pole, how do they know this hole is new?”
Quote: “What? If they just started observing the ozonee later at the South Pole, how do they know this hole is new?”
As mentioned earlier:
By 61 years of measuremnts, maybe?!?
https://ozonewatch.gsfc.nasa.gov/facts/history_SH.html
And, the Antarctic has been where it is for how long? Let’s see….MILLIONS of years with no observations and you’re touting 61 years as PROOF that the ozone hole is something new. Get back to us when you have, at least, a few thousand years of direct observations and you may have a case.
Cheers
Max
Hmm…. looks like a sine wave of 60 to 70 years …
now , what could that be ?
😉
Less solar activity?
We don’t know. Though you cannot deny that since they banned R12 which justso coincidentally just happened to have its patent run out at exactly the same time we discovered this and somehow magically knew it was not normal, that heavier than air CFCs stopped crossing the equator, blown all the way to antarctica despite 2 or three jet stream systems in the way, then somehow despite being heavier than air made their way up far into the stratosphere
What if the ozone hole is a variable aperture, opening and closing as needed to regulate the earth’s temperature.
I was thinking the same thing.
The Ozone hole is similar to the same type of hole you make when you dip a bucket into a lake and pull it out.
There are 2 ingredients to Ozone. To destroy it, you must “destroy the sun”, which provides the ionizing radiation… Or “remove all the oxygen from our atmosphere”. If neither one of these things can be accomplished, then there is no way you can ever get rid of Ozone.
Chlorine fluorine and carbon as a molecule is far too heavy, it does not fall upward. It is a stable molecule which is why it is used in hot environments for cooling. It remains intact over 1000° which would require the molecule, which is five times heavier than air, to fall up above the stratosphere where there’s enough energy to break this molecule apart, then chlorine would fall back down to the Ozone layer, unless it finds hydrogen in the solar wind to make HCl (hydrochloric acid) which makes it heaver again and prevents it from reacting with the Ozone.
So what is the most Ozone depleting chemical in a stratosphere? (Drumroll please) It is Ozone! That’s right, Ozone is unstable and when it reaches near 9 ppm, it destroys itself as fast as it’s being created. Free oxygen and free nitrogen will combine to form nitric oxide which speeds up the process. This is why our sky is blue. If there was no UV light from the sun, the sky would be black.
Have you ever noticed the color of the sky after sundown from the vantage point of the International space station? It is green! This is the nitrogen compounds giving up their energy reverting back to O2/N2, their natural state before the extreme cold in earths shadow freezes the process.
Why is the consumption/depletion of Ozone over the South pole weak this year? Because there are no sunspots, the sun is not very active. Polar stratospheric clouds (mostly hydrogen compounds like methane and ammonia) come from space floating near 60,000 feet as described in the famous U-2 flight over the continent. (the same thing that causes the light of aurora borealis/Australia Borealis) when the sun is active, the earths magnetic field pulls in the ionized gas, freezing in the long, light less Antarctica winter. These compounds that react with Ozone warm up and burn off, creating mostly water, in the first rays of sunlight of spring over Antarctica. When the PSC’s are gone, O-Zone levels return to normal. This process can also be verified by the measurement a foot of water is created on average over the continent that has nearly no measurable rainfall and is one of the driest deserts on earth. (The original base station at the South Pole is under 60 feet of ice)
The oxidation of hydrogen gases in the northern lights is the primary reason for ocean levels rising a few millimeters per year. We live in a gravity well, everything that falls in cannot get out. In a billion years, this will be Waterworld.
Now you know why they don’t talk about the Ozone hole anymore, it’s a completely natural phenomenon far away from any industry and has no correlation with their objectives.
Hi Max,
way to many errors in your post to discuss the coontent of it. As ther are:
-“Chlorine fluorine and carbon as a molecule is far too heavy, it does not fall upward. ”
– “… This is why our sky is blue. If there was no UV light from the sun, the sky would be black.”
– ” Polar stratospheric clouds (mostly hydrogen compounds like methane and ammonia)”
– “he Ozone hole anymore, it’s a completely natural phenomenon far away from any industry and has no correlation with their objectives.”
[snip – [you have IP addresses in the same day in Mexico, Texas, and Georgia – you’re a FAKE – BANNED – mod]
Great! Then the Kyoto Protocol solved Global Warming.
Let’s all grab some beer and hit the beach. Done Deal.
Two non-existent problems both of which are solved by more government in everyone’s lives.
Leftists are nothing if not consistent.
Regardless, as usual, like our other trolls, Lyle never reads past the headlines. The article itself declares that the sole reason for the smaller hole is because the stratosphere has warmed. It has nothing to do with the Montreal Protocol.
As far as we know the “hole” has always been there, and always will be, with the continents in their current configurations. No evidence that getting rid of Freon had any effect.
No the hole was not always there:
https://ozonewatch.gsfc.nasa.gov/facts/history_SH.html
Where Do you have you alternative facts from?
The first time anyone looked was 1959, and the hole existed.
No it didn’t.
No the hole did not exitst in the 50ies 60ies nor the 70ies: they call it a hole as soon as the ozone level drops below 200 DU.
It is not really hard to comprehend this.
Hi Samuel,
Phil already explained this to you here:
https://wattsupwiththat.com/2019/10/22/hole-in-the-ozone-layer-shrinks-to-smallest-size-on-record/#comment-2830508
You might come back as soon you digested (no hope for comprehension on your side) this.
BR
MFKBoulder
So claimith: MFKBoulder
“No the hole was not always there:”
So, ya’ll be careful, ….. cause MFKB will be telling you that the Jet Stream has not always been there, …… because, ……
It was in the 1920s, a Japanese meteorologist discovered the Jet Stream
Or that, …. it was in 1939 a German meteorologist discovered the “jet current”
Or that, …. the US discovered the Jet Stream in 1944.
Sam,
stop sobbering aournd about what I might say.
Would be better you say something related to the graphs provided here by many forists.
At least you could discuss here the data of Antarctic Troll Station (Noway), this (name of the station) would at least fit to your behavoior here.
MFKB, …….. tell me, ……. what created/creates the ozone (O3) layer that resides in the troposphere?
“The ozone layer or ozone shield is a region of Earth’s stratosphere that absorbs most of the Sun’s ultraviolet radiation. It contains high concentration of ozone (O3) in relation to other parts of the atmosphere, “
Reminds me of when I got shadow banned fr Pokemon go for being in three cities in one day. Of course I was travelling. Also when I post at work which is Baltimore for some reason, Los Angeles at home and from my phone it is in a random spot in the US as well so I could see easily posting from three spots in one day. (Even a Mexico if I am in Southern Sam Diego
When I pull up mapquest, the default setting is for a city in CA where our headquarters is located.
I don’t live anywhere near CA. Thank God.
I use VPN also, everybody should. Nothing fake about that.
So – if the Montreal Protocol to reduce ozone doesn’t work to shrink the ozone hole then Global Warming will! Hooray! Global Warming is good for something after all!
The angle they do not mention is that under CO2-GHG AGW theory, the GHG effect is reverses in the stratosphere – where the ozone is. That is because the lapse rate reverses in the stratosphere.
So under CO2-GHG AGW theory, the stratosphere should be getting colder everywhere. And thus destroying more ozone when the first sunlight of late September arrives at the South Pole. A warming stratosphere at the South Pole is not in the climate religion model scriptures.
There are some other issues that don’t get any press. The concern has always been the possibility of increased surface UV causing cancer or cataracts, despite no evidence provided that the UV is actually at a higher level. For starters, the few people living there wear heavy clothing covering their skin. (Penguins always wear a tuxedo!) However, the ozone starts to decline in the Winter when there is no sunlight. The rate of destruction accelerates in the early Spring, when the sun is low on the horizon and the sunlight is weak. However, the so-called Ozone Hole (OH) is pretty much directly overhead: the sun NEVER get directly overhead. When the OH is at its greatest, the sun’s rays enter with a long slant range through an atmospheric path longer than when it is high in the sky. That results in more scattering and absorption of UV than for lower latitudes. Further, all the NASA ozone maps show anomalously high ozone concentrations outside the wintertime circumpolar vortex. When the vortex breaks up in October, that ozone rapidly mixes with the ozone-depleted air, bring the concentration back to ‘normal.’ Most ozone is produced in the tropics and migrates polewards. Yet, the ozone concentrations in the tropics are not as high as the ozone gets outside the circumpolar vortex. CFCs may well be exacerbating the ‘problem;’ however, the case has not been made that surface UV has increased or that there has been any negative consequences of decreased ozone. Like AGW, it is a story supported by “could, may, possibly, etc.” The proxy is always reported, not the actual UV that might be dangerous.
(Penguins always wear a tuxedo!)
I thought it was a habit
A good habit or a bad habit?
An “acquired” habit. 😉
Suggest you look at the following:
Phil
It would appear that you don’t understand the graph you presented. Sunlight is much stronger in the tropics than at the poles. So, a modest percentage increase of a small number is generally not anything to be concerned about. How about a map showing the actual UV flux at the equator compared to Antarctica (divided by two to account for the 6 months of darkness)?
Note also that your graph is an “estimate” based on satellite monitoring (i.e. model) rather than actual surface measurements. I suspect that when stratospheric ozone is reduced, ozone is created at lower levels. Have you noticed how much more quickly you will get a sunburn in the mountains than at the ocean, for the same latitude?
To Clyde Spencer
Quote “I suspect that when stratospheric ozone is reduced, ozone is created at lower levels.”
As a matter of fact: Halley Base (and other station’s) Ozone measurements are gound based measurements of the Total Ozone Column. In case ozone is created a lower levels it is measured as well. So we can drop your suspicion.
MFK Boulder
You said, “… Ozone measurements are gound based measurements of the Total Ozone Column.” So are you telling me that there isn’t data for concentrations at various altitudes as claimed by Phil? If that is the case, then you haven’t really added anything to what we know. Phil claims, “No, in the ozone hole ozone drops to zero between about 15km to 20 km altitude, …” With off-axis viewing from a satellite, it is possible to determine the O3 concentrations at all altitudes. Do the satellite measurements indicate an increase in O3 at lower altitudes when the stratospheric concentrations drop as I speculated, or not?
Also, as I recollect, the ground-based measurements look at or near the sun when it is low on the horizon. Therefore, it is returning a measurement for the oblique column not the vertical column as obtained from reduction of satellite data. So, they aren’t strictly comparable.
Phil claims, “No, in the ozone hole ozone drops to zero between about 15km to 20 km altitude, …” With off-axis viewing from a satellite, it is possible to determine the O3 concentrations at all altitudes. Do the satellite measurements indicate an increase in O3 at lower altitudes when the stratospheric concentrations drop as I speculated, or not?
Not a ‘claim’, that is what the data shows!
The ozonesonde data shows that the ozone concentration at lower altitudes stays the same as the concentration between 15 and 22 km drops, so your speculation is refuted.
Phil
You said, “The ozonesonde data shows that the ozone concentration at lower altitudes stays the same as the concentration between 15 and 22 km drops, so your speculation is refuted.”
NOAA shows that surface ozone NEVER gets to zero at the South Pole, and show a minor peak around 2008, and has recently been rising slightly.
I’m beginning to wonder if I can trust your claims.
Clyde Spencer October 27, 2019 at 11:56 am
Phil
You said, “The ozonesonde data shows that the ozone concentration at lower altitudes stays the same as the concentration between 15 and 22 km drops, so your speculation is refuted.”
NOAA shows that surface ozone NEVER gets to zero at the South Pole, and show a minor peak around 2008, and has recently been rising slightly.
What on earth are you talking about? Who said anything about “surface ozone” getting to zero?
I’m beginning to wonder if I can trust your claims.
I don’t make claims I produce data, you should try it some time.
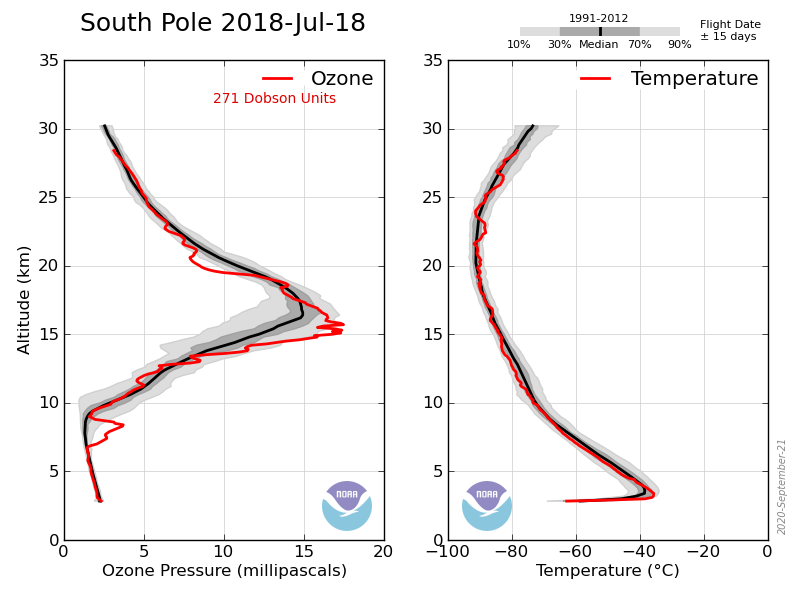
Here’s some more data to illustrate my comment about the ozonesonde measurements.
Compared with the pre hole profile the peak ozone concentration has dropped to zero at ~16km. At 12km and below the profile remains the same as I said (surface O3 is ~2mPa).
The great ozone hole comes and goes leaving us still in the dark about its waxing and waning. The theories, CO2, warm weather, your refrigerator, etc. remain numerous but are unverified.
To be fair, there is a correlation within a limited frame of reference, and that’s good enough for the scientific ego. Besides, we understand the basic mechanisms, characterized in isolation. And while industry was ready to market a new product, and environmentalists always have an outstretched hand, in deference to the Precautionary Principle, what choice, really, did we have?
We could have demanded real proof, not correlation over an extremely limited period.
Weren’t we all supposed to die of skin cancer by 2000 or so?
I did!
(but I got better . . .)
A lot of people did, in Chicago… and they’re still voting in elections!
I’m a refrigeration mechanic. CFC refrigerants are still being used and I have come across many leaks of R-22 and other CFC refrigerants. In fact, China was releasing, or is releasing thousands of tonnes (thats tonnes) of R-11 refrigerant to the atmosphere just recently. So my question is this: If the hole in the ozone layer is getting smaller and there is still massive releases of CFC refrigerants, what is “really” causing the hole in the ozone layer to get smaller? Its not the Montreal protocol.
Its funny, as you pull back the onion layers of “consensus climate change science”, you start to realize its a huge scam, and that the human race is being taking a ride in regards to climate change policies.
a result of the 1987 Montreal Protocol, which phased out chlorofluorocarbons across the world.
Maybe. Or it resumed its chaotic existence, with or without anthropogenic perturbations.
It’s like arctic ice, by carefully picking your begin and end points, and you can prove anything you want.
The fantasy chlorofluorocarbons have been reduced which is important as they are much more potent than the real kind, which have not reduced nearly as much (https://www.downtoearth.org.in/news/environment/china-continues-to-use-ozone-depleting-cfc-11-in-violation-of-montreal-protocol-64716)
Phasing out cfc was and is a disaster it was harmless, always had a cfc fire extinguisher next to me working on vehicles. I spent a great deal of my life at the pointy end of jet airliners cfc was great for instant put out of engine fires.
I would not like to be anywhere near a refrigerator that leaked with the new stuff they use.
Phasing out cfc costs the world trillions every year.
TRILLIONS?
Refrigerator units are only half efficient as they were before the R-11 ban.
That takes a LOT more power.
Power, fossil fuels.
Money.
Dergy October 24, 2019 at 7:19 pm
Refrigerator units are only half efficient as they were before the R-11 ban.
That takes a LOT more power.
Not true, the energy usage of refrigerators has halved every 15 years.
In the 70s refrigerators consumed about 2200 kWh/ year, by the mid 2000s that was down to ~600, now it’s closing in on 300kWh.
My 10yo frig/freezer is rated at 550 kWh/yr, an equivalent model by the same manufacturer now is rated at 440.
Again Phil boy, the refrigerants are less efficient, despite the advances of modern technology as a whole. You seem unable to distinguish between the two.
http://magaimg.net/img/9dmx.png
But that’s not what you said is it. You said that “Refrigerator units are only half efficient as they were before the R-11 ban.
That takes a LOT more power.”
Whereas, as I showed refrigerators are now more efficient and use much less power.
Phil
Phil
You said, “Whereas, as I showed refrigerators are now more efficient and use much less power.”
You’re beginning to sound like Stokes. While “refrigerator units” is a little ambiguous, I’d say that it is different from a refrigerator. So, I’ll grant you that refrigerators are more efficient; however, it is probably mostly from better insulation. Therefore, if we had stayed with R-11 as Dergy suggested, and used better insulation, then his statement about saving power would be more true. That is, we apparently traded off refrigeration efficiency for a requirement for more and better insulation. Without a complete cost analysis of old versus new refrigerators, it isn’t obvious whether there is a savings in manufacturing energy costs. But, it does appear that we could be saving refrigeration costs today had we not changed to the newer refrigerants and just made changes in insulation.
While “refrigerator units” is a little ambiguous, I’d say that it is different from a refrigerator.
The first time he posted he said
Dergy October 24, 2019 at 7:06 pm
Also, a refrigerator today is 50% the efficiency of refrigerators from 1950s due to the Montreal Protocol.
So there’s no ambiguity about what he meant.
As the data shows refrigerators now are five times more efficient and cost about one third of those from the 70s.
Most countries did not sign on to the Montreal agreements. You can still buy R-22 in Mexico for much less than in the USA. The smugglers probably bring some in for the HVAC industry in Texas. I just paid an exorbitant amount to have my AC recharged. China still uses a large amount of chlorinated solvents that the US restricted. I seem to remember a new satellite that looked for chlorine in the atmosphere. The map of chlorine over China was informative.
For the people who think the hole is decreasing due to our reduction in CFCs – if the natural variability dwarfs the small change we presume is due to the reduction of chlorine and bromine in the atmosphere, then we are still presuming. We do not have a good analysis of how much is actually in the stratosphere, let alone a long enough period of good data to draw the small trend out of the data.
Loren Wilson October 23, 2019 at 3:10 pm
Most countries did not sign on to the Montreal agreements.
Yes only 197 countries signed it, who do you think didn’t sign it?
NASA seems to downplay the more intense orange and red colors, immediately adjacent to the light purple/pinks. Not only are the low DU values higher, the highest polar DUs are also much higher than usual too. Compare to historical images shown.
i.e. there was a LOT more ozone production this southern winter.
“The record-small ozone hole was a result of warm weather; however, NASA scientists noted the hole is, in fact, slowly shrinking in size”
Up until a year ago, there was no evidence for any reduction in size.
Funny how the evidence appeared only when it was needed.
Have a look at this graph:
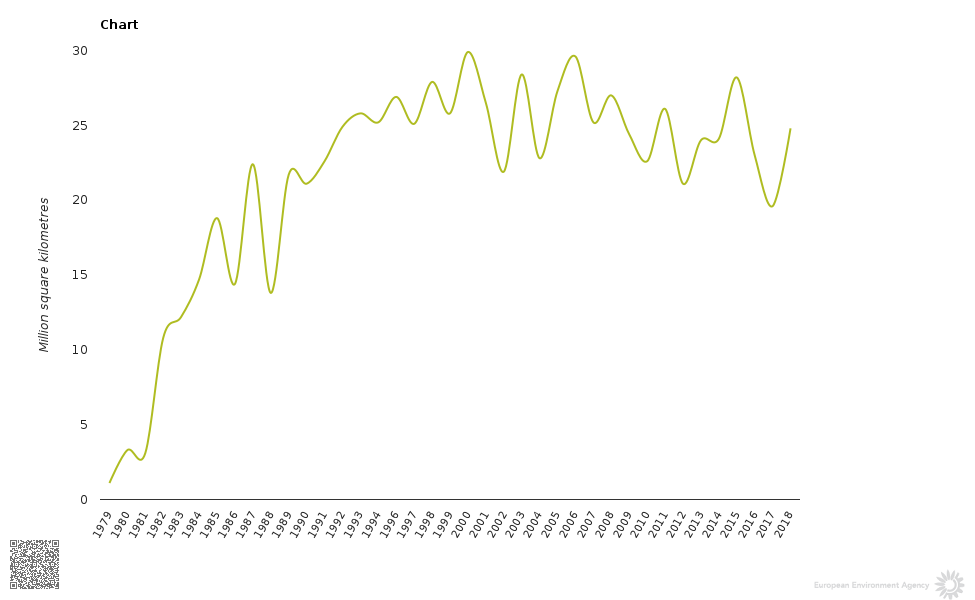
This graph is in: https://ec.europa.eu/clima/policies/ozone_en
Peaks were on a clear downward trend as of the 2015 peak, and dips were on a clear downward trend as of the 2017 dip. The downward trend started no later than a peak around 2006. The alltime peak of ozone hole size was around 2000, and a dip around 2002 was one that established itself as one to dip below afterwards, which happened twice around 2012 and 2017, with the 2017 dip being the deepest so far.
Funny how the graph appeared only when it was needed.
Oh, the irony.
Do you have anything intelligent to contribute, or are you just going to stay true to form?
A three year trend, oh the irony.
The downward trend in ozone hole size has been going on at least since 2006.
“It’s a rare event..”
“Strahan noted that such [un?]usual weather patters (sic) have produced small ozone layers in the past, as it did in 1988 and 2002.”
The third occurence in 31 years is rare? That’s a strange definition of rare.
And maybe very low Dobson units in some years are also “rare”, but their occurrence is just used to justify controls and an entire rent-seeking industry.
“On record” like it means something other than short term weather.
Ok NASA. Quick like a bunny rabbit, tell me how big was the hole from 1940 to 1950.
Stratospheric warming in polar regions is, as I understand it, caused by the rapid sinking of cold air to lower altitude causing air coming in from outside the immediate polar region to replace it. In other words, it creates some mixing of air in the stratosphere that brings in more ozone rich air to replace the ozone depleted air that sank. This would basically come under the heading of weather.
Maybe the world’s governments can stop banning MaxAir inhalers, the asthma medication banned for destroying the ozone of our planet. Would help more people than they imagine they can help with their stupidity.
They mention “stratospheric warming” as the cause but don’t mention that stratospheric warming is related to colder surface temps. Global warming causes the stratosphere to cool according to scientists. It inverts at the tropopause. There are a number of papers linking stratospheric cooling and GHGs.
There never was an ozonehole.
What do you suppose those graphics in the post are showing?
Check for peroxides! I will look for paper. The spectra of H2O2 and ozone look identical.
coulkd you please provide a link to H2O2 Spectral absorbance (in gas phase)?
(w/o paywall)
Pretty similar. Have a look yourself…
O3
http://magaimg.net/img/9dmw.jpg
H2O2
http://magaimg.net/img/9dmv.png
Degy, nice try,
One is for a gas, the ohe other one for a liquid solution with more than H2O2.
Try again please.
Hi Dergy,
two pictures without reference and one not even fitting to the issue dicussed (your “H2O2” representing H2O2 with NaNO2 and NaNo3 (solution?)) :
not convincing.
And further more: not true at all! H2O2 and Ozone absorption as f(frequency) plot are different in shape and different in magnitude.
@MFKBoulder: links to these graphs are not paywalled:
Here is Ozone:
http://joseba.mpch-mainz.mpg.de/spectral_atlas_data/cross_sections_plots/Ozone/O3_HartleyHuggins(1992-2003)_lin.jpg
and here is H2O2:
http://joseba.mpch-mainz.mpg.de/spectral_atlas_data/cross_sections_plots/Peroxides/Hydrogen%20peroxide%20H2O2/H2O2_285-381K_230-350nm_lin.jpg
Yet this leaves the question at Dergy and henryp: who provided you with the “alternative facts”?
Put their domain to the blacklist.
That’s blatantly not true.
Could you at least give a reference where you got these “alternative facts” from?
Comparing these two plots evidently shows the claim of henryp is not rrue. No idea what made him believe “he spectra of H2O2 and ozone look identical.” Neither in shape nor in magnitude are the absorption cross sections of O3 and H2O2 similar.
http://joseba.mpch-mainz.mpg.de/spectral_atlas_data/cross_sections_plots/Peroxides/Hydrogen%20peroxide%20H2O2/H2O2_285-381K_230-350nm_lin.jpg
http://joseba.mpch-mainz.mpg.de/spectral_atlas_data/cross_sections_plots/Ozone/O3_HartleyHuggins(1992-2003)_lin.jpg
Loydo,
Those graphics are clearly “showing” natural variation of stratospheric ozone concentration and at no time do the lowest variations provide a “hole” in the ozone layer.
You would not have needed to ask about this if you had read the labels on the graphics.
Richard
It shows how good they are at using colours to make something look like a hole when it probably isn’t.
It’s an area of weak Ozone depletion, it took a long time to form this year too.
There’s a weak ozone depleted area forming over Scandinavia at the moment.
When you say weak you could also say thinning?
No. The key word I used is “depleted”, i.e. weakly depleted.
“Thinning” would imply a physical change in the atmospheric depth of the ozone as a ‘layer’. That’s not what I said or implied. Depleted means lowered in concentration, not thinner. More rarefied perhaps, but not thinner.
PMJD
Just like the invention of the phrase “Ocean Acidification,” the “Ozone Hole” was invented to exaggerate the effects of reduced ozone concentration. It all sounds very much like an attempt to stampede the lemmings.
“It’s not a sign that atmospheric ozone is suddenly on a fast track to recovery.”
Recovery from what? Is it assumed that Earth without an ozone hole is the norm, and that this gaping hole was opened like a wound because of 20th Century progress? It seems to me that the “hole” is the natural state of the atmosphere and no one needs to worry about it.
Hey I could use some help over at Cliff Mass’s blog. https://cliffmass.blogspot.com/2019/10/the-real-climate-debate.html?m=1
JeffB,
Mo point in my trying to help. Cliff Mass refused to engage with me in the recent WUWT post on the same subject.
Richard
It seems to me that the “hole” is the natural state of the atmosphere and no one needs to worry about it.
Bingo!
Observing something for the first time, doesn’t mean it has never happened before.
I have never believed it to be an actual hole, as reported in the media, allowing for UV to reach the surface. What I have studied over time is it is more a thinning. Either way, O3 is continuously created and destroyed and is repelled by magnetic fields.
I read a report in the Australian media a few months back that stated more CFC’s were entering the atmosphere from Asia forcing the hole to grow. Seems that was more environmental fake news.
“I have never believed it to be an actual hole, as reported in the media, allowing for UV to reach the surface. What I have studied over time is it is more a thinning.”
I think “thinning” is a more accurate description.
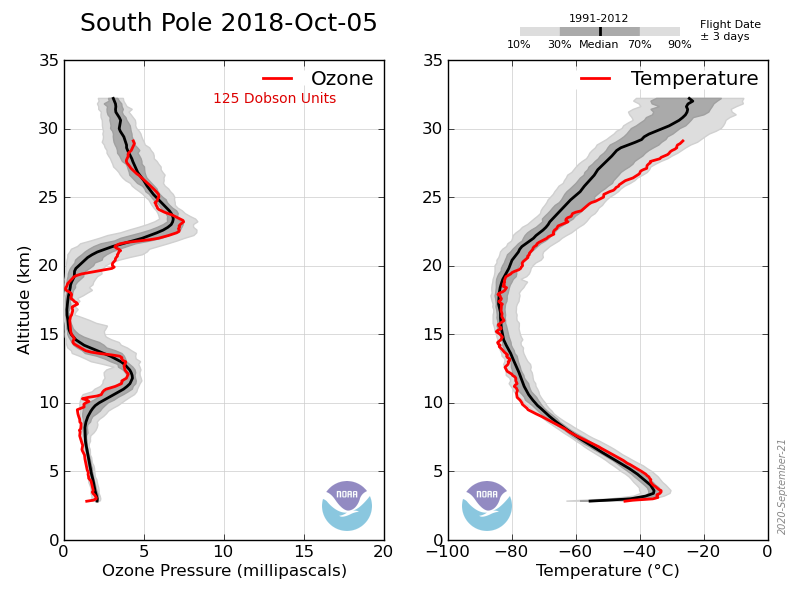
No, in the ozone hole ozone drops to zero between about 15km to 20 km altitude, that’s hole compared with a peak there of ~15mPa when there is no hole.
Phil
Another of your disingenuous comments. The important metric is Total Column Ozone (TCO), not what is occurring at a particular altitude. Typically, the TCO concentration drops from about 300 PPM to about 100 PPM. That is, a 66% reduction is being called a “hole.”
The question also should be, “What is the practical significance of this?”, when the sun is low on the horizon and passes through a longer atmospheric path than sunlight over the tropics, and also passes through elevated ozone concentrations before encountering the so-called “hole.”
Clyde
With ” Typically, the TCO concentration drops from about 300 PPM to about 100 PPM.” you mean typical since the 1980ies, isn’t it?!?
MFKB
You asked, “you mean typical since the 1980ies, isn’t it?!?” If your point is that the decreases didn’t occur until the 1980s, then I would reply that we only have confidence in the low values since the launch of the Total Ozone Mapping Spectrometer in late-1978. Prior to that, measurements were ground-based and I’m not sure the measurements are strictly comparable. If the ground-based measurements were with low elevations above the horizon, then they could well have been measuring the anomalous highs that we now know accompany the so-called ‘Holes.’ There are a lot of details that get glossed over in claims about the ‘Hole.’
Besides, you are taking my comment out of context. I was remarking that even today, the TOC is not zero in the ‘Hole,’ but, is instead, about 1/3 of the high values.
Thanks Clyde, this makes a lot of sense to me.
Quote from Clyde Spencer:
” If your point is that the decreases didn’t occur until the 1980s, then I would reply that we only have confidence in the low values since the launch of the Total Ozone Mapping Spectrometer in late-1978. Prior to that, measurements were ground-based and I’m not sure the measurements are strictly comparable.”
Your point on the comparability is valid. taking this into consideration the measeuremts at Halley are carried out over 60 years now using the same type of instrument (among other methodes). Thus the Halley measerements are comparable. And your doubts in the confidence in the low values is not justified. Same method, 60 years of measurement
Clyde Spencer October 23, 2019 at 11:09 am
The important metric is Total Column Ozone (TCO), not what is occurring at a particular altitude. Typically, the TCO concentration drops from about 300 PPM to about 100 PPM. That is, a 66% reduction is being called a “hole.”
TOC is what results from making measurements at ground level but it obscures where the change is occurring. The ozonesonde data shows where the reduction occurs.

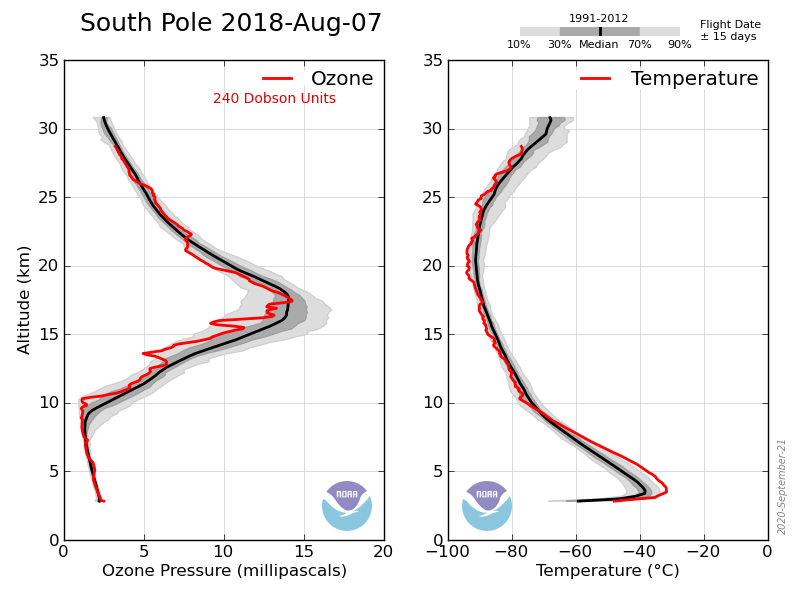
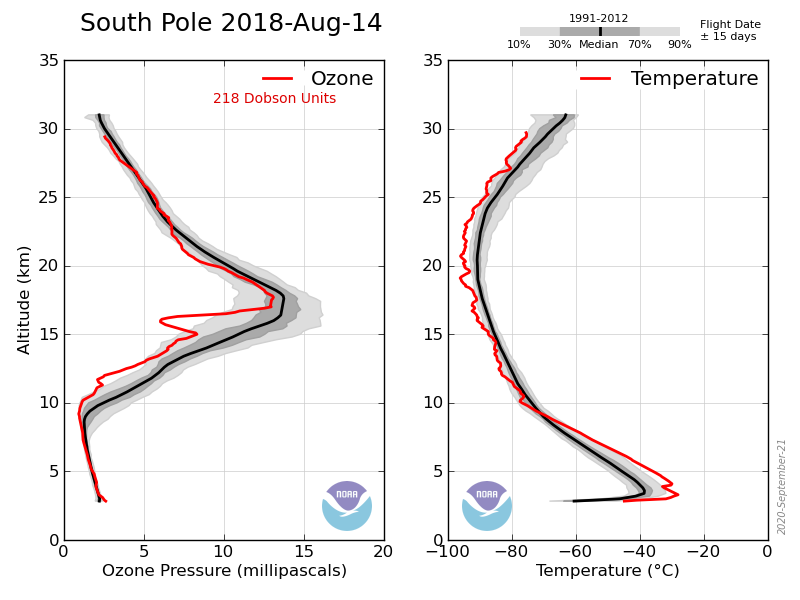
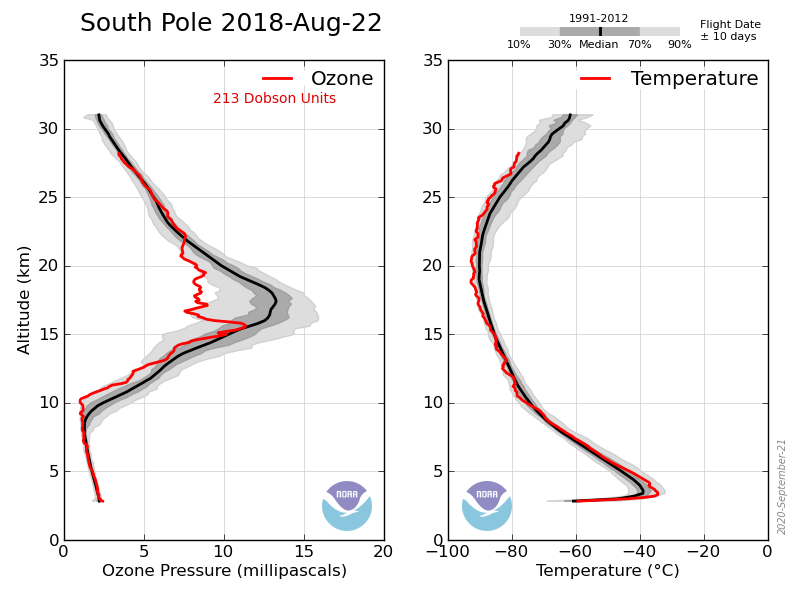
Take last year, in early May the ozone layer at the S Pole started at about 7km and rose to a maximum at ~17km of ~17mPa and then gradually drops with altitude (e.g. 7mPa at 22km). Stays the same in June, July and early August. Then is starts to drop between 15 and 22 km but not above or below. By the end of september between 15 and 22km it drops to zero but remains at its former values elsewhere.
That is the ozone hole exists between 15 and 22 km, nowhere else, the TOC is the surface level integral of the ozone in the atmosphere, but if you want to understand the processes involved in forming the hole you need to know this. The reduction to zero between those altitudes is what causes the hole.
This year was unusual in that the temperature between 15 and 22 km did not drop low enough to cause such a large drop in ozone concentration:
To return to the pre-Ozone hole values would require the following profile:
MFKBoulder
You said, “… Thus the Halley measerements are comparable.” What the Halley measurements establish is that the apparent Antarctic ozone environment, as measured with the same type of instrument, has not changed in 60 years. What really is at issue is the different geometry of the measuring and the differences in instrumentation, as compared to satellite measurements. The Halley measurements aren’t compelling evidence of the absence of ozone depletion before the advent of satellite measurements. As I have pointed out before, the zone of depletion is asymmetric in shape and location with respect to the South Pole. Also, the ground measurements with a Dobson spectrophotometer are essentially tangent to the surface and integrate the cross-sections of vertical profiles, over tens of miles, for different altitudes. Because of the sun’s ray path, the Halley measurements are measuring a higher elevation and probably higher concentrations at the end of the line than at the instrument site.
at Clyde Spencer October 24, 2019 at 11:13 am
“Because of the sun’s ray path, the Halley measurements are measuring a higher elevation and probably higher concentrations at the end of the line than at the instrument site.”
So how far do you think is the upper end of the measurement-path away form the instrument at the ground whe it measures the ozone content of the stratosphere End of october?
And even more interesting: wwhy did the Dobson instrument at hally measure higher values from 1959 (acutally from 1956 AFAIR) until the mid of the 80ies? And then until today low TOC values at the yearly minimum / October measurements?
Phil
Thank you for the graphs. They were interesting. However, they present some questions. We are still dealing with a proxy for the phenomenon that is of concern — SW UV.
Since UV creates and destroys ozone, could it be that there is no loss in ozone at the lower altitudes because the UV is blocked by the action of destroying the ozone in the 12-15 km region?
The unanswered question still is, are the surface UV fluxes, at the peak of the ozone loss, sufficiently high to be of danger to biologic organisms?
Clyde Spencer October 24, 2019 at 2:09 pm
Phil
Thank you for the graphs. They were interesting. However, they present some questions. We are still dealing with a proxy for the phenomenon that is of concern — SW UV.
No we are not, those measurements are made in situ using an electrochemical ozone sensor.
Since UV creates and destroys ozone, could it be that there is no loss in ozone at the lower altitudes because the UV is blocked by the action of destroying the ozone in the 12-15 km region?
Not when all the ozone between 15 and 22km has been destroyed, that’s why at the ozone minimum the UV-B measured at the surface increases, that’s the principle of the Dobson meter.
The unanswered question still is, are the surface UV fluxes, at the peak of the ozone loss, sufficiently high to be of danger to biologic organisms?
According to measurements by the Aussies workers at their Antarctic bases receive more than five times the recommended limits of UV.
MFKBoulder
You asked, “So how far do you think is the upper end of the measurement-path away form the instrument at the ground whe it measures the ozone content of the stratosphere End of october?” I imagine that if it is pointing at the sun, it goes all the way to the top of the atmosphere.
You asked, “And even more interesting: wwhy did the Dobson instrument at hally measure higher values from 1959 (acutally from 1956 AFAIR) until the mid of the 80ies? And then until today low TOC values at the yearly minimum / October measurements?”
I can’t confirm those claims because NOAA does not show a Dobson instrument at Halley; it shows an instrument at the South Pole. I found another paper [ https://www.metsoc.org.nz/app/uploads/2018/12/Nichol.pdf ] that indicates there is a NOAA Dobson instrument at Arrival Heights (Antarctica), which was installed about 1988 and had been operating up until at least 2018. I made a good faith effort to look at your claims but was unable to find support.
I did run across in interesting comment at a NASA site [ https://ozonewatch.gsfc.nasa.gov/facts/history.html ]: “In that year [1956], ozone measurements using a Dobson Spectrophotometer began. … These measurements gave the first clues that there was trouble in the ozone layer.”
[ https://en.wikipedia.org/wiki/Dobson_ozone_spectrophotometer ]
I did run across in interesting comment at a NASA site [ https://ozonewatch.gsfc.nasa.gov/facts/history.html ]: “In that year [1956], ozone measurements using a Dobson Spectrophotometer began. … These measurements gave the first clues that there was trouble in the ozone layer.”
And as the graph they show (“These measurements”) where your ellipses are, that series of measurements showed the onset of problems in the late 70s-early 80s.
at Clyde Spencer

You State: “I can’t confirm those claims because NOAA does not show a Dobson instrument at Halley”
Clyde why were you digging in the NASA pages and not searching for the ones who measure the longest Ozone record:
“BAS Halley Dobson“ (w/o quotes) would be the first I would search for ANY information on Ozone in Antarctica.
Your confirmation is not needed but you might discuss these ground-based measurements:
Since 1959 Dobson values were measured be BAS.
And these are the data (link was already provided).
And these data confirm the claim of Phil and others here. Ozone depletion to the level we now call “Ozone Hole” began in the 80ies with 25 years of measurements before did not show any sign of an “ozone hole” (i.e. O3 level below 220 DU) it and it occurred in all years after this.
Clyde you stated:
“I can’t confirm those claims because NOAA does not show a Dobson instrument at Halley; “
First: your confirmation is not needed.
Second: try to goggle BAS Halley Dobson spectrograph:
This lead me to:
https://www.bas.ac.uk/project/meteorology-and-ozone-monitoring/
more than 60 years measurement with the same measurement principle.

There are people seeing here a sine wave. I cannot confirm. I rather see two sates (until 1970 and from 1986) with a transition phase 1970 to 1986.
Phil
I should have said 15-22 km instead of 12-15 km.
Phil
There seems to be a disconnect! I claimed our conversation has been revolving around ozone, which is a proxy for supposed surface UV intensity. Your response was, “No we are not, those measurements are made in situ using an electrochemical ozone sensor.” You seem to be having difficulty letting go of the proxy.
I want to know if there are surface UV measurements that demonstrate that springtime UV in Antarctica exceeds the Summer values of the Tropics or mid-latitudes.
Stating “… Aussies workers at their Antarctic bases receive more than five times the recommended limits of UV” doesn’t say whether it is actually measured or if it modeled on assumptions that may not be valid. I’d appreciate a link to the claim.
Also, UV can by quite intense in even mid-latitudes, which is why people outdoors are advised to cover up or apply sunscreen. I’d simply like to know if the worst-case surface UV in Antarctica is unprecedented — a popular word today — or if it is typical of what life encounters throughout the rest of the planet? Bear in mind that UV exposure increases with elevation in the mountains and animals and humans do well in such conditions. So, again, I’m asking for measured proof of surface UV that is outside the bounds of what life has evolved with, and therefore adapted to.
O3 is not a proxy it is the atmospheric change that is taking place, you tried to discredit the measurements by incorrectly describing how they are made. You attempt to deflect from the subject of this post is noted but you are not the only one posting here and many do not understand the mechanism (including you).
Stating “… Aussies workers at their Antarctic bases receive more than five times the recommended limits of UV” doesn’t say whether it is actually measured
Nice attempt at selective quoting, what I said was “According to measurements by the Aussies workers at their Antarctic bases receive more than five times the recommended limits of UV.”
https://www.ncbi.nlm.nih.gov/pubmed/19706145
Phil
Thank you for the link as it was informative. In my defense, you DID mention “measurements,” but neglected to mention whether ozone or UV was being measured. Inasmuch as you had only been talking about ozone up to that point, I assumed that you were still talking about UV doses based on estimates from the proxy.
The UV dosimeter approach is interesting, but has a drawback of only reporting the total dose for an unspecified period of time, instead of the surface UV flux. However, an accompanying article at the same link ( https://www.ncbi.nlm.nih.gov/pubmed/14967793 ) does add some context.
From the NIH article, “Sunbathing or exposing shoulders (risk behavior) outside the beach resulted in a median of 2.5 SEDs per day in northern Europe and 3.2 SEDs per day in southern Europe;” That compares to to the median exposure of the Australian dock workers in Antarctica of 3.2 SEDs. From the same NIH article, “Sunburning doses above 10 SEDs per day were connected with sunbathing or exposing shoulders.” At first blush, it doesn’t seem that the Australians in Antarctica were experiencing anything significantly different from the general population in Europe.
Another interesting article ( https://www.ncbi.nlm.nih.gov/pubmed/19572325 ) for context is a study of Australian lifeguards doing pool duty, using the same dosimeters as the Antarctic dock workers. From the article, “The measured UVR exposures varied with location, ranging from high median UVR exposures of 6.2 standard erythemal doses (SEDs) to the lowest median of 1.7 SEDs. More than 74% of the lifeguards’ PS badges showed UVR above recommended threshold limits for occupational exposure. [Compared to 80% of the dockworkers.] Thirty-nine percent received more than four times the limit [Compared to “31% received more than five times the limits” for the dockworkers] and 65% of cases were sufficient to induce sunburn.” It would appear that the largest variable, which is unaccounted for, is the amount of time the lifeguards spent exposed to the sun. That is why instantaneous flux is a better measure of the potential risk. However, again, it appears that the lifeguards in Australia experienced exposures comparable to the dockworkers in Antartica. The difference being that the dockworkers were wearing protective clothing and suffered fewer instances of sun burning, and over much more limited portions of their bodies.
So, again, I’m asking for measured proof of surface UV that is outside the bounds of what life has evolved with, and therefore adapted to.
One thing you should also bear in mind Clyde is that in the absence of the regulations applied to CFC production we would have stratospheric levels about double what we now have. Under those conditions we could expect to have 17% of global ozone destroyed and a regular Arctic ozone hole. Midlatitude UV Index reaching 15 would occur.
Phil
You asserted that “Under those conditions we could expect to have 17% of global ozone destroyed and a regular Arctic ozone hole. Midlatitude UV Index reaching 15 would occur.” How can you prove that?
Years ago when I modeled the expected UV at 45 deg latitude, what I saw was a slight increase in Wintertime UV over time, when the values were quite low and of little concern. When Summer came back, the ozone came back and held the Summer UV levels constant. That is, when the UV presented the greatest potential risk, the system compensated and prevented the kind of runaway conditions you assert. I have less trust in models than actual measurements. I would like to see actual surface UV measurements demonstrating your assertion. Not that I don’t trust you, but you are, after all, anonymous. Further, when I asked about Antarctic UV levels you provided information that showed the behavior for Antarctica was essentially the same as for Europe.
Clyde Spencer October 25, 2019 at 3:55 pm
Years ago when I modeled the expected UV at 45 deg latitude, what I saw was a slight increase in Wintertime UV over time, when the values were quite low and of little concern.
Please describe your model, e.g. what mechanism for destruction of O3 did you use?
How is that model accounting for the change in stratospheric temperature and the possibility of a corresponding increase in arctic PSC.
I would like to see actual surface UV measurements demonstrating your assertion. Not that I don’t trust you, but you are, after all, anonymous.
Since the Montreal Protocol was adopted fortunately the doubling of CFC didn’t occur.
I am not anonymous, I use my name.
the aussie media just picked up on something smarter people read about some yrs before
that asian guilty report is because they got a ocntract(I gather) to remove?reprocess stuff under some green scam
so they got lots of money and…history
Check for peroxides! I will look for paper. The spectra of H2O2 and ozone look identical.
No Henry’s statement
“The spectra of H2O2 and ozone look identical” is blatantly wrong. The most friendly expression for this is ‘alternative facts’.
O3
http://magaimg.net/img/9dmw.jpg
H2O2
http://magaimg.net/img/9dmv.png
Dergy,
Nice try, comparing gas with a solution of 3 components in?, I guess water?!?
Ozone is destroyed by volcanic eruptions via both direct reduction and through sulphate aerosols forming a substrate to catalyse 03 breakdown.
https://journals.ametsoc.org/doi/full/10.1175/2008JCLI2482.1
‘NASA scientists noted the hole is, in fact, slowly shrinking in size — a result of the 1987 Montreal Protocol, which phased out chlorofluorocarbons across the world’
There we go: human actions affected the atmosphere, human actions corrected the problem.
see also: acid rain… and other issues solved by concerted action – Y2K, whales (saving of).
Now we need to acknowledge that human CO2 is changing the climate and continue to take concerted international action on that
“griff October 22, 2019 at 11:55 pm
see also: acid rain…”
Fake.
“…and other issues solved by concerted action – Y2K,…”
Fake.
“…whales (saving of)…”
We found a better oil.
griffinator barks:
‘NASA scientists noted the hole is, in fact, slowly shrinking in size — a result of the 1987 Montreal Protocol, which phased out chlorofluorocarbons across the world’
Well if ‘NASA scientists’ note something, it just has to be true, right? Word of the day — “credulous”.
The ozone hole in the south suddenly narrowed in September 2019 as a result of the sudden warming of the stratosphere over the southern polar circle.
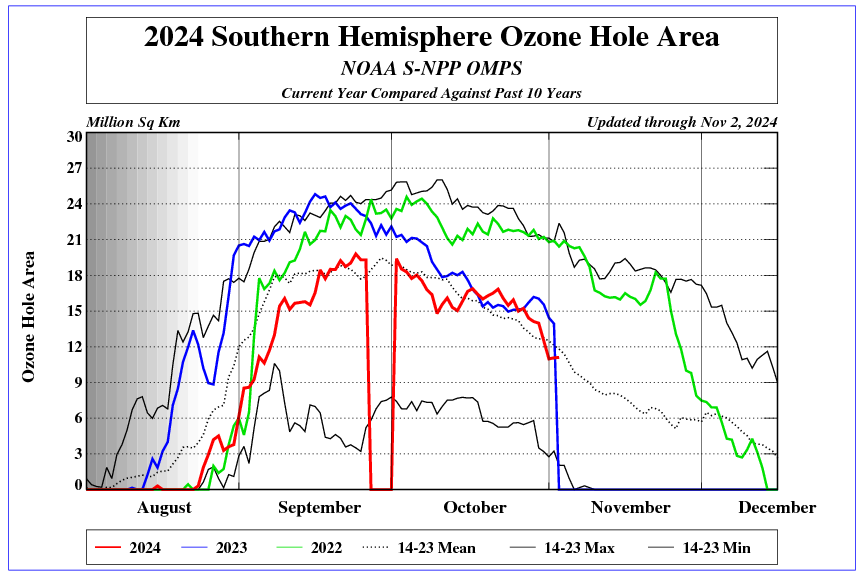
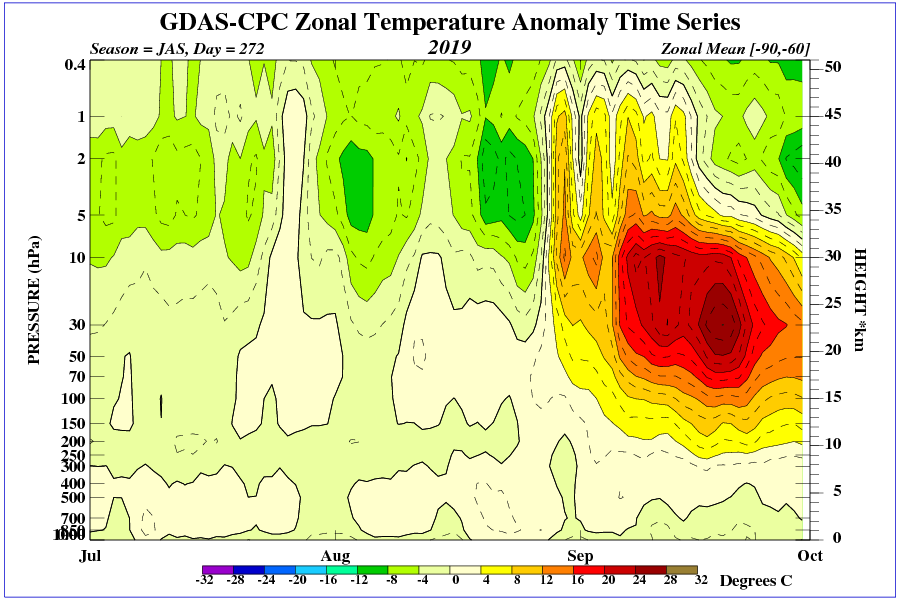
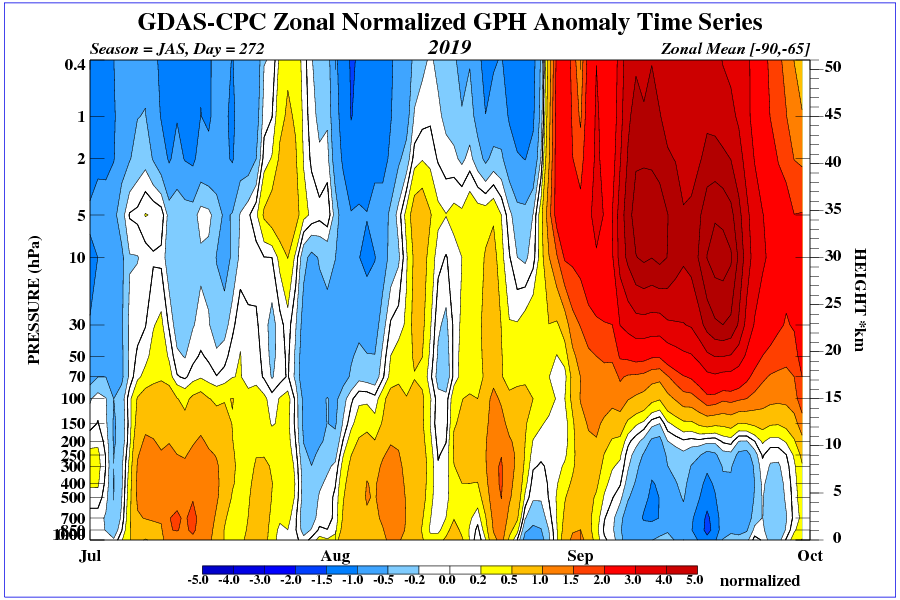
The inflow of ozone resulted from the weakening of the southern polar vortex.
The graph shows the temperature jump in stratosphere over the southern polar circle in September 2019.