From NASA Global Climate Change
2019 Arctic Sea Ice Minimum Tied for Second Lowest on Record

By Maria-José Viñas,
NASA’s Earth Science News Team
The extent of Arctic sea ice at the end of this summer was effectively tied with 2007 and 2016 for second lowest since modern record keeping began in the late 1970s. An analysis of satellite data by NASA and the National Snow and Ice Data Center (NSIDC) at the University of Colorado Boulder shows that the 2019 minimum extent, which was likely reached on Sept. 18, measured 1.60 million square miles (4.15 million square kilometers).
Arctic sea ice likely reached its 2019 minimum extent on Sept. 18. At 1.60 million square miles (4.15 million square kilometers), this year’s summertime extent is effectively tied for the second in the satellite record, according to NASA and the National Snow and Ice Data Center. Credit: NASA/Trent Schindler. This video can be downloaded at NASA’s Scientific Visualization Studio.
The Arctic sea ice cap is an expanse of frozen seawater floating on top of the Arctic Ocean and neighboring seas. Every year, it expands and thickens during the fall and winter and grows smaller and thinner during the spring and summer. But in the past decades, increasing temperatures have caused marked decreases in the Arctic sea ice extents in all seasons, with particularly rapid reductions in the minimum end-of-summer ice extent.
Changes in Arctic sea ice cover have wide-ranging impacts. The sea ice affects local ecosystems, regional and global weather patterns, and the circulation of the oceans.
“This year’s minimum sea ice extent shows that there is no sign that the sea ice cover is rebounding,” said Claire Parkinson, a climate change senior scientist at NASA’s Goddard Space Flight Center in Greenbelt, Maryland. “The long-term trend for Arctic sea ice extent has been definitively downward. But in recent years, the extent is low enough that weather conditions can either make that particular year’s extent into a new record low or keep it within the group of the lowest.”

The melt season started with a very low sea ice extent, followed by a very rapid ice loss in July that slowed down considerably after mid-August. Microwave instruments onboard United States Department of Defense’s meteorological satellites monitored the changes from space.
“This was an interesting melt season,” said Walt Meier, a sea ice researcher at NSIDC. “At the beginning of August we were at record low ice levels for that time of the year, so a new minimum record low could have been in the offering.
”But unlike 2012, the year with the lowest ice extent on record, which experienced a powerful August cyclone that smashed the ice cover and accelerated its decline, the 2019 melt season didn’t see any extreme weather events. Although it was a warm summer in the Arctic, with average temperatures 7 to 9 degrees Fahrenheit (4 to 5 degrees Celsius) above what is normal for the central Arctic, events such as this year’s severe Arctic wildfire season or European heat wave ended up not having much impact on the sea ice melt.
“By the time the Siberian fires kicked into high gear in late July, the Sun was already getting low in the Arctic, so the effect of the soot from the fires darkening the sea ice surface wasn’t that large,” Meier said. “As for the European heat wave, it definitely affected land ice loss in Greenland and also caused a spike in melt along Greenland’s east coast, but that’s an area where sea ice is being transported down the coast and melting fairly quickly anyway.”
Actually, the overall summer temperature north of 80 is very consistent. It sticks very close to the long term average. link So, was it really a warm summer in the Arctic? Well, the Arctic is everything above 66° 33’N so most of its area is below 80. On the other hand, that’s also where most of the land is.
The volume of sea ice in the Arctic oscillates on a recurring basis. The control freaks are panicking in public to try to get everyone else to panic and fork over cash.
I did not realize that this decade was going to have the “Panic along with me!” thingy as its meme. I have been enlightened. My only response is: thanks for the input, but I have a lot of THINGS to do, STUFF to take care of, BIRD AND PLANT PHOTOS to catalog, a HOUSE to keep clean, FURNACE FILTERS to install for winter, COOKIES to make, BIRD FOOD to buy.
I’m swamped! Maybe some other time, if you’re still around….. Oh, look!!! Geese migrating south for the winter!!!!! Gotta run!!!!
I just want to add that when checking the Doppler radar map to see if any more rain is coming my way, I saw that Montana is getting heavy snowfall, and Wyoming is getting the south end of that. There is also some snow falling in Washington state. There is a snow depth of 1 to 12 inches in Wyoming and Montana, depending on where you look, and some of that snow is also coating the western side of the Rockies in Washington.
So much for global warming. It will make the ski bums very happy to know that they’ll have early powder available.
This means that it was also “effectively” tied for fourth lowest. One could easily conclude that ice cover has been GAINING since its low in 2012.
and the winner for the most stupid comment of today goes to…
It is gaining since 2012, and the trend since 2007 is flat. Not having made a new, lower low in seven years means that at worst Arctic sea ice is trending sideways.
The lowest years–2007, 2012 and 2016–have typically been followed by higher, especially 2009, 2013 and 2014, but also 2008, 2017 and 2018. However relatively low 2011 and 2015 were followed by lower years.
Tom Johnson
“One could easily conclude that ice cover has been GAINING since its low in 2012.”
Oh yes, so terribly much. Yearly Arctic sea ice extent averages since then:
2012 10.42
2013 10.92
2014 10.81
2015 10.59
2016 10.16
2017 10.40
2018 10.35
Amazing.
‘2019 Arctic Sea Ice Minimum Tied for Second Lowest on Record’
If you hadn’t told me, I wouldn’t have known it. Am I better off for knowing it? Perhaps Man’s newfound ways to monitor Arctic ice are a mistake.
In the meantime, the Antarctic ice cover is spot on at the 1973-2018 average. I would be more worried about this pole losing ice than the one in the north. In fact the Southern Hemisphere’s oceans are cooling, which precedes atmospheric temperatures.
Sooner than later, we are going to see global temps drop. There is also a theory that the Solar Minimum causes more volcanoes to go off. If I lived above 40N (I don’t), I would seriously be concerned about the next couple of decades. You can fudge the numbers only so long, but you can’t hide the visuals when whole areas of populated Earth are freezing.
DMI Antarctic Ice Extent:
Plymouth Weather Ocean Temp Anomolies:

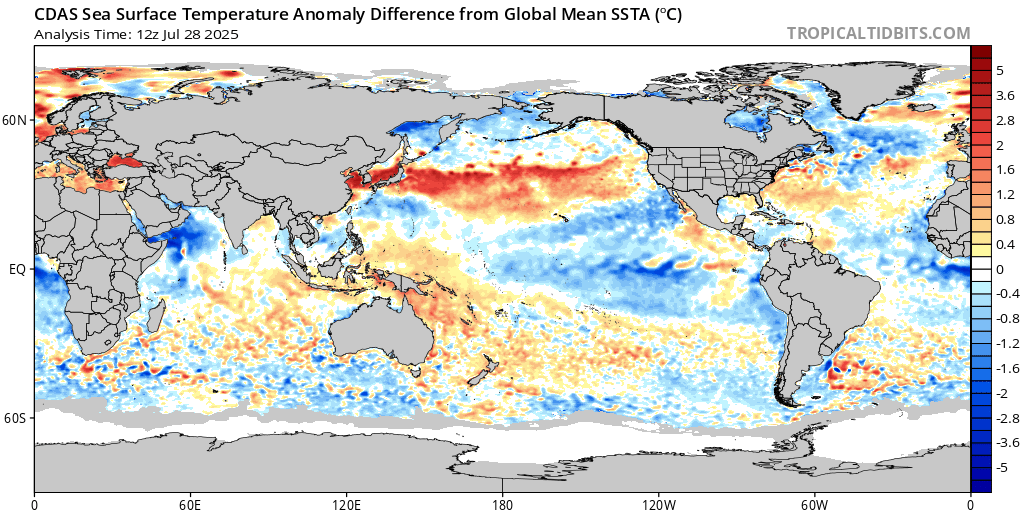
CDAS Ocean Temp Anomolies:
rbabcock
“In fact the Southern Hemisphere’s oceans are cooling…”
Sure? Can you show us some data? Neither surface nor lower troposphere data do show that, little variations here and there excepted.
Here is a graph comparing HadSST3 SH with UAH6.0 LT SH Ocean:
https://drive.google.com/file/d/1Td1KJP8ldInK59ZY49EgSGYtyNP3KIac/view
Both have the same linear estimate for 1979-2019: +0.09 °C / decade.
{ Your tidbits chart shows daily anomalies, and not a trend grid. }
Source
– https://www.metoffice.gov.uk/hadobs/hadsst3/data/HadSST.3.1.1.0/diagnostics/HadSST.3.1.1.0_monthly_sh_ts.txt
– https://www.nsstc.uah.edu/data/msu/v6.0/tlt/uahncdc_lt_6.0.txt
Rgds
J.-P. D.
Dunno how you missed it. Maybe not looking?
https://www.cato.org/blog/global-science-report-sea-ice-expansion-southern-hemisphere-real-driven-falling-temperatures
Even modeling shows the cooling:
https://www.sciencedaily.com/releases/2019/08/190812172328.htm
John Tillman
“Dunno how you missed it. Maybe not looking?”
I prefer to look at existing data:
– https://www.metoffice.gov.uk/hadobs/hadsst3/data/HadSST.3.1.1.0/ascii/HadSST.3.1.1.0.median.zip
– https://www.nsstc.uah.edu/data/msu/v6.0/tlt/uahncdc_lt_6.0.txt
– ftp://sidads.colorado.edu/DATASETS/NOAA/G02135/south/monthly/data/
1. Austral circumpolar SST and lower troposphere above it
Trend 1979-2019 for HadSST3 5° grid 60S-90$ (land-mask): -0.09 °C / decade.
Trend 1979-2019 for UAH6.0 LT 60S-82.5S: -0.03 °C / decade.
2. Trend 1979-2019 for Antarctic sea ice extent and area: both +0.08 Mkm² / decade.
Feel free to compare all that with the corresponding Arctic data. You might wonder a bit.
The effect on planetary albedo is far greater in the Antarctic than Arctic, since, unconstrained by land, SH sea ice extends much farther toward the equator. Angle of incidence, hence reflection is thus greater at these lower latitudes.
John Tillman
“… SH sea ice extends much farther toward the equator.”
Maybe, but on average over the entire satellite period (1979-2019), it is surprisingly only a tiny bit greater than NH sea ice extent, and its sea ice area (aka 100 % pack ice) is even smaller.
Here are graphs showing the monthly absolute extent and area values for Arctic:
https://drive.google.com/file/d/1Ujf0SauOikmZFDUz8BMlbVkLt40Uwn7_/view
and Antarctic:
https://drive.google.com/file/d/1nqdBeRby-yXLeJIvxUfsIqxg-lC61dnK/view
Some numbers quickly will confirm our eye-balling.
Average extent / area for the period 1979-2019, in Mkm²:
– Arctic: 11.46 / 9.32
– Antarctic: 11.56 / 8.77
Chylek et al 2009 shows a correlation of Arctic Temperatures with the AMO
If it’s only the second lowest, it can’t be worse than we saw – never mind thought. Perhaps it’s a sign that things are getting better?
From the JAXA graph on Climate4you looks like it’s tied with 2007 and 2016. 2012 is less than all three.
And at 4E6 km^2 that’s still a lot, equaling 780 Delaware’s an NBS standard unit often cited for calving Antarctic ice bergs.
charles the moderator
Correct you ice cap description as by geological and glaciological definitions an ice cap is on land at the peak or centers of ice sheets. Sea ice is measured in extent and volume. Volume is more important and at its lowest two with no old ice. You write about extent only which is not telling the truth about data observations and measurements.
12 years ago, Mark Serreze declared that “the arctic is screaming”. I wonder what it’s doing now? Perhaps little Miss Thunderpants knows.
Hmmm, three near identical ice extents in a 12 year period? This screams normal to me. Greater extents may be the signature of a colder future.
Only if you ignore the 38 other extents in the satellite record…
Well in fact it WAS the second lowest on record if you take the JAXA/ViSHOP extent.
NSIDC is a 5 day averaged figure.
So, no recovery in the arctic sea ice… and if you look at the volume, thickness and age of the ice, all those figures are at near lowest or record low levels.
Now, if this is NOT a sign of warming, perhaps somebody would care to explain to me why it is this low?
Griff, you have yet to explain why little to no summer ice is a concern, all you do is babble about low sea ice a lot, as it was soooo important, when it has become evident that it doesn’t matter much.
You were repeatedly shown at other websites that your caterwauling about it for the last two years is silly, when you ignored numerous published papers showing lower to no summer ice cover that now in the early part of the Holocene had happened with NO visible climate disasters indicated.
When will you ever look at the big picture?
If sea ice extent was solely determined by temperature, you might have a point. However, wind can affect sea ice extent as much as temperature can. Have you quantified all of that data yet to determine what effect wind had?
Why is there never any mention of the Antarctic other than some isolated parts with unusual melting? It’s bad enough that the Arctic refuses to melt and is not even as low as it was in the past, but the Antarctic hit new record highs during the same time.
Where’s the “global” in global warming?
I was promised a northwest passage and I want it now!
However, this data source shows 2012 and 2016 were also lower than 2019 in both extent and area…
https://arctic-roos.org/observations/ice-area-and-extent-in-arctic
…while this one also shows 2015 and 2016 had an equal or lower minimum volume…
http://polarportal.dk/en/sea-ice-and-icebergs/sea-ice-thickness-and-volume/
…though I guess they don’t have the same ‘scientific’ impact as NASA data.
The Russian icebreaker ‘cruise to the N Pole’ ($120,000 a ticket)~ 3 weeks ago encountered 3m thick packed ice from Svalbard all the way to the pole. The trip with one of the world’s most powerful (nuke) icebreakers took an extra two days because the ship was forced to back up many times to take a run at the ice. Normally one years ice is about a meter thick. All, were very surprised.
Clearly, the ice was piled up and extent was thereby greatly reduced. Bremen gives estimated thicknesses of 50 cm to a metre as do other data groups.
Chicago’s coldest winter since 1872, despite UHI came down from an Arctic Basin that was -50C+ (mid -30sC in the Midwest). The 3m of ice in the Arctic basin will be added to this winter.
Gary Pearse
“Chicago’s coldest winter since 1872…”
Which winter do you mean? 2018/19? Do you have data supporting your somewhat scary claim?
*
Here is the list of the 20 coldest days found within the GHCN daily data set for all available weather stations in Chicago (all values in °C):
USW00004808 IL CHICAGO AURORA MUNI AP 2009 1 16 -36.0
USW00004808 IL CHICAGO AURORA MUNI AP 2019 1 31 -35.5
USC00111497 IL CHICAGO BOTANIC GARDEN 1982 1 10 -32.8
USW00004808 IL CHICAGO AURORA MUNI AP 1999 1 5 -32.8
USW00094846 IL CHICAGO OHARE INTL AP 1985 1 20 -32.8
USW00004808 IL CHICAGO AURORA MUNI AP 2019 1 30 -32.7
USC00111497 IL CHICAGO BOTANIC GARDEN 1985 1 20 -32.2
USW00094846 IL CHICAGO OHARE INTL AP 1982 1 10 -32.2
USC00111497 IL CHICAGO BOTANIC GARDEN 1982 1 11 -31.7
USC00111577 IL CHICAGO MIDWAY AP 3SW 1985 1 20 -31.7
USW00094846 IL CHICAGO OHARE INTL AP 1982 1 16 -31.7
USW00094846 IL CHICAGO OHARE INTL AP 1983 12 24 -31.7
USW00004808 IL CHICAGO AURORA MUNI AP 2019 1 27 -31.6
USW00014892 IL CHICAGO UNIV 1985 1 20 -31.1
USW00004808 IL CHICAGO AURORA MUNI AP 2009 1 15 -31.0
USW00004808 IL CHICAGO AURORA MUNI AP 2019 1 26 -31.0
USC00111497 IL CHICAGO BOTANIC GARDEN 2019 1 31 -30.6
USW00094846 IL CHICAGO OHARE INTL AP 1982 1 17 -30.6
USW00094846 IL CHICAGO OHARE INTL AP 1985 1 19 -30.6
Yes yes! There are indeed 2019 days at the top of the list. But a few very cold days in a month can’t change the monthly average of all stations in a town as dramatically as you pretend.
Here is the top 20 of the descending sort of all months for the Chicago average (absolute values):
1977 1 -11.45
1963 1 -10.42
1979 1 -10.32
1982 1 -9.97
1936 2 -9.76
2014 1 -9.21
2015 2 -9.12
1940 1 -9.03
2009 1 -8.73
1929 1 -8.65
1983 12 -8.65
2000 12 -8.51
1963 12 -8.40
1985 1 -8.25
2014 2 -8.25
1978 1 -8.24
1994 1 -8.22
1979 2 -8.05
1970 1 -8.01
1948 1 -7.77
2019 (and 2018) appear at position 48 (of 1123) and below.
2019 1 -5.69
2018 1 -4.09
2019 2 -3.32
2018 2 -1.93
What you do not seem to have noticed is that Northeast CONUS (and Southeast Canada) experience for the second year in sequence a polar vortex! That is something we really should care about.
And did you notice that when computing out of that absolute data the anomalies wrt the mean of 1981-2010, the ‘coldest’ months (i.e. those with the lowest anomalies) for 2018/19 aren’t January or February for one of these years, but… April 2018, followed by November 2018?
2018 4 -4.53
2018 11 -3.37
2019 3 -1.96
2019 1 -1.21
Rgds
J.-P. D.
Didn’t submarines surface at the North Pole in the ’60’s?
But that was before the “CAGW” hype so I guess those events don’t count.
Gunga Din
“Didn’t submarines surface at the North Pole in the ’60’s?”
“But that was before the “CAGW” hype so I guess those events don’t count.”
CAGW or not, it was warm in the Arctic in earlier times. No doubt about that!
That wasn’t the Skate at the N Pole in 1959, this is:
https://tinyurl.com/y6rge7cj
Note that they weren’t in open water and had to break through the ice, as the captain reported:
“Finally, about 4:30, our sail crunched into the ice where we wanted it…..
The ice was heavier here than we had broken through before, but we were breaking it….
We were on the edge of a narrow , winding lead that disappeared into the hazy distance. Both sides of the lead were piled with the heaviest and ruggedest hummocks I had yet seen in the Arctic”
(Calvert had reported 15′ hummocks before so at least 15′ high.)
Phil.
Thanks.
You’re welcome, that photo is often claimed to be Skate at the N Pole but was actually one of their other Arctic surfacings. The first polar surfacing was in winter prior to sunrise as described by Calvert.
“The first polar surfacing was in winter prior to sunrise as described by Calvert”
Duh, so no photo of a submarine in the daylight! I hate the way that scientific data ruins a good climate story. 🙂
Yeah they had a lot of problems taking photos at all, everything kept freezing up!
From colorado.edu: Arctic sea ice extent (daily data):
(a) absolute data
ftp://sidads.colorado.edu/DATASETS/NOAA/G02135/north/daily/data/N_seaice_extent_daily_v3.0.csv
(b) climatology 1981-2010
ftp://sidads.colorado.edu/DATASETS/NOAA/G02135/north/daily/data/N_seaice_extent_climatology_1981-2010_v3.0.csv
1. Chart with absolute data for the mean of 1981-2010, and some years (2007, 2012, 2017, 2018, 2019):
https://drive.google.com/file/d/1n5qRk-C6w0OdmX05XK8Twhh8VK0l-bTS/view
2. Daily anomalies using the same absolute data and the climatology wrt mean of 1981-2010:
https://drive.google.com/file/d/1nFPvfKESL9WvxtFhDFgZIEXOP0xcGz_V/view
Here you can observe more easily than on the absolute daily chart that
– 2019 has left 2012 and crossed 2007;
but also that
– though 2012 was the year with the lowest sea ice extent (and in area and volume as well), it had a higher extent level at winter’s end than all the following years, and bypassed even the 1981-2010 mean for short a time.
If we build the yearly averages for the period Jan 1 till Sep 27 in the years shown here, we obtain this (in Mkm²):
2012: 10.98
2007: 10.98
2017: 10.83
2018: 10.81
2019: 10.68
Nothing to scare about! But this detail is not uninteresting.
Addendum
The yearly average for the period Jan 1 till Sep 27 for the mean of 1981-2010: 12.02 Mkm²
Greta’s childhood stolen on the basis of just over 40 years of records.
Sounds like something that would come out of the south end of a north facing horse 🙂
Open water in the arctic will lead to heavy “lake effect” snows and increasing albedo.
The author claims, “…in the past decades, increasing temperatures have caused marked decreases in the Arctic sea ice extents in all seasons….”
I’ve commented on this before, why all the attention to the “lowest extent”, the annual low point is a weather, not climate, related value. If an attempt to identify a “global warming trend” is intended looking at the low point in ice extent is like looking at only the highest annual temperature to “prove” global warming. A more accurate indicator of what is happening in the Arctic is looking at the ice extent on June 21sr. The NSIDC lines on the Chararctic graph for the past 10+ years essentially overlap each other. What is happeninging in the Arctic climate? Nothing. No change. Same oh same oh.
How ’bout the following headline instead?
Arctic demonstrates record resistance (less ice) against oncoming glacial cycle.
Since ~500 years of scientific research, they’re unable to measure ice thickness.
But suddenly they promise remedy;
Anyway they seriously can’t offer the ice thickness records about the previous 5 centuries, can they.
https://www.google.com/search?q=their+satellites+can%27t+measure+ice+thickness&oq=their+satellites+can%27t+measure+ice+thickness+&aqs=chrome..69i57.31609j0j9&client=ms-android-huawei&sourceid=chrome-mobile&ie=UTF-8&authuser=1
Since ~500 years of scientific research, they’re unable to measure ice thickness.
But suddenly they promise remedy;
Anyway they seriously can’t offer the ice thickness records about the previous 5 centuries, can they.
https://www.google.com/search?q=their+satellites+can%27t+measure+ice+thickness&oq=their+satellites+can%27t+measure+ice+thickness+&aqs=chrome.