Guest Post by David Archibald
The two major items of interest are the likely month of minimum in the Solar Cycle 24 – 25 transition and the likely amplitude of Solar Cycle 25. The latter can be derived from the solar polar magnetic field strength. Figure 1 following indicates that 25 is likely to be slightly larger than 24 in amplitude:

Figure 1: Solar Polar Field Strength from Wilcox Solar Observatory
The strength of the solar polar magnetic fields is a bit higher than what it was at the 23/24 minimum, shown by the red bar in Figure 1.

Figure 2: aa Index 1868 – 2019
The aa Index is the longest magnetic instrument record, measuring the average of stations in London and Melbourne. What it shows is that we have left the Modern Warm Period behind and have entered a new cold period with magnetic activity similar to that of the late Little Ice Age when the average of activity was similar to the apparent activity floor of the Modern Warm Period.

Figure 3: Ap Index 1932 – 2019
The Ap Index is similar to the aa Index but is based on data from 13 stations. As Figure 3 shows there was an activity floor of 7 during the Modern Warm Period

Figure 4: Interplanetary Magnetic Field 1966 – 2019
The interplanetary magnetic field also shows the break in activity with the end of the Modern Warm Period in 2006. The second half of Solar Cycle 24 was much stronger than the first half.

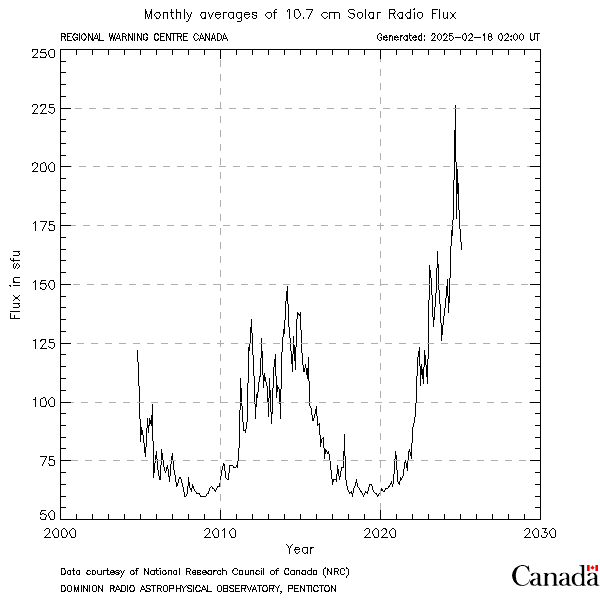
Figure 5: F10.7 Flux 2014 – 2019
The F10.7 flux shows that the Sun isn’t completely quiescent yet. Figure 7 following shows that all of the activity in 2019 has come from the northern hemisphere.

Figure 6: Sunspot Area by Solar Hemisphere 1874 – 2019
The chart of hemispheric sunspot area also shows the clear change of amplitude and character in the break-over from the Little Ice Age to the Modern Warm Period.

Figure 7: Sunspot Area by Solar Hemisphere 1985 – 2019
This graph of 11-smoothed sunspot area shows a number of interesting things. Firstly that the solar hemispheres have different amplitudes. Secondly that the timing of peak amplitude of the hemispheres is different. The peak in activity for the northern hemisphere was in December 2011 while it June 2014 for the southern hemisphere, two and a half years later. The peaks also have different trends which can hold for up to three solar cycles. This is most likely related to the orbital period of Saturn which is 29.5 years. The differences in amplitude of the hemisphere is likely due to the major gas planets moving above and below the solar plane.

Figure 7: Hemispheric Sunspot Area 1985 – 2019
This figure shows the cumulative contribution to solar activity by hemisphere with the total closely correlating to the F10.7 flux above its activity floor of 64.

Figure 8: Heliospheric Current Sheet Tilt Angle 1976 – 2019
The solar cycle isn’t over until the heliospheric current sheet has flattened and it is still a way off from flattening, probably at least a year.

Figure 9: Solar Wind Flow Pressure 1967 – 2019
The solar wind flow pressure is where the rubber starts to meet the road in terms of the solar influence on climate. It is the solar wind which pushes against the flux of galactic cosmic rays and changes the flux of particles hitting the Earth’s atmosphere. Solar Cycle 24 started out weak but had a much stronger second half – similar in amplitude to Solar Cycle 23.

Figure 10: Oulu Neutron Count 1964 – 2019
The galactic cosmic rays, some with the energy of a tennis ball, hit oxygen and nitrogen nuclei in the upper atmosphere and produce a cascade of particles, mostly neutrons, that reach as far as the Earth’s surface. On the way through, in the lower troposphere, these neutrons can provide nucleation sites for the formation of cloud droplets. Clouds change the planet’s albedo with more clouds producing cooling.
The peak in neutron count with each solar minimum occurs about a year after solar minimum with this due to the time it takes the solar wind to reach the outer solar system. So the next peak in neutron count should be about two years away. The amplitude of the peak is likely to be about 7000.
David Archibald is the author of American Gripen: The Solution to the F-35 Nightmare
“On the way through, in the lower troposphere, these neutrons can provide nucleation sites for the formation of cloud droplets.”
It seems like this would be easily verified from solar cycle to solar cycle. What do the data say? More cloud cover during low solar activity, or not?
“The differences in amplitude of the hemisphere is likely due to the major gas planets moving above and below the solar plane.”
If this has such a significant effect, then the elliptical orbits of Jupiter and Saturn as well as how they align relative to each other should have an even bigger effect. This must be a gravitational and most likely as tidal forces act on the fusion core varying it’s emitted energy density profile across its surface. Since it takes 100’s of thousands of years for the energy of fusion to make its way to the Sun’s surface while gravity acts immediately on the shape of the fusion core, there should be layers of varying activity from the fusion core to the surface. If the 11 year sunspot cycle is also due to the 11 year orbital period of Jupiter, then these should be layered between the core and the surface as well and that the current level of solar activity is due to tidal forces that acted on the fusion core of the Sun several ice ages ago.
” Since it takes 100’s of thousands of years for the energy of fusion to make its way to the Sun’s surface ”
Sadly, solar physics contains as many hypotheses presented as established facts as does climatology. We know very little of what occurs below the photosphere and certainly not enough to make statements like that.
We can not explain why the corona is much hotter than the photosphere if all the energy is flowing outwards. 2nd law violation.
Sadly, solar physics contains as many hypotheses presented as established facts as does climatology. We know very little of what occurs below the photosphere and certainly not enough to make statements like that.
Actually we do know this quite well. One tool is helioseismology
https://en.wikipedia.org/wiki/Helioseismology
“The Sun provides Earth with warmth, light, and the energy that fuels our entire ecosystem. As the largest body in the solar system, the Sun is the focal point and guides the planets in their orbits.
It is no surprise that it has been worshiped by cultures throughout history, yet there is still much that is not known about the Sun. Once thought to be constant and unchanging, it is only in modern times that is has become evident that the Sun is in fact extremely dynamic.
Since the invention of the telescope, knowledge of the Sun has grown at an extraordinary rate. Each discovery brings new ideas and often conflict. Even now, our understanding of the Sun is constantly being redefined as each new discovery is made.”
“We predict that Cycle 25 will be another small cycle, with an amplitude slightly smaller than (~95-97%) the size of Cycle 24. Weak cycles such as this are preceded by long extended minima and we expect a similar deep, extended minimum for the Cycle 24/25 minimum in 2020. Based on this solar cycle 25 prediction, we expect that coming minimum last through the end of 2020 or beginning of 2021. Similarly, we expect that the Cycle 24/25 minimum will include extended periods of spotless days throughout 2020 and into 2021.”
http://solarcyclescience.com/forecasts.html
Another indicator of the level of solar activity is the flux of radio emission from the Sun at a wavelength of 10.7 cm (2.8 GHz frequency). This flux has been measured daily since 1947. It is an important indicator of solar activity because it tends to follow the changes in the solar ultraviolet that influence the Earth’s upper atmosphere and ionosphere. Many models of the upper atmosphere use the 10.7 cm flux (F10.7) as input to determine atmospheric densities and satellite drag. F10.7 has been shown to follow the sunspot number quite closely and similar prediction techniques can be used. Our predictions for F10.7 are available in a text file, as a Jpeg image, and as a pdf-file. Current values for F10.7 can be found at: ftp://ftp.geolab.nrcan.gc.ca/data/solar_flux/daily_flux_values/fluxtable.txt.
This can be treated as a warning against harsh winters in North America.
Currently, the speed of the solar wind will drop.
http://umtof.umd.edu/pm/latest2day.imagemap?327,122
Comparison of UV solar activity in the three most recent solar cycles (SC) 22-24. The thick curves show the Mg II index timeseries twice smoothed with a 55-day boxcar. Dates of minima of solar cycles (YYYYMMDD) were determined from the smoothed Mg II index.
http://www.iup.uni-bremen.de/gome/solar/mgii_composite_2.png
Dear Mr Archibald,
Do you have an opinion about the Thermosphere Climate Index?
I would really like to hear it.
Best regards,
Scarface
http://www.spaceweather.com/
http://www.spaceweather.com/images2019/14jul19/TCI_Daily_NO_Power_Percentiles.jpg
Dear Scarface,
The Thermosphere Climate Index is a good attempt. Sometimes something really simple explains most of what you need to know. But in linking solar activity to climate I think you are better off thinking magnetic. The 1970s cooling period is associated with low activity in magnetic indices while the F10.7 flux was not all that different. That comes through to figure 10 and the neutron count. So in turn low cloud cover. A workable index might be a weighted thing with so much for EUV (jet stream effect), so much for the IMF, solar wind flow pressure, neutrons etc.
Thank you very much!
David Archibald, the strongest ionization occurs through the GCR is visible from 10 to 20 km. In high latitudes it is the level of the lower stratosphere, so it concerns ozone.
http://sol.spacenvironment.net/nairas/Dose_Rates.html
It is especially important in winter, because it affects the anomalies in the stratospheric winter polar vortex.
Production of C14 in the atmosphere indicates where the strongest ionization occurs as a result of secondary galactic radiation.
“The highest rate of carbon-14 production takes place at altitudes of 9 to 15 km (30,000 to 49,000 ft) and at high geomagnetic latitudes.”
https://en.wikipedia.org/wiki/Carbon-14
Because the GCR molecules respond to the Earth’s magnetic field, ionization at high latitudes does not occur evenly.
Sorry. The strongest ionization caused by GCR occurs at a height of 10 to 20 km, in high latitudes.
“Humans have long been shaping Earth’s landscape, but now scientists know we can shape our near-space environment as well. A certain type of communications — very low frequency, or VLF, radio communications — have been found to interact with particles in space, affecting how and where they move. At times, these interactions can create a barrier around Earth against natural high energy particle radiation in space. These results, part of a comprehensive paper on human-induced space weather, were recently published in Space Science Reviews.”
https://www.nasa.gov/feature/goddard/2017/nasas-van-allen-probes-spot-man-made-barrier-shrouding-earth
Coming out of the little ice age correlates well with …
“This is a list of when the first publicly announced television broadcasts occurred in the mentioned countries. Non-public field tests and closed circuit demonstrations are not included. This list should not be interpreted to mean the whole of a country had television service by the specified date. For example, the United States, Great Britain, Germany, and the former Soviet Union all had operational television stations and a limited number of viewers by the year 1939. However, in those countries, only very few cities in each country had television service. Television broadcasts were not yet available in most places.”
https://en.m.wikipedia.org/wiki/Timeline_of_the_introduction_of_television_in_countries
And the spike around the 50’s correlates to these…
“This is a list of when the first color television broadcasts were transmitted to the general public. Non-public field tests and closed-circuit demonstrations are not included.”
https://en.m.wikipedia.org/wiki/Timeline_of_the_introduction_of_color_television_in_countries
The space age began with the launch of Russia’s Sputnik on October 4, 1957. The space race was launched on January 31, 1958 when the United States sent Explorer I into space. In 1962, the first satellite television signal was relayed from Europe to the Telstar satellite over North America.
Note about Patrick Geryl:
“On this basis, Geryl and Ratinck came to the conclusion that in 2012, between December 19th and 21st, there will be a massive solar eruption that will reach the Earth within a few hours, that the Earth will be surrounded by a cloud of plasma, that the cloud of plasma will have a magnetic field in a different orientation than that of the Earth, and that in response the core of the earth will be deflected by the magnetic field, turning under the crust until it arrives at a different orientation. However, since the rotation of the core and the crust would then be in different directions, massive earthquakes and other phenomena would occur.”
Tayler Instability is the key factor as currently known, to the effect of solar system mechanics on parts of solar output that affect our weather and climate. Google Scholar it and Mlynczak, NASA Langley. Much work there proceeds, suddenly as it’s import is realised. Brett