Guest geological note by David Middleton
Most skeptics are familiar with the Warmunist efforts to erase the Medieval Warm Period and Little Ice Age.

However, many skeptics may not be aware of efforts to erase another paleoclimatological feature: The Holocene Highstand.
What is a highstand?
A highstand is one phase of the sea level cycle (AAPG Wiki)
- Rising
- Highstand
- Falling
- Lowstand
The highstand is the maximum sea level achieved during the cycle.
The Holocene Epoch
The Holocene Epoch was recently formally subdivided into three stages:
- Greenlandian Stage = Lower or Early-Holocene. 11.70 ka to 8.33 ka
- Northgrippian Stage = Middle or Mid-Holocene. 8.33 ka to 4.25 ka
- Meghalayan Stage = Upper or Late-Holocene. 4.25 ka to present
The abbreviation “ka” refers to thousands of years ago. Lower, Middle and Upper are generally used when referring to rock-time units. Early, Mid and Late are generally used when referring to time units (Haile, 1987). Prior to the formal subdivision, Lower/Early, Middle/Mid and Upper/Late were commonly used; however there was no formal nomenclature. The fake word, “Anthropocene” is not used by real geologists.
There is also an informal climatological subdivision of the Holocene:
- Preboreal 10 ka–9
- Boreal 9 ka–8 ka
- Atlantic 8 ka–5 ka
- Subboreal 5 ka–2.5 ka
- Subatlantic 2.5 ka–present
Source: Wikipedia
Why would there have been a Mid- to Late-Holocene highstand?
The so-called consensus would like for people to believe that sea level had been relatively static throughout most of the Holocene, only beginning to rise after Col. Drake drilled the first American oil well in Titusville PA. Being a geologist, and having gone to college in the 1970’s, I was taught that Holocene sea levels fluctuated and were generally higher than present day during the Mid- to Late-Holocene.

Evidence of these higher sea levels is now “explained away” as ocean siphoning. While ocean siphoning is a real phenomenon and the Mid- to Late-Holocene Highstand was not globally synchronous, there’s a lot of geological evidence to support it and two very logical reasons for it to have happened:
- The Mid-Holocene was much warmer than today and the Little Ice Age featured the coldest climate of the Holocene Epoch.
- The Mid-Holocene was host to the epoch’s glacial minimum, the glacial maximum occurred near the end of the Little Ice Age in the mid-1800’s. The glacial expansion period is known as Neoglaciation.
Warmer and less ice 6,000 to 3,000 years ago, coldest temperatures and maximum ice extent 500 to 150 years ago, suggests that the Mid- to Late-Holocene sea level should have been higher than that of the Little Ice Age.


Most of the geological evidence suggests that sea levels should have been at their highest 6,000 to 3,000 years ago and should have been falling from 3,000 to about 150 years ago… with or without ExxonMobil.
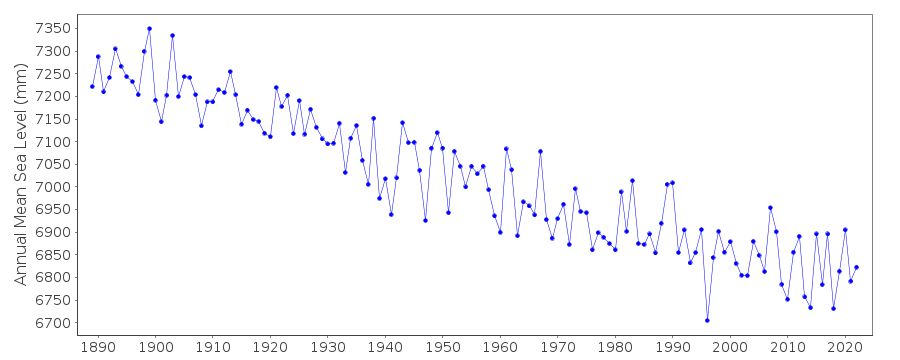
The sea level reconstruction of Jevrejeva et al., 2014 (J14) indicates that sea level was falling in the early 1800’s.

Geological evidence for a Mid- to Late-Holocene highstand
I’m going to let the graphics largely speak for themselves. On each graph I have noted which direction is older, added in the J14 reconstruction at the same scale and highlighted 3,000 years ago with a red arrow.
Qatar/Arabian Sea: 1-2 meters higher than today from 7,500 to 3,000 years ago…

Eastern Australia: 1-2 meters higher than today from 7,000 to 2,000 years ago…


Malaysia: 1-5 meters higher than today from 7,000 to 1,000 years ago…

Great Barrier Reef: >1 meter higher than today 6,000 years ago… And the reef didn’t drown.

Japan: As much as 10 meters higher than today 7,000 years ago and steadily falling until 1800’s.

Southwest South Africa: 3 meters higher than today 6,500 years ago.

Oahu, Hawaii: “2.00 ± 0.35” meters higher than today 3,500 years ago.

The modern rise in sea level is barely noticeable against the backdrop of Holocene sea level oscillations.

Siddall et al., 2003 (linked) is a reconstruction of global sea level over the past 470,000 years constructed from Red Sea sediment cores.
Here we analyse oxygen isotope records from Red Sea sediment cores to reconstruct the history of water residence times in the Red Sea. We then use a hydraulic model of the water exchange between the Red Sea and the world ocean to derive the sill depth— and hence global sea level over the past 470,000 years (470 kyr). Our reconstruction is accurate to within ±12 m, and gives a centennial-scale resolution from 70 to 25 kyr before present.
Siddall et al., 2003
Brock et al., 2008 featured the Holocene portion of Siddall’s reconstruction, clearly demonstrating that sea level was significantly higher than today for most of the past 3,000 years.

Sea level reconstructions are terribly imprecise. Oxygen isotope chronologies can have error bars as large as 30 meters (Siddall et al., 2003). Dating error bars are also generally fairly large. Fossil terraced beaches provide some of the best evidence for past higher sea levels, but they aren’t particularly easy to put into an Excel spreadsheet. Uplift and subsidence of the land can have a large impact on local sea level changes. Woodroffe & Horton, 2005 (linked) provide an excellent summary of the methods and challenges in reconstructing paleo-sea level changes.
Evidence for the Mid- to Late-Holocene highstand(s) is not present everywhere. Evidence is lacking on the Mississippi delta (Törnqvist et al, 2004). While it may not have been universal or synchronous, there does appear to be strong evidence that Holocene sea levels were significantly higher than today over much of the world and that past natural oscillations were of much higher magnitude than observed sea level changes over the past ~200 years.
Pierre Gosselin’s “No Tricks Zone” has a nice compendium of papers documenting past higher Holocene sea levels.
The following papers or abstracts were reviewed for the preparation of this post. I have requested full texts from many of the authors and received two, thanks to James Innes and Brian Jones. As I dig deeper into this, I may try to compose a more comprehensive post on Holocene sea level changes.
References
Brock, J.C., M. Palaseanu-Lovejoy, C.W. Wright, & A. Nayegandhi. (2008). “Patch-reef morphology as a proxy for Holocene sea-level variability, Northern Florida Keys, USA”. Coral Reefs. 27. 555-568. 10.1007/s00338-008-0370-y.
Collins, Lindsay, Jian-xin Zhao & Heather Freeman. (2006). “A high-precision record of mid-late Holocene sea-level events from emergent coral pavements in the Houtman Abrolhos Islands, southwest Australia”. Quaternary International. 145. 78-85. 10.1016/j.quaint.2005.07.006.
Compton, John. (2001). “Holocene sea-level fluctuations inferred from the evolution of depositional environments of the southern Langebaan Lagoon salt marsh, South Africa”. The Holocene. 114. 395-405. 10.1191/095968301678302832.
Correggiari, Annamaria,Fabio Trincardi, Leonardo Langone & Marco Roveri. (2001). “Styles of Failure in Late Holocene Highstand Prodelta Wedges on the Adriatic Shelf”. Journal of Sedimentary Research. 71. 218-236. 10.1306/042800710218.
Fletcher, Charles & A.T.Jones,. (1996). “Sea-level Highstand Recorded in Holocene Shoreline Deposits on Oahu, Hawaii”. Journal of Sedimentary Research. 66. 632-641. 10.1306/D42683CE-2B26-11D7-8648000102C1865D. Abstract only.
Gayes, Paul, DAVID B. SCOTT, ERIC S. COLLINS & DOUGLAS D. NELSON. (1992). “A late Holocene sea-level fluctuation in South Carolina”. Quaternary coasts of the United States. 155-160. 10.2110/pec.92.48.0155. Abstract only.
Gonzalez, Juan & Torbjörn Törnqvist. (2009). “A new Late Holocene sea-level record from the Mississippi Delta: evidence for a climate/sea level connection?”. Quaternary Science Reviews. 28. 1737-1749. 10.1016/j.quascirev.2009.04.003.
Grosjean, Martin, Suter, Peter, Trachsel, Mathias & Wanner, Heinz. (2007). “Ice‐borne prehistoric finds in the Swiss Alps reflect Holocene glacier fluctuations”. Journal of Quaternary Science. 22. 203 – 207. 10.1002/jqs.1111.
Grossman, Eric, Fletcher, Charles & Richmond, Bruce. (1998). “The Holocene sea-level highstand in the equatorial Pacific: Analysis of the insular paleosea-level database”. Coral Reefs. 17. 309-327. 10.1007/s003380050132.
Grossman, Eric & Charles Fletcher. (1998). “Sea level higher than present 3500 years ago on the northern main Hawaiian Islands”. Geology. 26. 10.1130/0091-7613(1998)026<0363:SLHTPY>2.3.CO;2.
Haile, N.S. “Time and age in geology: The use of upper/lower, late/early in stratigraphic nomenclature”. Marine and Petroleum Geology. Volume 4, Issue 3. 1987. Pages 255-257. ISSN 0264-8172, https://doi.org/10.1016/0264-8172(87)90048-1 (http://www.sciencedirect.com/science/article/pii/0264817287900481)
Jameson, J., C. Strohmenger. “Late Pleistocene to Holocene Sea-Level History of Qatar: Implications for Eustasy and Tectonics”. AAPG Search and Discovery Article #90142 © 2012 AAPG Annual Convention and Exhibition, April 22-25, 2012, Long Beach, California.
Jevrejeva, S. , J.C. Moore, A. Grinsted, A.P. Matthews, G. Spada. 2014. “Trends and acceleration in global and regional sea levels since 1807”. Global and Planetary Change. %vol 113, 10.1016/j.gloplacha.2013.12.004 https://www.psmsl.org/products/reconstructions/jevrejevaetal2014.php
Khan, Nicole, Erica Ashe, Benjamin P. Horton, Andrea Dutton, Robert E. Kopp, Gilles Brocard, Simon E. Engelhart, David F. Hill, W.R. Peltier, Christopher H. Vane, & Fred N. Scatena. (2016). “Drivers of Holocene sea-level change in the Caribbean”. Quaternary Science Reviews. https://doi.org/10.1016/j.quascirev.2016.08.032
Kench, Paul, Scott Smithers, Roger Mclean & Scott Nichol. (2009). “Holocene reef growth in the Maldives: Evidence of a mid-Holocene sea-level highstand in the central Indian Ocean”. Geology. 37. 455-458. 10.1130/G25590A.1.
Kermode, S, Gibling, Martin, Jones, Brian, Cohen, T., Price, David & Daley, James. (2013). “Determining the impact of the Holocene highstand at the coastal‐fluvial interface, Shoalhaven River, south‐eastern Australia”. Earth Surface Processes and Landforms. 38. 10.1002/esp.3382. Abstract only.
Lee, Stephen, Matthew Currell & Dioni Cendón. (2015). “Marine water from mid-Holocene sea level highstand trapped in a coastal aquifer: Evidence from groundwater isotopes, and environmental significance”. The Science of the total environment. 544. 995-1007. 10.1016/j.scitotenv.2015.12.014.
Leonard, N.D., Welsh, K.J., Clark, T.R., Feng, Y.Y., Pandolfi, J.M., & Zhao, J. (2018). “New evidence for “far-field” Holocene sea level oscillations and links to global climate records”. Earth and Planetary Science Letters Volume 487, 1 April 2018, Pages 67-73
DOI:10.1016/j.epsl.2018.02.008
Lessa, Guilherme & Masselink, Gerhard. (2006). “Evidence of a Mid-Holocene Sea Level Highstand from the Sedimentary Record of a Macrotidal Barrier and Paleoestuary System in Northwestern Australia”. Journal of Coastal Research. 22. 10.2112/05A-0009.1.
Lobo, Francisco José & Luis Fernández Salas, F Hernández-Molina, R González, Joao Dias, V Díaz-del-Río & Luis Somoza. (2005). “Holocene highstand deposits in the Gulf of Cadiz, SW Iberian Peninsula: A high-resolution record of hierarchical environmental changes”. Marine Geology. 219. 109-131. 10.1016/j.margeo.2005.06.005.
Long, Antony J., Natasha Barlow, Sue Dawson, Jon Hill, James Innes, Catherine Kelham, Fraser Milne & Alastair Dawson. (2016). “Lateglacial and Holocene relative sea-level changes and first evidence for the Storegga tsunami in Sutherland, Scotland: SEA LEVEL CHANGES IN NORTHERN SCOTLAND”. Journal of Quaternary Science. 31. 239-255. 10.1002/jqs.2862.
Mann, Thomas, Rovere, Alessio, Schöne, Tilo, Klicpera, André, Stocchi, Paolo, Lukman, Muhammad & Westphal, Hildegard. (2015). “The magnitude of a mid-Holocene sea-level highstand in the Strait of Makassar”. Geomorphology. 257. 10.1016/j.geomorph.2015.12.023. Abstract only.
May, Andy. “A Holocene Temperature Reconstruction Part 4: The Global Reconstruction.” Watts Up With That?, 9 June 2017, wattsupwiththat.com/2017/06/09/a-holocene-temperature-reconstruction-part-4-the-global-reconstruction/.
Moore, David G. & Joseph R. Curray, 1974. “Midplate Continental Margin Geosynclines: Growth Processes and Quaternary Modifications”, Modern and Ancient Geosynclinal Sedimentation, R. H. Dott, Jr., Robert H. Shaver
Rice, Johnathan Aaron & Alexander Simms. The Holocene History and Facies Architecture of the Nueces Bayhead Delta of the Northwestern Gulf of Mexico. (2015). UC Santa Barbara, Masters Thesis. https://cloudfront.escholarship.org/dist/prd/content/qt31k339wf/qt31k339wf.pdf
Sarti, G., Rossi, V., Amorosi, A., Bini, M., Giacomelli, S., Pappalardo, M., … Sammartino, I. (2015). “Climatic signature of two mid–late Holocene fluvial incisions formed under sea-level highstand conditions (Pisa coastal plain, NW Tuscany, Italy)”. Palaeogeography, Palaeoclimatology, Palaeoecology, 424, 183–195. https://doi.org/10.1016/J.PALAEO.2015.02.020
“Sea Level Cycle Phase and Systems Tracts.” Sea Level Cycle Phase and Systems Tracts – AAPG Wiki, American Association of Petroleum Geologists, wiki.aapg.org/Sea_level_cycle_phase_and_systems_tracts.
Siddall M, Rohling EJ, Almogi-Labin A, Hemleben C, Meischner D, Scmelzer I, Smeed DA (2003). “Sea-level fluctuations during the last glacial cycle”. Nature 423:853–858 LINK
Simms, Alexander, Niranjan Aryal, Yusuke Yokoyama Hiroyuki Matsuzaki & Dewitt, Regina. (2009). “Insights on a Proposed Mid-Holocene Highstand Along the Northwestern Gulf of Mexico from the Evolution of Small Coastal Ponds”. Journal of Sedimentary Research – J SEDIMENT RES. 79. 757-772. 10.2110/jsr.2009.079. Abstract only.
Strachan, Kate, Jemma Finch, Trevor Hill & Robert Barnett. (2014). “A late Holocene sea-level curve for the east coast of South Africa”. South African Journal of Science. 110. 1-9. 10.1590/sajs.2014/20130198.
“TAR Climate Change 2001: The Scientific Basis.” IPCC, 2001, www.ipcc.ch/report/ar3/wg1/.
Törnqvist, Torbjörn, Juan Gonzalez, Lee Newsom, Klaas van der Borg, Arie F. M. de Jong & Charles W. Kurnik. (2004). “Deciphering Holocene sea-level history on the U.S. Gulf Coast: A high-resolution record from the Mississippi Delta”. Geological Society of America Bulletin. 116. 1026-1039. 10.1130/B2525478.1.
Umitsu, Masatomo. (1991). “Holocene Sea-Level Changes and Coastal Evolution in Japan”. The Quaternary Research (daiyonki-kenkyu). 30. 187-196. 10.4116/jaqua.30.187.
Woodroffe, S & Benjamin Horton. (2005). “Holocene sea-level changes in the Indo-Pacific”. Journal of Asian Earth Sciences. 25. 29-43. 10.1016/j.jseaes.2004.01.009. LINK
Zong, Yongqiang. (2004). “Mid-Holocene sea-level highstand along the Southeast Coast of China”. Quaternary International. Elsevier. Abstract only.
“Most skeptics are familiar with the Warmunist efforts to erase the Medieval Warm Period and Little Ice Age.”
Marcott, which is frequently cited by the warmists, especially over at SkS, erased most of the entire warmer holocene period, which is quite a feat.
As Steve McIntyre has frequently noted, both present day warming and the MWP are mere bumps in relation to the entire holocene periods warming.
Marcott had very low temporal resolution. Our entire 150 year temperature record wouldn’t have shown up.
Don’t let that stop you from accepting the consensus. Disagreeing with the consensus is genocidal hate speech.
“Note that that in Central Greenland the Little Ice Age was as cold as the last Pleistocne glacial interstadial, the Bølling-Allerød. 3,000 years before present is marked with a red arrow.”
Looks like an incorrect caption. Bølling-Allerød looks to be 14.5ka according to the graphic above the caption.
Two separate sentences.
Just think – you can still see this information and it has not been rooted out and purged. In a couple of years all of these sources will have been memory holed and the new truth is that the earth was a garden of eden until the evil capitalists came and ruined everything.
“In a couple of years all of these sources will have been memory holed and the new truth…” It won’t matter, it’s been said the earth ends in 12 years.
“Dating error bars are also generally fairly large.”
That’s been my dating experience, too.
Oh, you’re talking about…. Oh…
Never mind.
🙂
I think what you may be saying is that beer goggles have been the source of many a dating error in bars.
“Here we analyse oxygen isotope records from Red Sea sediment cores to reconstruct the history of water residence times in the Red Sea. We then use a hydraulic model of the water exchange between the Red Sea and the world ocean to derive the sill depth— and hence global sea level over the past 470,000 years (470 kyr). Our reconstruction is accurate to within [+/- 12 m]
612 m, and gives a centennial-scale resolution from 70 to 25 kyr before present.Siddall et al., 2003″
612m?? Is that really useful at all? Or am I missing something?
[Good find. Edited per Middleton. .mod]
The pitfalls of cutting and pasting from a pdf.
± 12 m became 612 m… Will fix.
Thank you David!
This is a neglected area that needed some attention, now this is a handy resource to draw from.
Will post this at my Forum, so I can keep track of it.
Essentially, for the past 8.5 ky, there is no global sea level change of enough magnitude to overwhelm local processes and that continues to this day. In that 8.5 k.y., coasts have generally prograded – deltas formed, beaches grown larger, barrier islands emerged, etc.
https://www.jstor.org/stable/4297898?seq=1#page_scan_tab_contents
Don’t tell the cult of Chicken Little, next thing you know they will proclaim the oceans are in danger of being filled in.
The Teenage Super Sleuths did a couple of videos on this topic. I’m glad to see the youth of America are waking up.
Sea Level
https://youtu.be/ZDRvPMvn1kc
Holocene
https://youtu.be/pqdBvA475fo
Well – it IS their future at stake – to coin the greenie-propagandist’s own phrase – I can’t imagine any of these kids would REALLY want the future warmists have in store for them if they really understood it.
Another stellar contribution, as usual, Mr. Middleton. Thank you.
Climate change on any real scale is about geologic time. And notice how little there seems to worry about when you treat geologic time as a real thing, and not try to define it as occurring in backward looking 30-year blips, smoothed and averaged by obfuscating, self-serving sophists in the public employ, who think of themselves as planetary saviors and Nobel Peace Prize winners and who will retire with cushy pensions and health benefits, and who jet around the world to exotic locales on my tax money.
I confess, this started a long ranting essay on the nature of “special interests,” public sector jobs, college attendance memes and student borrowing, eternal childhood, public debt, unfunded promises, public sector unions, media brainwashing and world government Utopians. As a public service, I then deleted my rant. You’re welcome :-). But I hope all people will think long and hard about those issues and see how they play together in modern life and in so-called “climate science.” Or as I think more aptly describes it, in the bizarre reality of those spreading CAGW alarmism.
Don’t self censor, wuwt has plenty of space for more words
Great write-up David, look forward to more on the topic, figs 14 and 15 provided a nice ‘drain-rooter’ perspective for alarmists.
Now I can agree with the above caption from Figure 4 of the above article, …… simply because I figured it out like 20 years ago via use of my common sense thinking, logical reasoning and intelligent deductions, to wit:
(Copied n’ pasted from my MS Word file of “important commentary” worth saving)
“Hannibal lucked out when he decided to march his army and herd of elephants across the Alps to attack the Romans in 218 BC because there surely could not have been many glaciers or heavy snowpack blocking his route since documented history proves he accomplished that feat.” Reference: http://en.wikipedia.org/wiki/Hannibal's_Crossing_of_the_Alps
“And to verify said fact I did some checking and sure enough, Global Temperatures based on studies of the Sargasso Sea that covers the past 3,000 years gives credence to the fact that the snow and ice in the Alps must have been melting for more than 1,000 years during the Holocene Interglacial Period prior to Hannibal’s trip, to wit: ”
Ref: http://krusekronicle.typepad.com/kruse_kronicle/images/3000_3.gif
Cheers, ….. Sam C, ….. the ole Hillbilly from central WV whose only educational claim is an AB in Teaching.
Samuel– central WV? Howdy, pardner, from the west MD mountains where I barely escaped a killing frost just a couple days ago.
A Mountaineer B.S. in Geology here, from the little Ohio River village of McMechen up in the Northern Panhandle. Not a hillbilly, we call ourselves River Rats.
And a big “hello” to you two ….. and thanks for your response.
“HA”, at least I now know that a couple of people have read my postings.
I should have stated “an AB in Education” …… which is a Teaching Degree. (B & P Science)
But I only taught HS for 3 months before making a career change to Logical Designer.
These mm order sea level rises may continue for another 2-3 decades, as the ocean currents are distributing stored heat, but from then it might be a ‘god help us’ situation with global temperatures downhill trend and couple of centuries of cooling and ice build up.
http://www.vukcevic.co.uk/DownTrend.htm
If so, those poor primary schools demonstrating children might learn their proper climate change lesson in their retirement years.
Vuk, I think it’s the little up-tic in the Modern Warm on your graph that seems to be driving the CAGW crowd a little berzerk. Or maybe, that’s too much like being a little bit pregnant and they’re really all just totally berzerk. Actually, I feel sorry for ’em. It must be very frustrating to spend your whole life looking for something so serious but manageable, something you can save the world from.
Interesting, thanks for the information. I have been fascinated with this since I discovered these papers several years ago. Once in awhile you find unexplained oyster shells a meter above mhw, but these are usually collections from the coastal tribes. Some of these widespread location claims are not very evident or heavily reworked, and there has been some skepticism from a geologist I know, but the one on the western shore of Matagorda Bay (Zimmerman Road) just S of Magnolia Beach is over 3 meters high and may fit this category. This ridge may be either from a very high hurricane or lesser one with sea level higher. Don’t know if it has been dated.
Morton, R.A., J. G. Paine and M. D. Blum. 2000. Responses of stable bay margin and barrier-island systems to holocene sea-level highstands, western Gulf of Mexico. Journal Sedimentary Petrology. 70(3):478-490. And then there is this–
Lowrie, A., S. J. Moffett, T. C. Klekamp and R. Hamiter. 1998. Eustatically-driven, Mississippi River Holocene delta-switching as part of global highstand process. Transactions Gulf Coast Association Geological Societies. 48:193-201. Connected to delta switching. And this—
Blum, M. D., A. E. Sivers, T. Zayac and R. J. Goble. 2003. Middle holocene sea-level and evolution of the Gulf of Mexico coast. Transactions Gulf Coast Association Geological Societies. 53:64-77.
Hadn’t seen Rice or Simms later work or the No Tricks list, but looks like lots of evidence.
I forgot to include Blum’s work on the Texas Gulf Coast.
All around SE Asia, from the Philippines, Vietnam to Thailand, you can see the relatively recent evidence of 1-2 M higher ‘shoreline’ cut into all the limestone cliffs everywhere. The present ocean level didn’t cause that erosion from hydraulic wave action. Whether this is from more water volume in the global ocean at the start of the Holocene, or the land has been or is rising up relative to the ocean level, I am not sure about. The oceans are not a bath tub, as evidenced by the planetary geoid and changing gravitational circumstances from earth’s crust along with associated isostatic effects.
Thanks as usual, David — nice geologic background to see the current conditions as completely innocuous. Makes the sea-level scare-mongers look even less than infantile.
It appears that the science is settled regarding sea level since entering the current interglacial, at least if you talk to geologists.
Here’s something that I’ve brought up in various contexts a couple of times, but I’ve never seen officially addressed by anyone. (I do note now, though, that the “siphoning” web page addresses it indirectly; see below.) Taking claims that the sea floor is sinking at face value, then that means something else has to be rising in order to compensate, and that something else would generally be dry land. And since there is about 3x as much sea floor as there is dry land, then the dry land may be rising at a rate about 3x as fast as the sea floor is sinking.
So for every 1mm drop in the ocean floor, we might expect up to a 3mm rise in dry land, overall. So maybe alarmist concerts that our seashores and other land areas may be inundated in short order are just a bit overblown?
From https://skepticalscience.com/Sea-Level-Isnt-Level-Ocean-Siphoning-Levered-Continents-and-the-Holocene-Sea-Level-Highstand.html :
“This unequal loading forces the downward flexure of the Earth’s surface under the ocean, and uplift of the continents. In response, the more fluid-like material down in the Earth’s mantle is displaced sideways by the downward flexure of the ocean basin, and therefore is forced to flow under the continents – where there is no extra loading (Clark [1978]). This does not happen in the centre of the ocean basins, with extra glacial meltwater loading, because there is nowhere for the viscous mantle material to be laterally displaced to. Once again, the adjustment for this process is long and continued on well after the ice sheets had ceased supplying meltwater to the oceans.”
That page then goes on to say the following. Up until this point in time I hadn’t realized that the satellite altimetry data has had a 0.3mm annual “fudge factor” being added to it:
“In fact, so substantial are the combined effects glacial forebulge collapse and continental levering that even today satellite altimetry measurements have be be revised upward at a globally-averaged 0.3mm per year – to account for the subsidence (deepening) of the ocean basins (Douglas & Peltier [2002]), as this subsidence is obscured by current sea level rise.”
As a matter of fact it has been suggested that the continents are on average rising, based on the frequent occurrence of raised shorelines and “rasas” i. e. series of successively older, successively higher shorelines:
https://www.researchgate.net/publication/228565750_Relative_sea-level_fall_since_the_last_interglacial_stage_Are_coasts_uplifting_worldwide
A quick look at GPS measurements suggests the same:
https://www.sonel.org/-Vertical-land-movement-estimate-.html?lang=en
David ==> Can you cite the source of your Figure 2? I can not find the data for that in Alley (2000). (It may be hiding in there somewhere….)
https://www.ncdc.noaa.gov/paleo-search/study/2475
I cite the original reference…
Alley, R.B. 2000.
The Younger Dryas cold interval as viewed from central Greenland.
Quaternary Science Reviews 19:213-226.
The data citation is…
Alley, R.B.. 2004.
GISP2 Ice Core Temperature and Accumulation Data.
IGBP PAGES/World Data Center for Paleoclimatology
Data Contribution Series #2004-013.
NOAA/NGDC Paleoclimatology Program, Boulder CO, USA.
The NOAA instructions are odd. It says to cite the original reference and then provides a suggested data reference.
From your siphoning link”
” this exchange of mass created collapsing areas of ocean floor into which the ocean water was slowly siphoned.”
This collapse of the ocean floor could explain the Atlantis myth of a huge island that sank beneath the waves.
Continents can’t really sink. They consist of lighter rocks that “floats” on top of heavier rocks. Small continental fragments with thin continental crust can sometimes be more or less completely submerged (e. g. Rockall Plateau, Seychelles, parts of Zealandia), but even these are subaerial during glacial periods.
Islands can sink if the ocean basin they are sitting in sinks.
Yes, as a matter of fact all oceanic islands probably sink sooner or later. But not continents.
Who said Atlantis was a continent?
Platon, who invented the place. From Timaios
“For it is related in our records how once upon a time your State stayed the course of a mighty host, which, starting from a distant point in the Atlantic ocean, was insolently advancing to attack the whole of Europe, and Asia to boot. For the ocean there was at that time navigable; for in front of the mouth which you Greeks call, as you say, ‘the pillars of Heracles,’ there lay an island which was larger than Libya and Asia together; and it was possible for the travelers of that time to cross from it to the other islands, and from the islands to the whole of the continent over against them which encompasses that veritable ocean.”
(my emphasis)
Continents can sink with 2 or 3 kilometres of ice sitting on top.
Antarctica will pop up like a cork when the ice melts…well relatively anyway [depends on your time scale]. Fennoscandia is still rising after the last glaciation. In the 1740s Celsius [the temperature Celsius] calculated an uplift rate of 1.4cm/year in the northern Baltic Sea.
It used to be common knowledge that the Vikings were so successful because their ships were able to get very far up European rivers as their levels were higher, which enabled them to transport men, equipment and food far into Europe and carry away plunder
Tonyb
I’m sure that, being good global citizens, the vikings took public transportation.
Seriously, Wikipedia assures me that at least some of their longships only drew about a meter and were light enough to portage. I don’t think you’d need much of a river to float a craft like that.
Don
From your Wikipedia reference
“During the 9th century peak of the Viking expansion, large fleets set out to attack the degrading Frankish empire by attacking up navigable rivers such as the Seine. Rouen was sacked in 841, the year after the death of Louis the Pious, a son of Charlemagne. Quentovic, near modern Etables, was attacked in 842 and 600 Danish ships attacked Hamburg in 845. In the same year, 129 ships returned to attack up the Seine.[5] ”
The rivers were navigable as they were relatively high and wide and distances far into Europe could be reached
tonyb
Viking ships were narrow and shallow draught, and built for bot sailing and rowing, well adapted to river travel. Major harbor/trading cities on rivers have always been vulnerable since, for obvious reasons, they are always situated below (often just below) the first impassable stretch of the river.
The Holocene highstand is a non-controversial issue in the field. It is measurable in most places, but a global reconstruction is hopeless. As you say it stands to reason that the ice for the Neoglaciation must have come from the sea water.
Another problem is that as the climate has changed so much during the Holocene sea levels must have been going up and down all the time by amounts similar to the ones we are measuring now.
You are right, a global reconstruction is hopeless. Too many factors are unknown.
But all the same the sea level during the previous interglaciation, which is vastly more difficult to determine is supposed to be reconstructable. Presumably since a high Eemian sea-level is needed to make the sea-level threat more believable.
Yes, global averages are a misleading thing as we know from today whereby many places have a falling sea level ( complicated by land movement ) and declining temperatures affect one third of the world according to Dr Mueller (lots of caveats) but are offset by areas that are warming more strongly. So the interesting nuances are lost
I had always understood there to be sea level high stands at various times of which the last was around the 1500’s with another in the Viking era and one in the Roman era with more general long lasting ones further back in the Holocene.
When there is a highstand there is a corresponding lowstand. We surely had one of those around 1800 or so and sea levels have been rising ever since
Very nice work David. Thanks particularly for labeling which way is older — a helpful practice we should probably all try to emulate in the absence of a standard.
When some of the data are in years BP and other data in calendar years, it can get very confusing. Calendar year plots usually have older toward the left. Years BP plots tend to have older toward the right. They should just plot everything like a well log or stratigraphic column and put older toward the bottom… 😉
It reminds me of the time I visited the Welsh coast, and was looking at a castle on the rocks with a stone jetty that was some considerable distance above the high tide mark. I was told that the sea level was higher when that was built. Puts things in perspective.
It has lot to do with post-glacial isostatic uplift, rather than actual sea level rise or fall. Parts of N. Europe are still rising due to re-bounce of the crust, e.g. Stockholm’s tidal gage shows about half a meter sea level fall since 1900.
Vincent
You are probably thinking of Harlech castle. There used to be a sea gate so the garrison could be replenished from the sea during times of siege. The water is now some 2 miles away It was built at the tail end of the MWP and was during one of those high water stands
More stuff for the WUWT science pages!
This information should get me called a “liar” by multiple internet trolls in various venues.
Not that they don’t already call me a liar when I use good links and graphics to debunk their nonsense.
ATheoK
It sounds like you have run into Plentycoup, MGC, and Bob, which I suspect may be one and the same with different aliases.
I have carried out a thought experiment.
Assume honey has twice the density of water.
Take a bath tub and half fill it with honey. (the earth’s mantle) Then find number of flat cake tins (the continents) and 90% fill them with water and float them in the honey. Then carefully add a few inches of water. (the oceans) The water should not mix with the honey. After some time they will have sunk slowly (because of the high viscosity of the honey) into the honey/water layers and find equilibrium positions. Call that an interglacial state in your bathtub. Then take some of the water carefully out of the bathtub, freeze it into lumps and place the lumps onto some of the cake tins . The lumps do not have to be central.
Allow equilibrium positions to come about and call that a glacial state in your bath tub.
Relative to the previous equilibrium you will see that the water level on some cake tins might have risen because of the weight of the ice pushing the cake tins down but the water level on most cake tins will have fallen because of the conversion of the water to ice and having being removed from the water layer.
Now take the ice off the cake tins, melt it quickly and place the resultant water carefully back into the bath tub. You will see that the water level rises quickly on the cake tins. (to the mid holocene highstand) But the equilibrium positions due to the extra water in the water layer have not been reached because of the viscosity of the honey. Some cake tins will then rise a bit (equivalent to 1.2m on the east coast of Australia) and reach equilibrium positions. (current climate state) Cake tins that had been loaded with ice may continue rising (eg. Canada) having been pushed further into the viscous honey during the glacial.
I call this glacio-hydro isostasy in the bath tub.
Ocean siphoning is a clumsy phrase.
Any comments?
For the Earth the effect is local, not global. The land sinks under the icecaps and rises in a “forebulge” around them. It would undoubtedly ultimately equilibrate world-wide, but ice-ages don’t last nearly long enough for that. Rock is a lot stiffer than honey.